I. INTRODUCTION
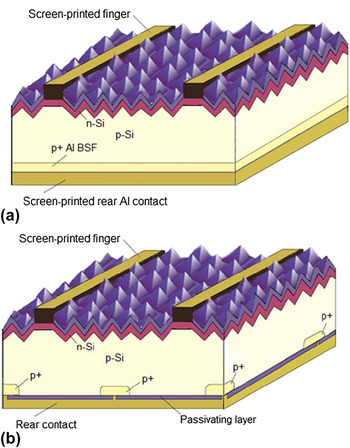
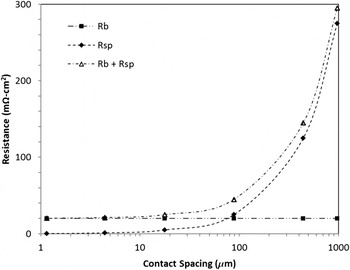
Although most commercially produced silicon solar cells use a full-area aluminum-alloyed rear electrode [see Fig. 1(a)], higher cell efficiencies can be obtained by the use of localized small-area aluminium-alloyed contacts through a rear passivating dielectric layerReference Zhao, Wang and Green1–Reference Schmidt, Merkle, Brendel, Hoex, de Sanden and Kessels8 as shown in Fig. 1(b), owing to the formation of local back surface field (LBSF) regions which reduce recombination at the metal–silicon interface by repelling the minority carriers from the interface. The use of such local aluminium-alloyed contacts can reduce the effective recombination velocity of the rear surface of the solar cell from ∼350 cm/s for a full area alloyed rear electrode to ∼70 cm/sReference Dullweber, Gatz, Hannebauer, Falcon, Hesse, Schmidt and Brendel6 and enable cell efficiency improvements of up to 1% absolute.Reference Jiun-Hong, Upadhyaya, Ramanathan, Das, Tate, Upadhyaya, Kapoor, Chia-Wei and Rohatgi4 However, for a given contact area fraction, the spreading resistance associated with collecting current at the localized small-area metal contacts might cause considerable power losses unless the contacts are closely spaced,Reference Zhao, Wang and Green9 as illustrated in Fig. 2. Ideally, both recombination and resistive losses are minimized by the use of closely spaced small-area contacts in which recombination is minimized by a shielding LBSF.
Schematics of screen-printed silicon solar cells with (a) a full-area rear aluminium-alloyed rear electrode and (b) localized aluminium-alloyed p+ metal contact regions at the rear surface. Although a planarized rear surface is shown, typically the rear surface etching process used industrially to isolate the phosphorus-diffused emitter to the front surface of the cell leaves, the rear surface partially textured.

Normalized resistance calculated as a function of circular metal contact spacing for a local metal contacting scheme showing the contributions of (i) the resistance due to current flow in the bulk of the wafer (square), (ii) the resistance due to the spreading resistance 10 (diamond), and (iii) the combination of (i) and (ii) (triangle). Calculations assumed a silicon wafer thickness and resistivity of 200 μm and 1 Ω cm, respectively, and contact coverage of 1%.

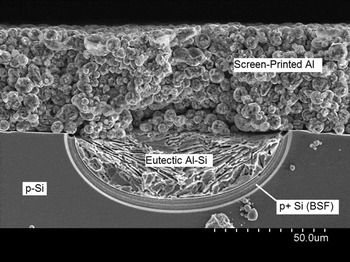
Patterning for localized small-area metal contacts of silicon solar cells has typically been achieved using deliberate patterning methods involving either the use of photolithographyReference Zhao, Wang and Green1,Reference Swanson, Beckwith, Crane, Eades, Young Hoon, Sinton and Swirhun2 or a laserReference Muller, Bothe, Gatz, Plagwitz, Schubert and Brendel3–Reference Schmidt, Merkle, Brendel, Hoex, de Sanden and Kessels8 to make the small-area dielectric openings. Photolithographic methods, though capable of high resolution patterning, are considered far too complex and expensive for solar cell manufacturing. Although laser patterning demonstrates both processing and cost advantages over photolithography technique, its damage to the silicon lattice may lower the shunt resistance for a rear floating junction.Reference Wenham, Chan, Honsberg and Green10 Furthermore, high patterning reliability and satisfactory processing throughput must be ensured for laser patterning to be adopted for mass industrial production.Reference Junge11 Recent work has also explored the use of inkjet and aerosol printing to form the localized contact regions.Reference Lennon, Utama, Lenio, Ho-Baillie, Kuepper and Wenham12, Reference Lenio, Howard, Jentschke, Lennon and Wenham13Figure 3 shows a scanning electron microscope (SEM) cross-section image of a localized metal contact region that was formed by alloying screen-printed aluminum paste through openings in a SiO2/SiNx dielectric stack layer patterned by aerosol jet etching.Reference Lennon, Renn, King and Wenham14–Reference Liu, Du, Lin, Hoex and Aberle16 The p+ BSF region, which is highlighted by selective etching of the p+ silicon regions and appears as the dark region under the aluminum eutectic region, can extend up to 10 μm into the silicon wafer depending on the size and spacing of the openingsReference Urrejola, Peter, Plagwitz and Schubert17,Reference Grasso, Gautero, Rentsch, Preu and Lanzafame18 and the firing conditions. One problem faced by all the above-mentioned patterning methods is that it is difficult to achieve low-cost, high-throughput, and robust patterning for closely spaced small-area contacts.
SEM cross-sectional image of a localized aluminium-alloyed contact region formed through a linear opening in a dielectric stack comprising 10 nm SiO2 and 200 nm SiNx.43 The opening was formed using the aerosol jet etching method described in Ref. Reference Lennon, Renn, King and Wenham14. Aluminum paste (Dupont paste L9245) was screen-printed over the entire rear surface and fired at 800 °C for 5 s. The formed BSF region is highlighted in the image by selective etching of p+ silicon in a solution of glacial CH3CO2H, 70% (w/w) HNO3 and 49% (w/w) HF in the volume ratio of 6:3:1.

Anodic aluminum oxide (AAO) is routinely used in the metal finishing industry to provide a strong corrosion resistant finish to aluminum surfaces. In many cases, the porous nature of these layers is exploited to impart decorative effects.Reference Diggle, Downie and Goulding19 AAO layers have also been extensively used as templates for nanoscale patterningReference Lee, Scholz, Nielsch and Gösele20,Reference Mikulskas, Juodkazis, Tomasiunas and Dumas21 ; however in these cases, the AAO is typically removed once patterning has been effected. In this work, the self-patterning porous nature of AAO layers, formed in situ on the surface of silicon solar cells, is used to enable small-area aluminum-alloyed contacts to silicon solar cells through a dielectric layer that comprises or includes the formed AAO.
Previous work has demonstrated that if a layer of aluminum is evaporated over a thin passivating dielectric layer on a silicon solar cell, and then anodized to form a dielectric stack comprising an inner layer of either SiNx or thermally grown SiO2 and an outer AAO layer, then the minority carrier lifetime in the device can be significantly increased over that measured using the SiNx or SiO2 layer alone, with the enhanced passivation shown to be due, at least in part, to stored positive charges in the AAO dielectric stack layers.Reference Lu, Wang, Lu, Lennon and Wenham22 In this paper, we report on experiments conducted to determine whether localized metal contacting of silicon solar cell devices could be achieved by evaporating a further layer of aluminum over the porous AAO passivation layer and firing the devices in an industrial belt furnace. The objective of the experiments was to establish the mechanism of localized metal contact and to establish whether self-patterned metal contacts could be formed without losing the passivation benefits of the porous layer. The mechanism of localized metal contacting was established using electron microscopy imaging of test structures before and after firing. Contact resistance measurements were used to verify the contact quality and to determine the dependence of the specific contact resistivity on firing temperature.
II. EXPERIMENTAL
A. Substrate preparation
Test structures were fabricated by growing a ∼10-nm-thick thermal SiO2 layer on both surfaces of alkaline-textured 1 Ω cm boron-doped Cz silicon wafers. Textured surfaces were used to investigate whether the metal contacting process was compatible with existing surface texturing processes used for commercial solar cell fabrication. Alkaline texturing is the preferred industrial texturing process used for antireflection and light trapping in monocrystalline silicon solar cells. It relies on the anisotropic etching of dilute KOH solutions and results in randomly distributed 3–5 μm high pyramids on the silicon surface which can reduce the reflection of the silicon surface from over 30% to as low as ∼11% for 800 nm wave length light. The front (illuminated) surface of the test structures was coated with a 75-nm layer of SiNx, deposited by remote plasma-enhanced chemical vapor deposition (PECVD), to form an antireflection coating. The test structures were cleaned in a 3:1 solution of 96% (w/w) H2SO4 (J. T. Baker) and 35% H2O2 (APS Chemicals, Seven Hills, NSW, Australia) for 6 min and an aluminum layer of thickness ∼650 nm was then thermally evaporated over the rear SiO2 surface and anodized to form an AAO layer over the interfacial SiO2 layer using the method described below.
B. Anodization
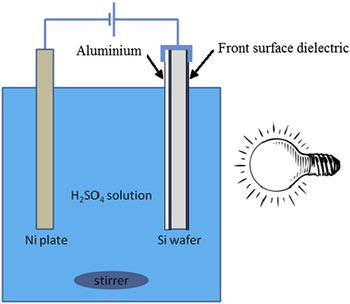
Test structures were processed one at a time using the apparatus shown in Fig. 4, with each wafer being immersed in 0.5 M H2SO4 at 25 ± 1 °C and connected to the positive terminal of a power supply. A nickel electrode, connected to the negative terminal of the power supply, was used as the counter electrode and a magnetic stirrer was used to ensure good mixing of the electrolyte at all times during the anodization process. Anodization was performed under illumination using a daylight (6400 K) 50 W compact fluorescent light bulb with a constant voltage being applied to the aluminum surface of the wafer. An anodizing voltage of 25 V was used for all experiments. The anodization current was used as an indicator of anodization progress, with a minimum value indicating when the anodization was complete. In most cases, the anodization duration was between 5 and 10 min.
Apparatus used to anodize aluminum layers on a surface of passivated silicon wafers.

During the anodization process, hydrogen gas is evolved at the counter electrode due to the reduction of hydrogen ions in the acidic electrolyte. At the anode (i.e., the rear aluminum surface of the test structures), the aluminum is oxidized to form Al(OH)3 first, which is then subsequently dehydrated to form a porous aluminum oxide or AAO. The pores form because Al(OH)3 has considerable solubility in acidic electrolytes and so an equilibrium is reached between its formation and dissolution in the electrolyte and its dehydration to Al2O3. It is the existence of this equilibrium which results in the porous AAO layer, with the pores providing the electrolyte access to unreacted aluminum.
The spacing and size of the formed pores can be controlled by the choice of electrolyte and anodization voltage.Reference Lu, Chen and Lennon23 With the anodization conditions described above, the pore diameter and spacing was ∼5–10 and 55 nm, respectively. Although more regular pore sizes and spacing can be achieved with two-step anodization,Reference Lee, Nielsch and Gosele24 the additional complexity of the two-step process may reduce the cost-effectiveness of the metal contacting approach without introducing any real benefits.
C. AAO pore widening and metallization
To improve the subsequent penetration of aluminum through the AAO layer for contacting the underlying silicon, the AAO was etched in 0.5 M H3PO4 to enlarge the pore size and thin the barrier layer which forms at the base of the pores adjacent to the SiO2 layer during anodization. Initial experiments indicated that prolonged etching resulted in a reduction in passivation provided by AAO layers; therefore, comparatively short etching times between 3 to 5 min were used for the experiments reported in this paper to ensure retention of the passivation properties of the layers.
After the pore widening, a further aluminum layer of thickness ∼1 μm was thermally evaporated over the porous AAO layer and then fired in an industrial centrotherm infrared firing furnace. For all firing temperatures, test structures experienced the peak temperature for a period of 4.5 s (estimated from the belt speed and the lengths of the high temperature zones) and were placed on the furnace belt with the aluminum surface facing upwards. Quick ramp up times were used because they are known to result in superior BSF formation for full-area alloyed aluminum rear electrodes for screen-printed silicon solar cells.Reference Narasimha and Rohatgi25
D. Characterization
Photoconductance (PC) measurements were performed before and after anodization and after pore widening to ascertain the effect of anodization and pore widening on implied V oc of the test structures, which was calculated from the PC measurements usingReference Sinton, Cuevas and Stuckings26:
 $${\rm{Implied }}\,\,V_{\rm{oc}} = {{kT} \over q}\ln \left( {{{\Delta n[N_A + \Delta n]} \over {n_i^2 }}} \right)\quad ,$$
where k, T, and q represent Boltzmann's constant, the absolute temperature (K), and the electronic charge (1.602 × 10⁻¹⁹ C), respectively. The carrier injection level, Δn was calculated from the sheet PC under 1-sun irradiation, N A represents the boron dopant density of the wafers used, and n i is the intrinsic carrier concentration of silicon (8.6 × 109 cm−3 at 25 °CReference Sproul and Green27). The implied V oc (at 1-sun excitation levels) was used as an indicator of the passivation quality for all test structures.
The mechanism of metal contacting was studied using electron microscopy. To see the effect of firing on the silicon surface, the AAO layer (and overlaying aluminum) was removed by immersing the test structures (after firing) in 85% (w/w) H3PO4 at 80 °C for 20 min to ensure complete removal. Subsequently, a p+ selective etching was performed on some of the test structures for 20 s to reveal the formation of p+ regions in silicon. This selective etching solution (as used for the SEM image shown in Fig. 3) is a mixture of CH3COOH, HNO3, and HF, which etches p+ silicon faster than lightly doped p-type silicon.Reference Raineri, Privitera, Vandervorst, Hellemans and Snauwaert28 Plan-view SEM images were used to examine the metallized silicon surface, whereas cross-sectional SEM images were used to reveal information at the interfaces. Transmission electron microscopic (TEM) imaging was used to examine the nature of the various interfacial surfaces (i.e., aluminum, AAO film, silicon, and alloy). All test structures used for imaging were fired at ∼700 °C peak temperature for a period of 4.5 s.
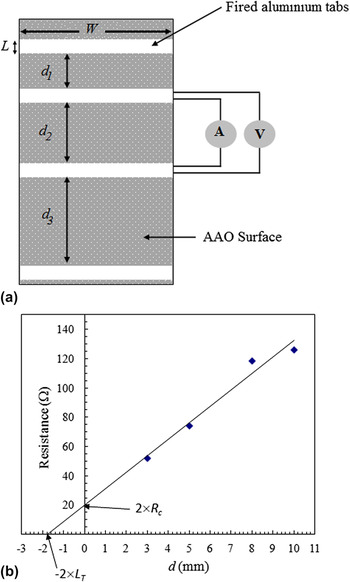
Transmission line model (TLM) measurementsReference Berger29,Reference Schroder and Meier30 were used to estimate the contact resistance of the metal contact regions as a function of firing temperature. In the TLM experiments, SiO2/AAO dielectric stack layers were formed over 4.2 × 4.2 cm p-type silicon wafer surfaces, and then 0.8 mm wide aluminum tab regions were thermally evaporated over the dielectric stack and fired. A laser was used to cleave 10-mm-wide structures [as depicted in Fig. 5(a)] from the fired wafers. Resistances were measured between pairs of aluminum tabs using a 4-point probe. The contact resistance, R c (Ω), was estimated from the y-intercept when the measured resistance was graphed as a function of the distance between tabs as described in Ref. Reference Berger29 and shown in the example TLM graph in Fig. 5(b). The current can transfer from the semiconductor to the metal over a distance that is less than the width of the metallized area, L. The characteristic distance over which current transfers to the metal is called the transfer length, L T, and can be estimated from the negative x-axis intercept as shown in Fig. 5(b).
(a) Test structure used to measure the contact resistance of the metal contacted regions formed by thermally evaporating aluminum over tab regions on an AAO surface of a silicon wafer fragment and then “firing” the test structure in a belt furnace at different peak temperatures. Values of L and W used for the measurements were 0.8 mm and 10 mm, respectively. (b) Example graph of measured resistance, R, as a function of distance between metal pads, d, showing how R c and L T were estimated from a least-squares linear fit to measured R values.

The specific contact resistance, ρc (Ω cm2) is estimated from R c and the area over which current effectively transfers, A eff using
 $$\rho _{\rm{c}} = R_{\rm{c}} \times A_{\rm{eff}} \quad ,$$
where A eff is usually taken to be the min (L T, L) × W, where W is the length of the metal tab area.Reference Berger29 However, when metal is fired through the AAO layer, A eff may be less than min (L T, L) × W because current is not being uniformly transferred to the metal over the metallized tab area. Consequently SEM images of the metallized and fired test structures were used to estimate the fraction of the metal tab area where metal physically contacted the silicon.
III. RESULTS
A. Passivation
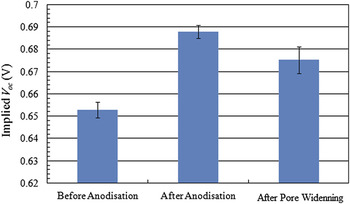
The implied V oc values, measured using PC for test structures having a 10 nm SiO2/75 nm SiNx dielectric stack on the front surface and a 10-nm SiO2 layer on the rear surface: (i) after SiNx deposition; (ii) after aluminum evaporation on the rear surface and anodization; and (iii) after pore widening, are shown in Fig. 6. The implied V oc increased by ∼35 mV after anodization. This represented a 5.4% increase over the implied V oc measured after SiNx deposition and is considered to be largely due to charges that become stored in the SiO2/AAO dielectric stack during anodization. Although Al2O3 deposited by atomic layer deposition has been reported to contain stored negative charges,Reference Hezel and Jaeger31–Reference Schmidt, Merkle, Hoex, van de Sanden and Kessels33 the stored charges in AAO layers differ because of the electrochemical formation process. During anodization negative charges reside in the electrolyte side of the AAO layer with electrolyte anions (e.g., sulfate ions) being trapped in the forming porous oxide. A compensating positive charge becomes stored in the nonporous barrier layer.Reference Lambert, Guthmann, Ortega and Saint-Jean34,Reference Vrublevsky, Jagminas, Schreckenbach and Goedel35 Capacitance–voltage measurements reported in Ref. Reference Lu, Wang, Lu, Lennon and Wenham22 confirmed that the polarity of the stored charge was positive and the magnitude of the charge density varied with anodization voltage and temperature. When the anodization was performed in 0.5 M H2SO4 at a voltage of 25 V, the stored charge was measured to be 4.84 ± 0.14 × 1011 cm−2 for SiO2/AAO layers formed on alkaline-textured silicon surfaces.Reference Lu, Wang, Lu, Lennon and Wenham22 This charge density was considerably higher than the value of 2.44 × 1011 cm−2 that was measured for a reference thermally grown SiO2 layer of the same thickness of 10 nm.Reference Lu, Wang, Lu, Lennon and Wenham22 These stored charge measurements suggest that the AAO layer may enhance the concentration of electrons at the adjacent silicon surface forming an accumulation layer for n-type silicon and most likely an inversion layer on p-type silicon surfaces. Both interface effects can increase the implied V oc by reducing the concentration of one carrier type at the surface and thus reducing surface recombination.
Implied V oc values for test structures measured using PC: (i) after front surface SiNx deposition (i.e., before anodization), (ii) after aluminum evaporation and anodization in 0.5 M H2SO4 at 25 V, and (iii) after pore widening by etching in 0.5 M H3PO4 for 5 min.

A significant fraction of the 35 mV increase in implied V oc with anodization was lost after the pore widening by etching in 0.5 M H3PO4 for 5 min with the final implied V oc being only increased by 22 mV (or 3.4%) of the as-deposited value of ∼650 mV. It was assumed that the 0.5 M H3PO4 etching solution only attacked the pore walls and the barrier layer of AAO and did not affect the intervening SiO2 layer because the etch rate of thermally grown SiO2 in 85% (w/w) H3PO4 at 160 °C is only 0.18 nm/min.Reference Williams, Gupta and Waslik36 The reduction in implied V oc that occurred after the etching suggested that the passivation provided by the AAO depends on the properties of the pores and the barrier layer, and therefore can be impacted when significant fractions of the pore walls and barrier layer are removed to enhance metal contacting. Future experiments and modeling are required to evaluate the necessity of this pore widening process taking into account its impact on implied V oc and the potential benefit of reducing the series resistance associated with extracting current from solar cell devices.
B. Verification of the localized metal contacting and its mechanism
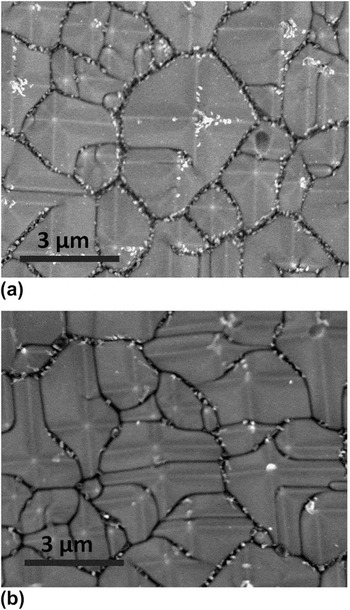
Figure 7(a) is a SEM image of a test structure that was fired with an ∼1-μm-thick aluminum layer evaporated over a 650-nm-thick AAO layer and then subsequently etched in 85% (w/w) H3PO4 to remove both AAO and aluminum. There are distinct white spots remaining on the peaks and valleys of the exposed textured silicon surfaces. As any metallic aluminum would have been removed during the H3PO4 etching, it is reasonable to assume that the white spots consist of aluminium–silicon alloys which are chemically resistant to H3PO4 etching. Energy-dispersive x-ray (EDX) spectroscopy showed high aluminum content at the white spots, which is consistent with the assumption that they are Al–Si alloys. Figure 7(b) is a similar SEM image but for a test structure which was fired with just the AAO layer (i.e., no further aluminum layer over AAO). No significant differences were evident with regard to the distribution or the density of the white spots between Figs. 7(a) and 7(b), suggesting that the evaporated aluminum layer did not affect the alloying process which resulted in the aluminum residue on the silicon surface [i.e., the white spots in Figs. 7(a) and 7(b)].
SEM images of (a) a sample that was fired with AAO and aluminum and then etched in 85% (w/w) H3PO4 to remove both the AAO and metal; (b) a sample that was fired with only AAO and then etched in 85% (w/w) H3PO4. The white spots corresponded to aluminium–silicon alloys. The presence of white spots in both images suggested that the evaporated aluminum layer for contacting was not involved in the alloying process.

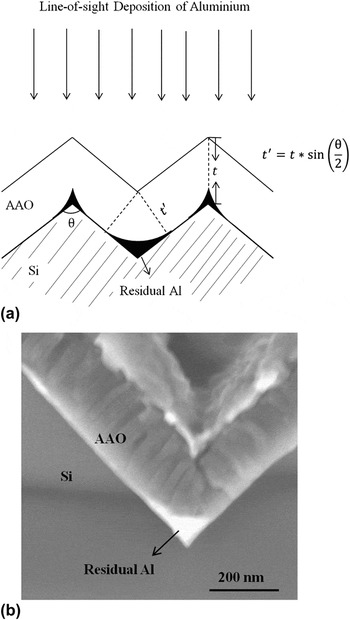
The schematic diagram in Fig. 8(a) shows a cross-section of a thin AAO layer formed on an alkaline-textured silicon surface. Due to the line-of-sight aluminum evaporation process, the initial thickness of aluminum is most likely not uniform with the peaks and valleys being coated by thicker metal layer. The method of anodizing used in these experiments relies on the aluminum layer remaining conductive to achieve complete conversion of metal to oxide over the full area of the wafer. The conducting path can be interrupted and even though the anodization current stabilizes at a minimum value, regions of unanodized aluminum can remain at the peaks and valleys of the textured surface. Figure 8(b) is a SEM cross-sectional image of a test structure that was anodized for only 90 s. Residual aluminum exists at the valley of the textured pyramidal surface just as predicted in Fig. 8(a). It was concluded that these localized regions of unanodized aluminum at the base of the AAO layer could provide an aluminum source for alloying and therefore resulted in the distinctive pattern of Al–Si alloy residue shown in Fig. 7.
(a) Schematic diagram demonstrating why residual aluminum is likely to occur at peaks and valleys of the textured silicon surface when the conducting path for anodization was cut off; (b) SEM cross-sectional image of an anodized test structure. The bright area at the valley region is residual aluminum from the anodization process.

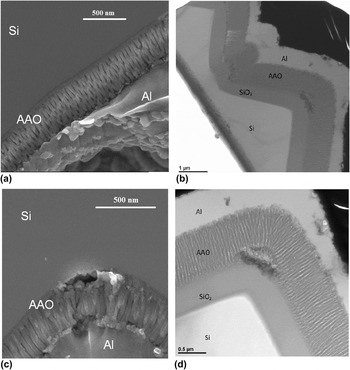
In contrast to the peak and valley regions, the AAO layers formed on the textured pyramid facets were preserved after firing as shown in Fig. 9. In these regions, the AAO layer provided a mask that prevented the outer aluminum layer from penetrating the dielectric and contacting the silicon surface. At the peaks and valleys, however, the AAO structure was damaged due to the alloying of the residual aluminum with silicon, enabling the outer aluminum layer to make contact to the underlying silicon.
Images showing that the AAO film on pyramid facades was preserved after firing, whereas the AAO at peaks and valleys was damaged. Samples were fired at ∼700 °C for 4.5 s with AAO/Al on the rear surface. (a) and (c) were taken using SEM, whereas (b) and (d) were taken using TEM. The metal penetration is only evident in TEM images as the sharp peaks from samples for cross-sectional SEM imaging were difficult to stay preserved during the preparation.

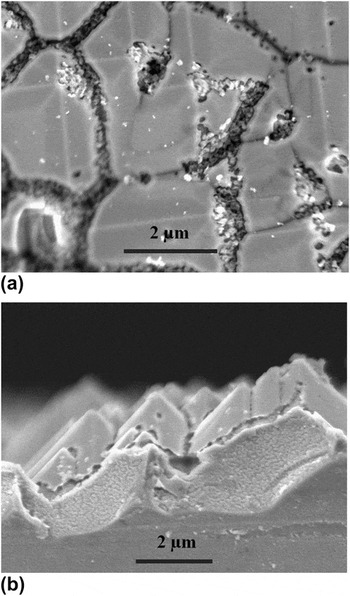
Although the firing of aluminum through AAO layers has realized the local metal contacts to solar cells, it would be preferable if localized p+ regions (i.e., localized BSF) are also formed at the metal contact regions to shield the minority carriers from the high surface recombination velocity associated with the metal–silicon interface. The plan-view SEM image in Fig. 10(a) shows that there were grooves along the pyramid valleys and holes at the peaks after the selective etching, confirming the formation of p+ silicon at those regions where silicon was etched faster by the selective etching solution. However, the cross-sectional image in Fig. 10(b) shows a lower level of localization below the silicon surface mainly due to the lateral diffusion of aluminum during the alloying process. In other words, p+ regions are extending laterally from the contact regions to lie under presumably intact regions of the AAO layer.
SEM images of a test structure after p+ selective etching. Before the selective etching, the test structure was fired at ∼700 °C for 4.5 s with AAO/aluminum on the rear surface, then etched in 85% (w/w) H3PO4 to remove AAO and metal: (a) a plan-view of the selectively etched silicon surface with the formation of alloyed regions in the valleys and peaks of the silicon alkaline-textured surface, and (b) a selectively etched cross-section, where the etched regions correspond to LBSF, which extended 1–2 μm into the silicon.

As the profile of localized metal contact depends on the silicon-textured morphology, it may be possible to control the spacing of the effective localized metal contacts by varying the texturing feature size. The alkaline texturing process can be adapted to vary pyramid size with little difference in screen-printed cell performance being reported for pyramid heights varying from 1–6 μm.Reference Ximello-Quiebras, Dastgheib-Shirazi, Scholz and Hahn37 Because the aluminum source for the alloying process arises from the residual metal after anodization, it is also possible to control the amount of residual aluminum and thus the contact area by varying the anodization duration. However, previous experiments have suggested that the passivation effect of AAO might be compromised if the duration of anodization is too short. Furthermore, rear surface etching used industrially to remove any residual phosphorus dopants from the rear surface, can planarize the textured surface to different extents depending on the duration of the etch and the chemical composition of the etching solution. Different extents of planarization may be able to be used to vary the contact percentage.
C. Contact resistance measurements
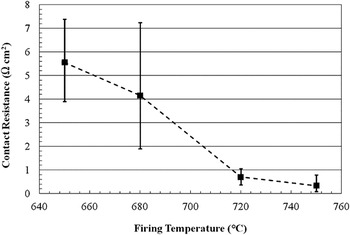
Figure 11 shows the mean contact resistance, as measured from TLM experiments, normalized for the metal tab area over which current transferred as a function of firing temperature. The error bars represent the minimum and maximum values of three independent measurements that were performed for each firing temperature. In all cases, the observed current flow was ohmic. Figure 11 shows that the area-normalized contact resistance decreased with increasing peak firing temperature and reached a minimum value of ∼0.3 Ω cm2 when test structures were fired at 750 °C. This finding is consistent with increased aluminum alloying at the higher temperature. In addition, the variability of the TLM measurements decreased with increased firing temperature suggesting that the metal contacting process became more repeatable at the higher temperatures. Although resistance due to current crowding into the small metal contact regions may also contribute to the measured contact resistance, it is likely that this contribution would be small due to the closely spaced contacts and that any change in resistance due to current crowding with different firing temperatures would not significantly affect the trend evident in Fig. 11.
Contact resistance normalized to metal tab area over which current transfers to the metal, graphed as a function of belt furnace firing temperature. All TLM test structures experienced the firing temperature for 4.5 s. The graphed values represent the mean of three independent TLM measurements, and the error bars denote the maximum and minimum values for each of the firing temperatures.

To take into account the fact that metal did not uniformly contact the silicon over the area used to normalize the contact resistance in Fig. 11, ρc was calculated by estimating the actual metal contact area from SEM images, such as shown in Fig. 7. If it is assumed that the contacting only happens at those white spots, the contact percentage is then the ratio of the white spot area to the total surface area. This value was estimated to be 1.9% for the sample in Fig. 7(a), which was prepared identical to the test structures used for the ρc measurement, and hence the metal contact area in the TLM experiments, A eff, was assumed to be 1.9% × A, where A represented the area of the metal tab over which current transferred to the metal. The value of ρc, calculated using A eff for the highest firing temperature tested, was ∼6 mΩ cm2. Although this is larger than values in the order of 10−5 Ω cm2 reported for full-area aluminium-alloyed rear contacts,Reference Cudzinovic and Sopori38 it is less than values reported for localized aluminium-alloyed contacts.
IV. DISCUSSION
Although this novel method for forming self-patterned localized contact regions to textured silicon solar cells can result in reliable metal contact with acceptable series resistance and scope for tuning the extent of metal–silicon alloying, the contacting method may present some electrical problems for devices. Although closely spaced contacts can minimize spreading resistance losses, minority carriers also need to be shielded from the high recombination velocity areas where silicon contacts the metal. Meemongkolkiat et al.Reference Meemongkolkiat, Nakayashiki, Kim, Kopecek and Rohatgi39 reported that the surface recombination velocity (SRV) for a full-area aluminum BSF increased from 280 to 550 cm/s when the BSF thickness decreased from 10 to 5 μm. This suggests that the BSF regions of the self-patterned contacts would most likely need to be significantly thicker than what was achieved in this work [see Fig. 10(b)], to maintain the high implied V oc values after metallization. However, significantly thicker BSF regions would result in increased lateral spreading from the alloying regions therefore bringing adjacent metal contact regions very close to each other and perhaps even overlapping. In other words, a lower level of localization occurs below the silicon surface due to the lateral interdiffusion of aluminum and silicon. This effectively increases the metal contact fraction and therefore increases the saturation current density associated with rear surface of the device resulting in a reduced V oc. Further work is required to establish an electrical model for the contacting process drawing on ideas presented in Ref. Reference Muller, Gatz, Bothe and Brendel40, so as to guide the optimization of LBSF thickness and contact geometry.
Further problems will most likely arise if high minority carrier concentrations exist at the rear surface. This may result if residual phosphorus from the emitter diffusion process is not removed. Although rear-side etching is commonly used in silicon solar cell manufacturing for this purpose, the rear etch process will at least partially planarize the rear silicon surface and thus may make the self-patterning process less reliable and sensitive to the nature of the rear etching process (e.g., type of etchant used and time of etching). Consequently, further experiments will be necessary to establish the sensitivity of the metal contacting process to partial planarization.
High minority carrier concentrations may also result if minority carriers are attracted to the rear surface by stored charges in the SiO2/AAO dielectric layer. As mentioned previously, the SiO2/AAO dielectric stack layers store positive chargesReference Lu, Wang, Lu, Lennon and Wenham22 which can induce an inversion layer at a p-type silicon surface if the charge density is sufficiently high. Dauwe et al.Reference Dauwe, Mittelstädt, Metz and Hezel41 demonstrated that electrons in an inversion layer formed on the rear surface of p-type wafers can flow laterally to the rear contact, resulting in parasitic shunting if the LBSF regions do not provide a sufficient potential barrier. However, as indicated in Fig. 10(b), the LBSF regions formed only extended 1–2 μm into the silicon, which might not be an effective potential barrier to shield the minority carriers from the high recombination metal contact areas. This issue of effective shielding of minority carriers may be able to be addressed by reversing the polarity of the stored charge in the AAO-containing dielectric stack. Future experiments will consider the use of PECVD-deposited AlOx layers instead of SiNx or SiO2, as potential interfacial layers since these layers have been demonstrated to store negative chargesReference Hezel and Jaeger31–Reference Schmidt, Merkle, Hoex, van de Sanden and Kessels33 and would therefore attract the majority of carrier holes to the rear surface in p-type wafers.
The potential to form a patterned dielectric with closely spaced localized contacts in a cost-effective and high-throughput process is of significant value to silicon solar cell manufacturing, especially if the high implied V oc values reported in this work and in Ref. Reference Lu, Wang, Lu, Lennon and Wenham22 can be realized in final devices. Although the wafer-based anodization process used in the reported experiments was very simple, existing photovoltaic electroplating or light-induced plating tools can potentially be adapted to enable the high-throughput anodizing that would be required for manufacturing. For example, the clips on Meco's cell plating line (CPL)42 could be used to contact an aluminum layer formed on a wafer surface, and anodization could proceed with an inert cathode being placed in the plating bath. The Meco tool has a cell production capacity of 50–100 MW/year (up to 3000 wafers/hour),42 (at the date this paper was written, URLs or links referenced herein were deemed to be useful supplementary material to this paper. Neither the author nor the Materials Research Society warrants or assumes liability for the content or availability of URLs referenced in this paper) and given that anodization of aluminum layers as thick as 650 nm can be performed in ∼10 min using the conditions reported here, wafer-based anodization at commercial throughput rates may be achievable.
V. CONCLUSION
AAO layers formed in situ on silicon wafers have been demonstrated to enable high minority carrier lifetimes and localized metal contacting. For the textured structures used in the work reported in this paper, implied V oc values were shown to increase by ∼35 mV after formation of an AAO layer on the rear surface. Furthermore, metal can be fired through these passivating layers to facilitate localized metal contact at the peaks and valleys of the textured silicon surface, with local aluminium-alloyed p+ regions formed at the points of aluminum contact. The specific contact resistivity of the metal contacts formed decreased with firing temperature and was estimated to be ∼6 mΩ cm2 when fired at 750 °C for 4.5 s. It was also shown that the variability of the measured contact resistance decreased with higher firing temperatures, suggesting the repeatability of the metal contacting method improved with higher firing temperatures. Further research is required to establish whether the described self-patterning method using AAO layers can be implemented in devices in such a way that high minority carrier lifetimes can be realized in the form of increased solar cell voltages and efficiencies. The results presented in this paper suggest that it would be challenging to realize high efficiency solar cell devices using the described contacting method. However, the mechanism by which contacting has been achieved may inspire exploration of other self-patterning approaches or novel applications of anodization on textured surfaces.
ACKNOWLEDGMENTS
This work has been jointly supported by Hanwha Solar America, Suntech Power Co. Ltd and the School of Photovoltaic and Renewable Energy Engineering at the University of New South Wales, Australia.