

I. Introduction
Much of the debate surrounding judicial elections involves the educative utility of “nasty, noisy, costly” competitive elections (Schotland Reference Schotland1998). Previous research finds that judicial institutions and campaigns are important factors in how citizens learn about and engage in judicial elections, but little is understood about other ways in which voters become informed. In this article, I examine how local media coverage affects voter participation in judicial elections. I gather new data on media coverage of state supreme court campaigns, examine the effect of media coverage on voter participation, and find that increasing rates of coverage—even when controlling for competitiveness, expense, and tone—result in greater rates of voter participation. Analyses show that while some of this effect can be attributed to campaign expense and advertising, media coverage is found also to have an independent effect on voter participation.
II. Voter Information and Participation in Judicial Elections
Voters participate in judicial elections much as they do in other types of contests. When individuals are knowledgeable about the candidates running, they are more likely to participate. Nevertheless, these elections are not always salient to voters, and they exhibit high rates of abstention. In recent years, close to one-fifth of all Americans who turned out to the polls failed to participate in a state supreme court race (Bonneau and Hall Reference Bonneau and Gann Hall2009). Critics argue that voters are not sufficiently well informed to hold judges accountable (Geyh Reference Geyh2003). This could be because campaigns or other political intermediaries such as the press do a poor job educating voters about judicial candidates (Caufield Reference Caufield and Streb2007; Schaffner and Diascro Reference Schaffner, Segal Diascro and Streb2007).
Despite these criticisms, research shows how competitive, expensive, partisan, and even churlish campaigns can educate and animate the electorate. The party label is arguably the most important heuristic in judicial elections (Klein and Baum Reference Klein and Baum2001; Schaffner and Streb Reference Schaffner and Streb2002; Hall Reference Hall2007). Partisan ballots stimulate participation by orienting voters toward fellow partisans. Even if voters know little about a candidate’s qualifications, they can make reasonable inferences about which individual will best represent their preferences. Nonpartisan, hybrid, and retention elections do not use party labels and exhibit more abstention than partisan contests. Without party labels, voters cue off of other sources of information such as a name (whether it appears to be of a particular gender, race, or member of a prominent political family), a recent political scandal, or critical judicial performance evaluations (Johnson, Schaefer, and McKnight Reference Johnson, Schaefer and McKnight1978; Dubois Reference Dubois1984; Frederick and Streb Reference Frederick and Streb2008; Kritzer Reference Kritzer2015; Gill Reference Gill, Bonneau and Gann Hall2017).
The competitiveness of judicial campaigns can also affect voter participation. Competitive elections attract campaign spending, interest group involvement, and media coverage, all of which alert voters to where candidates stand on issues important to them (Bonneau Reference Bonneau2005; Hall and Bonneau Reference Hall and Bonneau2006, Reference Hall and Bonneau2008; Goldberg Reference Goldberg and Streb2007). Campaign messages are key to voter knowledge. Television advertising is a highly salient means of judicial campaigning. Even when advertisements are churlish, they contain information that informs voters about which candidates will represent their political values (Hall and Bonneau Reference Hall and Bonneau2013; Hall Reference Hall2015; Hughes, Reference Hughesforthcoming).
The press is yet another source of civic education. Journalists convey information to voters that enhances the policy-making process, promotes democratic accountability, and furthers representation (Snyder and Strömberg Reference Snyder and Strömberg2010). Journalistic media include newspapers, television news broadcasts, radio shows, and, more recently, social media. The press informs voters by covering and contextualizing political campaigns, policy making, and the behavior of politicians (Chong and Druckman Reference Chong and Druckman2007). In one innovative study, Mondak (Reference Mondak1995) found that residents of neighborhoods in Pittsburgh where newspaper deliverymen went on strike were less likely to participate in local elections compared to their peers in Cleveland who were not subject to a similar drought of news. Druckman (Reference Druckman2005) found that newspapers were an especially informative medium, although others argue that the quality of reporting rather than the medium itself enhances voter knowledge (Zhao and Chaffee Reference Zhao and Chaffee1995; Norris and Sanders Reference Norris and Sanders2003).
The media, however, could also abet confirmation bias. Dubbing it the “Fox News Effect,” DellaVigna and Kaplan (Reference DellaVigna and Kaplan2007) found that Fox News’ entrance into a media market energizes conservative voters, boosting turnout and Republican vote-shares in these districts. More recently, the emergence of social media has raised questions such as whether online social networks can produce more informed, engaged citizens if they share news stories with one another. These online social networks reduce the costs of information and closely parallel other forms of human communication (Bond et al. Reference Bond, Fariss, Jones, Kramer, Marlow, Settle and Fowler2012). Nevertheless, some remain skeptical that these and other forms of electronic information are little more than political amusement (Prior Reference Prior2005; Vitak et al. Reference Vitak, Zube, Smock, Carr, Ellison and Lampe2011).
Unlike the broader literature on political participation, courts scholars have yet rigorously to consider the role the press plays in educating voters and stimulating participation.Footnote 1 This is unsurprising given how sparsely scholarly research finds local media cover state courts (Hale Reference Hale2006; Schaffner and Diascro Reference Schaffner, Segal Diascro and Streb2007; Yanus Reference Yanus2009; Vining and Wilhelm Reference Vining2011). For example, Schaffner and Diascro (Reference Schaffner, Segal Diascro and Streb2007) found that the average state court race received fewer than 10 newspaper articles per race, while Vining and Wilhelm (Reference Vining2011) found that a mere .01% of all state supreme court decisions received front-page coverage in local newspapers. If voters have few opportunities to learn about either their courts or candidates through traditional outlets such as the press, then we might not expect there to be much of a relationship between media coverage and voter participation.
Despite the scholarly literature’s skepticism, politicians and voters exist within a mutually strategic environment (e.g., Ferejohn Reference Ferejohn1986). Political agents tailor their behavior to their principals’ preferences when it is likely that an unpopular decision will result in their removal from office (e.g., Hall Reference Hall1987). Courts scholars find that incumbent, elected judges posture for reelection, particularly in high-profile cases (e.g., Brace and Boyea Reference Brace and Boyea2008), and this posturing is even more pronounced when justices’ votes are reported by local media (Cann and Wilhelm Reference Cann and Wilhelm2011). Therefore, excluding the press from models of voter participation in state court elections overlooks not only the broader scholarly literature on voter turnout but also the courts literature’s own interpretation of principal-agency. Put differently, judges already behave as if the press can generate voter engagement, so is this type of behavior rational?
III. Local Media and Voter Information in Judicial Elections
If the media inform voters and influence participation in judicial elections, then what does this process look like? Journalists investigate candidates, their positions on important issues, and their qualifications for the bench, and they report new information that will further a voter’s ability to cast rational votes. To these ends, the media fulfill their agenda-setting role as they help to filter and frame events for public consumption (Clayman and Reisner Reference Clayman and Reisner1998; Chong and Druckman Reference Chong and Druckman2007; Iyengar and Kinder Reference Iyengar and Kinder2010). Perhaps most saliently, this can involve the transmission of new, previously unknown information that might significantly sway voters who either had not planned to participate or who had intended to vote for another candidate.
For example, shortly after Wisconsin’s 2011 judicial elections, reporters from Wisconsin Public Radio and the Wisconsin Center for Investigative Journalism broke a major story relating to a physical altercation between two justices on the Wisconsin Supreme Court (Lueders Reference Lueders2011). At least three anonymous sources told reporters that David Prosser attempted to choke his colleague, Ann Walsh Bradley, over a ruling to limit collective bargaining rights for union members. Another source claimed that Bradley approached Prosser, “with fists up” (Lueders Reference Lueders2011, A9). These reports, coupled with others alleging that Prosser had verbally assaulted Chief Justice Shirley Abrahamsan, helped frame the Wisconsin Supreme Court as a combative institution (Marley Reference Marley2011). They also helped set the agenda for the next state supreme court election. In his effort to unseat incumbent Pat Roggensack, Ed Fallone aired 703 television advertisements attacking Roggensack for failing to hold Prosser accountable for “choking another justice.”Footnote 2
Local journalists break major stories like those from Wisconsin with some irregularity. More commonly, coverage of judicial candidates revolves around the day-to-day occurrences of the campaign. For example, reporters attend candidates’ speeches, appearances at community events, or debates; they ask questions, fact-check answers, record candidates’ behavior, and convey findings to their readers. Individually, these fleeting snapshots might not paint a complete picture of a candidate, her positions, or qualifications for office, but taken over the long run, they can accumulate among the electorate and help them to determine which candidate best represents their interests.
The Atlanta Journal-Constitution’s (AJC) coverage of the 2004 Georgia Supreme Court race between Leah Ward Sears and Grant Brantley illustrates how local media coverage can paint a cumulative picture of candidates and their positions and qualifications, as well as even whether the race is likely to be competitive.Footnote 3 The AJC’s coverage kicked off when it attended the January 31 “Families and Freedom” rally in Atlanta.Footnote 4 At that gathering, Governor Sonny Perdue (R) urged attendees to vote against incumbent Justice Sears—owing in no small part to the vote she cast in striking down the state’s antisodomy law (Baxter and Galloway Reference Baxter and Galloway2004d).Footnote 5 By late April, the AJC reported rumors—and later confirmed—that Brantley would oppose Sears with the help of prominent state Republican strategists (Baxter and Galloway Reference Baxter and Galloway2004e, Reference Baxter and Galloway2004f; Tharpe Reference Tharpe2004). The next month, the AJC attended Brantley’s inaugural campaign event and reported the attendance and endorsement of the state’s former attorney general—the named defendant in the 1986 US Supreme Court case originally upholding Georgia’s ban on sodomy (Baxter and Galloway Reference Baxter and Galloway2004b).Footnote 6
With just over a month before the election, the AJC announced that same-sex marriage had become the dominant issue in the race as gay rights groups endorsed Sears and the Christian Coalition endorsed Brantley (Baxter and Galloway Reference Baxter and Galloway2004a). But within a matter of days, the Sears campaign tried to shift the narrative to Brantley’s ethics and issues related to Sears’s race and gender.Footnote 7 The newspaper reported that Brantley, who claimed to have been nominated to be a US district court judge, had never actually received such a nomination (Rankin Reference Rankin2004). Sears then accused state Republicans of targeting female and minority judges in their quest for the bench (Baxter and Galloway Reference Baxter and Galloway2004c). Ten days before the election, the AJC provided its readers with extensive coverage of the only supreme court debate, which was highlighted by numerous references to the candidates’ positions on salient issues and repeated personal attacks on one another (Badertscher Reference Badertscher2004b).Footnote 8 By the last 3 days of the campaign, the Sears-Brantley battle was front-page material.Footnote 9 Between April 20 and July 20, 2004, the AJC published a total of 41 articles about the day-to-day jockeying for the court.Footnote 10 Throughout the race, the newspaper highlighted and framed the issues likely to have been of greatest importance to its readers.
Local media cannot only reflect the state of the judicial campaign, but so too can they contribute to it. Newspaper editors, for example, make endorsements and print other professional and lay opinions. These pieces can in turn become grist for political campaigns. During Alabama’s 2004 Republican primary elections, newspaper endorsements became an issue in each of the three supreme court contests. The Alabama Civil Justice Reform Committee (a special interest group aimed at limiting tort awards) aired 36 television advertisements in support of Mike Bolin and Patti Smith, touting their support from three of the state’s largest newspapers. In the third race, Tom Parker weaponized newspaper endorsements by attacking his opponent, incumbent Jean Brown, for having received the support of “every liberal newspaper in Alabama.”Footnote 11 He aired 404 television advertisements at a cost of over $100,000 to this end.
Reporters convey new information to voters, but they also help to reinforce information already before them. For example, the media report on candidates’ professional experience and qualifications, how they have ruled in previous cases, their partisanship (to the extent it is known), their endorsements (or denunciations), and so on. Voters could find this information on their own, but reporters help to lower the costs of information by putting it directly in front of them.
Consider former Idaho Supreme Court justice Cathy Silak. In October 1999, Silak wrote the majority opinion in a 3–2 decision that held that the federal government owned all unappropriated water in state wilderness areas (Fadness Reference Fadness1999).Footnote 12 Silak was up for reelection the following May. Over the next 7 months, the Idaho Falls Post Register published 33 articles and opinions discussing Silak. In two-thirds of the articles, the newspaper mentioned Silak’s role in the unpopular case, including an editorial by Silak herself justifying her opinion (Silak Reference Silak2000). During this time, the state’s Republican Party organized behind a challenger, Daniel Eismann, who made Silak’s vote in the water case the cornerstone to his opposition effort (Fadness Reference Fadness2000). Voters may not have been initially aware of Silak’s role in the water case, but the media’s repeated references to it helped to reinforce the signal that she did not support local ownership of natural resources.Footnote 13
Similarly, local media can help to reinforce messages issued by the campaigns. For example, West Virginia’s 2004 slugfest between Republican Brent Benjamin and Democratic incumbent Warren McGraw helps show how the media can identify and amplify extant campaign messages. Benjamin, McGraw, and their supporters flooded the airwaves with thousands of advertisements—the vast majority of which were negative attacks—and the two combined to raise over $200,000.Footnote 14 In the week preceding the election, the Charleston Daily Mail published 33 stories about the two candidates (4.7 per day). Of these, 73% referenced the expense, salience, or tone of the campaigns and their advertisements. Voters might not have personally witnessed these churlish messages, but owing to their extensive coverage, the likelihood that voters did not at least hear about them is negligible. Arguably, when the media repeat salient campaign messages, they provide candidates with in-kind contributions vis-à-vis free advertising.Footnote 15
Finally, while the media can educate voters about which candidates are best qualified or best suited to pursue their policy preferences, they can also help to generate voter interest in an election. This can be accomplished, for example, by announcing to the public when an election will take place. But perhaps more importantly, the media can help voters to decide whether a contest is competitive enough to merit their participation (i.e., Downs Reference Downs1957). This is often achieved via horse-race coverage. Horse-race coverage simply focuses on which candidate is perceived to be ahead of another at any given point in time.Footnote 16 Voters have a strong preference for horse-race coverage, which influences campaigns, fundraising, and voters’ preferences over candidates (Ansolabehere and Iyengar Reference Ansolabehere and Iyengar1994; Mutz Reference Mutz1995, Reference Mutz1997; Iyengar, Norpoth, and Hahn Reference Iyengar, Norpoth and Hahn2004).
This section’s analysis of media coverage of judicial campaigns helps to inform my expectations for the empirical analysis below. Local media coverage of judicial campaigns highlights candidates, their qualifications, and their policy preferences. It also helps to set the tone and agenda for these contests by illuminating or reinforcing salient information to the electorate. Finally, the media can give voters a sense of how competitive an election will be by identifying viable opposition efforts. For all these reasons, I anticipate that greater rates of media coverage will lead to more voter participation, ceteris paribus.
IV. Data and Methodology
I study voter participation in 317 judicial elections in 34 state courts of last resort from 2002 to 2014. These are contests in which the electorate chooses among candidates for the bench, including partisan, nonpartisan, hybrid, and retention elections.Footnote 17 In this section, I identify the variables used in the analyses, measurement strategies, data sources, and statistical methodology.
A. Voter Participation
The dependent variable is voter participation. As is common practice, I measure participation as the amount of rolloff in a given state supreme court race. Rolloff is the share of individuals who paid the costs to participate in an election but who failed to vote on a given ballot item. From 2002 to 2014, the average state supreme court race had a rolloff rate of approximately 18.8%. Rolloff is highly contextual across judicial institutions. Partisan elections have the lowest rolloff rates (7.4%, on average).Footnote 18 Contests without a party label exhibit much higher rates of rolloff. Across the same 13 years, nonpartisan elections averaged a rolloff rate of 18.7%; retention elections averaged 21.5%; and hybrid elections averaged 22.7%.Footnote 19 I gathered ballot data from state secretaries of state websites where available.Footnote 20
B. Media Coverage of Judicial Elections
The primary independent variable of interest is a measure of state supreme court campaign coverage by local media. In this section, I review previous measurement strategies and evaluate their suitability to this study. I then outline and evaluate new data relating to state supreme court campaign coverage.
1. Previous Measures of State Court Media Coverage
Previous scholarly research measures state supreme court salience largely with respect to coverage in local newspapers (Hale Reference Hale2006; Schaffner and Diascro Reference Schaffner, Segal Diascro and Streb2007; Yanus Reference Yanus2009; Vining and Wilhelm Reference Vining and Wilhelm2010, Reference Vining2011). For example, Vining and Wilhelm (Reference Vining2011) examine state supreme court case salience by recording whether a court decision appeared on the front page of a state’s most circulated newspaper the day after that decision was issued. Schaffner and Diascro (Reference Schaffner, Segal Diascro and Streb2007), meanwhile, examine the number of state-capital newspaper articles that cover candidates in 51 partisan and nonpartisan state supreme court elections, regardless of where they appeared in a newspaper. These previous efforts have some merits, but neither is perfectly suited for the analysis at hand.
To begin, Vining and Wilhelm’s (Reference Vining2011) case-centric approach would be inappropriate because it can only measure voter familiarity with incumbent judicial behavior and can give no impression about what voters might know about challengers or candidates to an open seat. Furthermore, their strategy of measuring front-page coverage presents its own challenges. Schaffner and Diascro (Reference Schaffner, Segal Diascro and Streb2007) show that only about 14% of courts coverage appears on the front page of a local newspaper. Their measurement strategy, then, is likely a better model for the present analysis than is Vining and Wilhelm’s (Reference Vining2011) insofar as candidates, not cases, are the unit of analysis.
An additional problem arises, though, when we decide which newspapers to study. Vining and Wilhelm (Reference Vining2011) analyze the most circulated newspapers in each state, but this means that the types of publications under analysis can differ widely from state to state. In California, the most circulated newspaper is the Los Angeles Times, but in North Dakota it is the Fargo Forum. How focused will a large paper such as the Times be on local issues compared to the Forum? How much of the North Dakota agenda can the Forum set compared to the Times? Schaffner and Diascro (Reference Schaffner, Segal Diascro and Streb2007) show that nationally circulated newspapers disfavor local courts reporting compared to local ones. But Vining et al. (Reference Vining, Wilhelm, Hiers and Marcin2010) show that smaller newspapers do not report as frequently on state courts compared to more highly circulated newspapers.
While newspaper studies dominate analyses in this field, additional problems may stem from recent declines in print media. In 2016, the Pew Research Center reported that between 2004 and 2014, 126 daily newspapers went out of business.Footnote 21 Over a 20-year period, the entire workforce supporting print newspapers declined by 39%. A receding industry has made it harder for smaller newspapers to survive, leading national conglomerates to assume control of smaller newspapers. This is especially problematic for civic knowledge because nationally owned papers tend not to cover local issues as much as locally owned ones (Schaffner and Diascro Reference Schaffner, Segal Diascro and Streb2007).
Even with these declines in print media, however, contestation and competitiveness in judicial elections have remained relatively steady over the years, even increasing in some areas (Kritzer Reference Kritzer2015). The same Pew report in 2016 noted that newspaper websites’ traffic increased in recent years and that “incidental” readership (clicks from social media, e.g.) was common among the adult population. Indeed, many voters receive their information today from electronic media on the internet such as news sites, blogs, or social media. Pew reports that only 51% of Americans consume their news solely in print. Consequently, measuring voter knowledge of state supreme court candidates is difficult in an environment in which information is seemingly ubiquitous and the media in which it appears are rapidly evolving.
2. New Data on State Supreme Court Campaign Coverage
To address some of the difficulties discussed above, I gather media coverage data from the Associated Press’s (AP) State and Local Wire.Footnote 22 While the AP is an international news organization, its State and Local Wire consists of 143 local bureaus located in each of the 50 American states. Stories from these bureaus come from staff writers located within them and are supplemented with coverage from affiliated newspapers and broadcasters within those regions.Footnote 23 Because the State and Local Wire pools resources from its own bureau staff with other affiliated reporters, it not only helps to account for how voters become informed across different types of media—print versus electronic, for example—but also for the various editorial agendas present within a state. Furthermore, because its stories are reported in the newswire format, it avoids the need to determine whether stories should come from the front page or elsewhere.
I measure local media coverage of state supreme court campaigns as the number of stories the State and Local Wire publishes about the candidates in a given contest. To obtain the data, I searched the State and Local Wire using LexisNexis. I conducted this search by using every candidate’s name in a given race and the state in which they were running. I accounted for the possibility that articles might mention multiple candidates for the same race in a single story, so every story is counted only once.
I coded the number of stories published about each contest in the 3, 6, and 12 months leading up to an election date. I then content-analyzed the results of these searches to remove any duplicate or irrelevant stories. The result of this data-collection process is three event count variables of the number of stories published about a given state supreme court contest. These new data improve on previous efforts in that they derive from a single source, cover multiple time periods within a year of an election, capture salience in every type of judicial election in the United States, and are not restricted solely to print media.Footnote 24
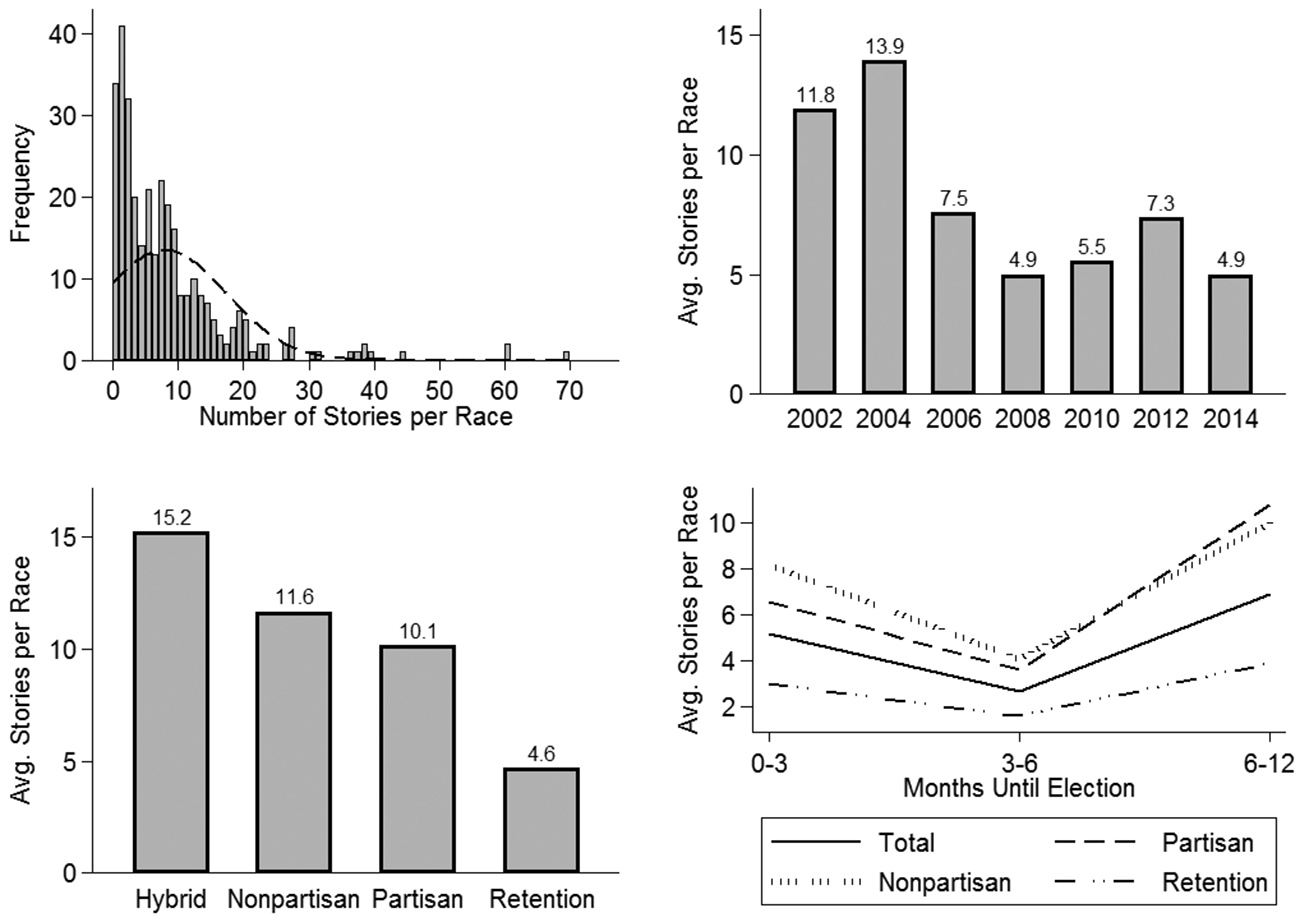
I graphically summarize some of these new coverage data in figure 1. The top-left panel shows the frequency of coverage in the 6 months leading up to a state supreme court election. The average race had 7.9 stories mentioning candidates, but this distribution is largely right-skewed. Only 34 campaigns received no coverage whatsoever (10.6%), and 29 of these were retention elections. Over three-fifths of all judicial elections (64.4%) had between one and ten stories written about the candidates in the 6 months before an election; about a quarter (24.7%) had between 11 and 20 stories; and only 6.9% had more than 20. Some of the most widely covered elections were in Alabama, Florida, and West Virginia.Footnote 25
Local media coverage of state supreme court campaigns within 6 months of an election (2002–14). Top-left panel, number of AP stories. Top-right panel, number of stories published by year. Bottom-left panel, number of stories published by institutional design. Bottom-right panel, number of stories published within a given window of time, by institutional design.
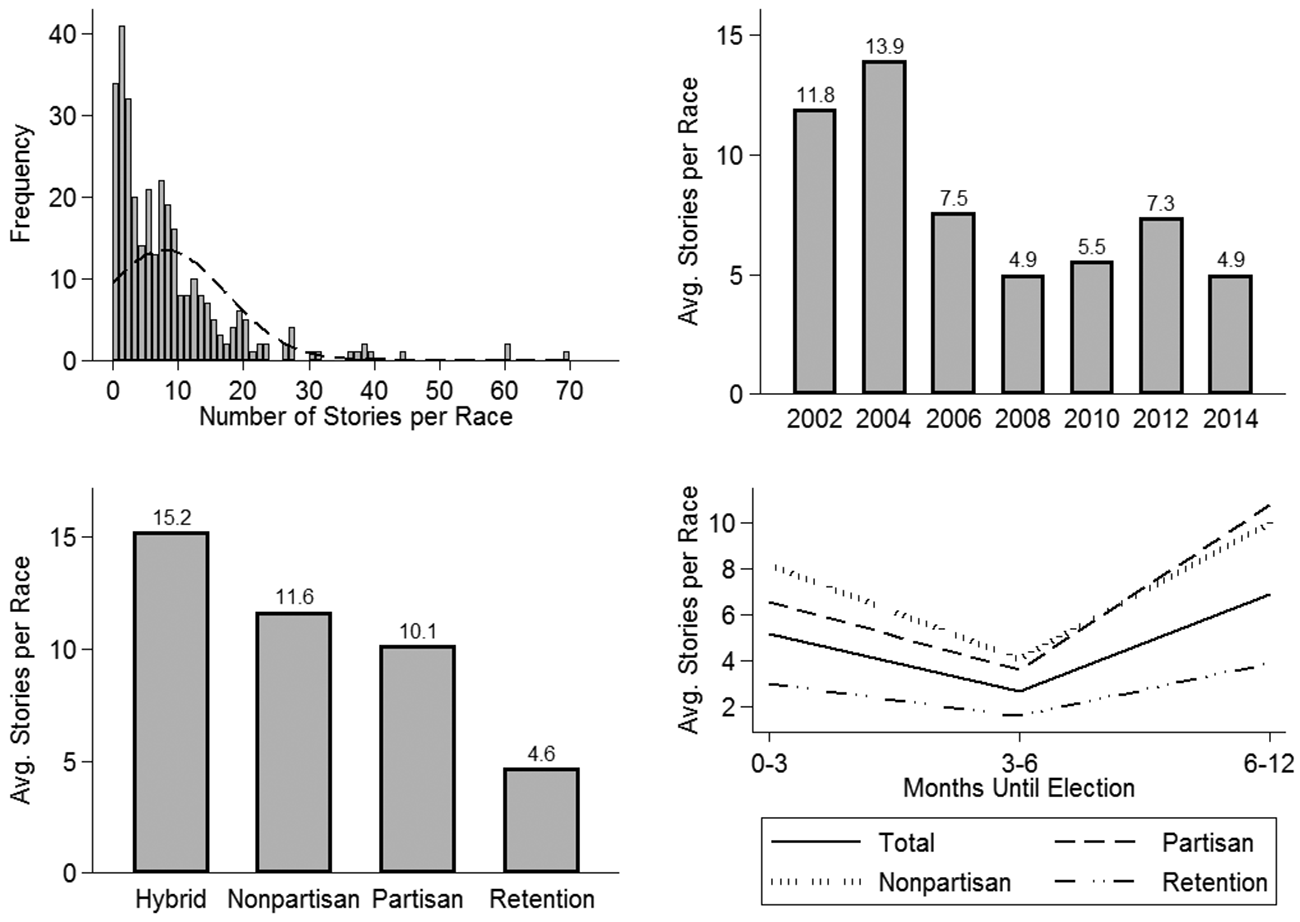
Figure 1 also shows some clear trends in the rates of media coverage over the years of the analysis. The top-right panel displays the average number of stories published in the 6 months before each race. Note that coverage of state supreme court elections declined after 2004. From 2002 to 2004, the average race had 12.8 stories covering its candidates, but between 2006 and 2014, that figure fell by over half to 6.1 (
 ). These declines likely reflect a constricting news industry during this period.Footnote
26
The bottom-left panel in figure 1 shows how media coverage differs across judicial institutions. The results show that, on average, hybrid elections receive the greatest rates of coverage compared to other types of judicial elections—15.2 stories on average to 7.5, respectively (
 )—although this finding is skewed by the salient races in Ohio along with the poor rates of coverage among retention elections (e.g., Baum and Klein Reference Baum, Klein and Streb2007).Footnote
27
The results also suggest that nonpartisan elections receive slightly, although not significantly, more coverage than partisan ones—11.6 stories compared to 10.1, respectively (
 ). Finally, retention elections receive systematically less frequent coverage compared to competitive elections—4.6 stories in the 6 months leading up to an election compared to 11.6, respectively (
 )—unsurprising given how inconspicuous these races often are.
Finally, the bottom-right panel in figure 1 depicts some temporal trends in how judicial campaigns are covered throughout the 12 months leading up to an election. First, observe that the media takes an increasing interest in candidates during the homestretch of an election, regardless of institutional design. On average, the last 3 months of a campaign have approximately 93% more media coverage than during the period 3 to 6 months before an election date (
 ). This is intuitive given that many states are still engaged in judicial qualifications and nominations during the period 3 to 6 months outside of a general election, and many candidacies will not reach their zenith until the last few months of the campaign. Nevertheless, I find minimal evidence that the final 6 months of a campaign are better covered than the 6 months preceding them—7.9 stories on average, compared to 6.9, respectively (
 ).
3. The Content of State Supreme Court Campaign Coverage
What kinds of stories are local media most likely to cover in state supreme court campaigns? Previous research finds that the media—of any type—are drawn to controversy in their coverage of the courts (Vining and Marcin Reference Vining and Marcin2014). For example, newspaper coverage of state supreme courts is often drawn to cases involving civil liberties or declarations of unconstitutionality or to those with minimum winning coalitions (Vining and Wilhelm Reference Vining and Wilhelm2010). Even among death penalty cases, media are apt to lend greater coverage to cases with sensational facts than to those with broader legal implications (Vining, Wilhelm, and Collens Reference Vining, Wilhelm and Collens2015).
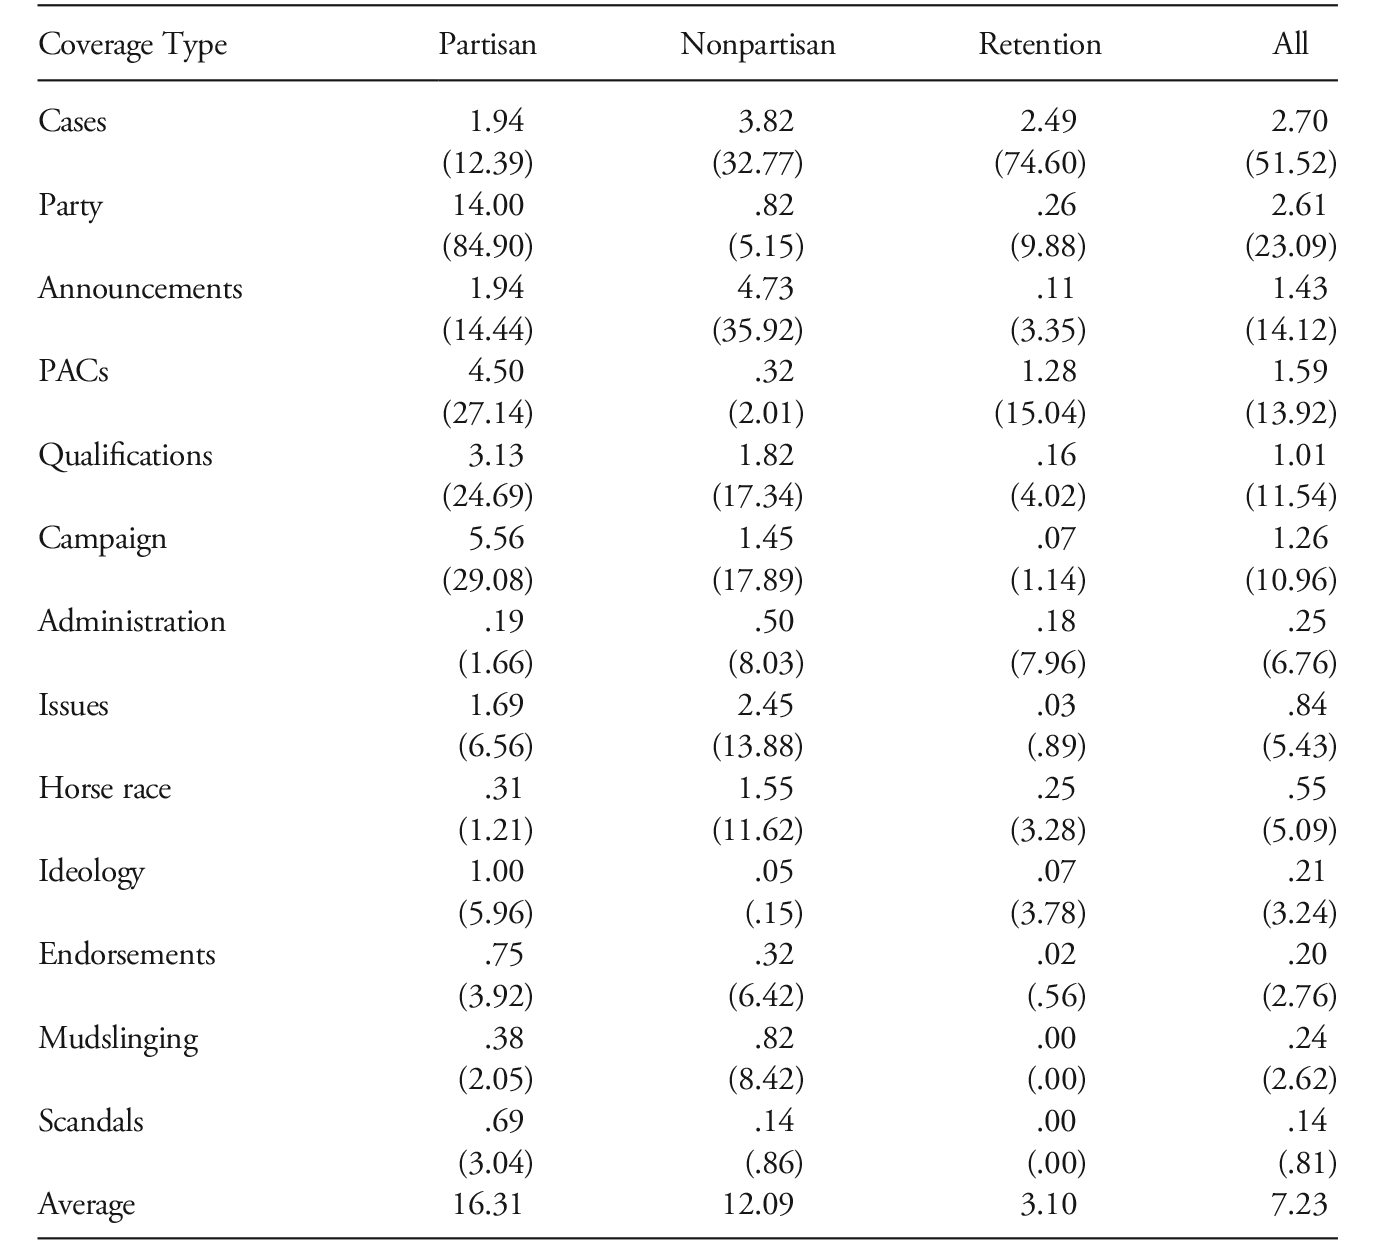
To further examine how local media cover state supreme court elections, I took a stratified sample of 10 state courts of last resort and content analyzed every article published within 6 months of an election. My sample includes two partisan election states, three nonpartisan election states, and five retention election states.Footnote 28 My sample includes 99 state supreme court contests, 144 candidates, 716 news articles, and 13 content areas.Footnote 29 To perform the analysis, I read each article and coded whether a particular attribute appeared in a given story (1 if yes, 0 otherwise), and then I added up the total number of content types during the 6 months preceding an election. I present results from the content analysis in table 1.
Content of State Supreme Court Election Media Coverage
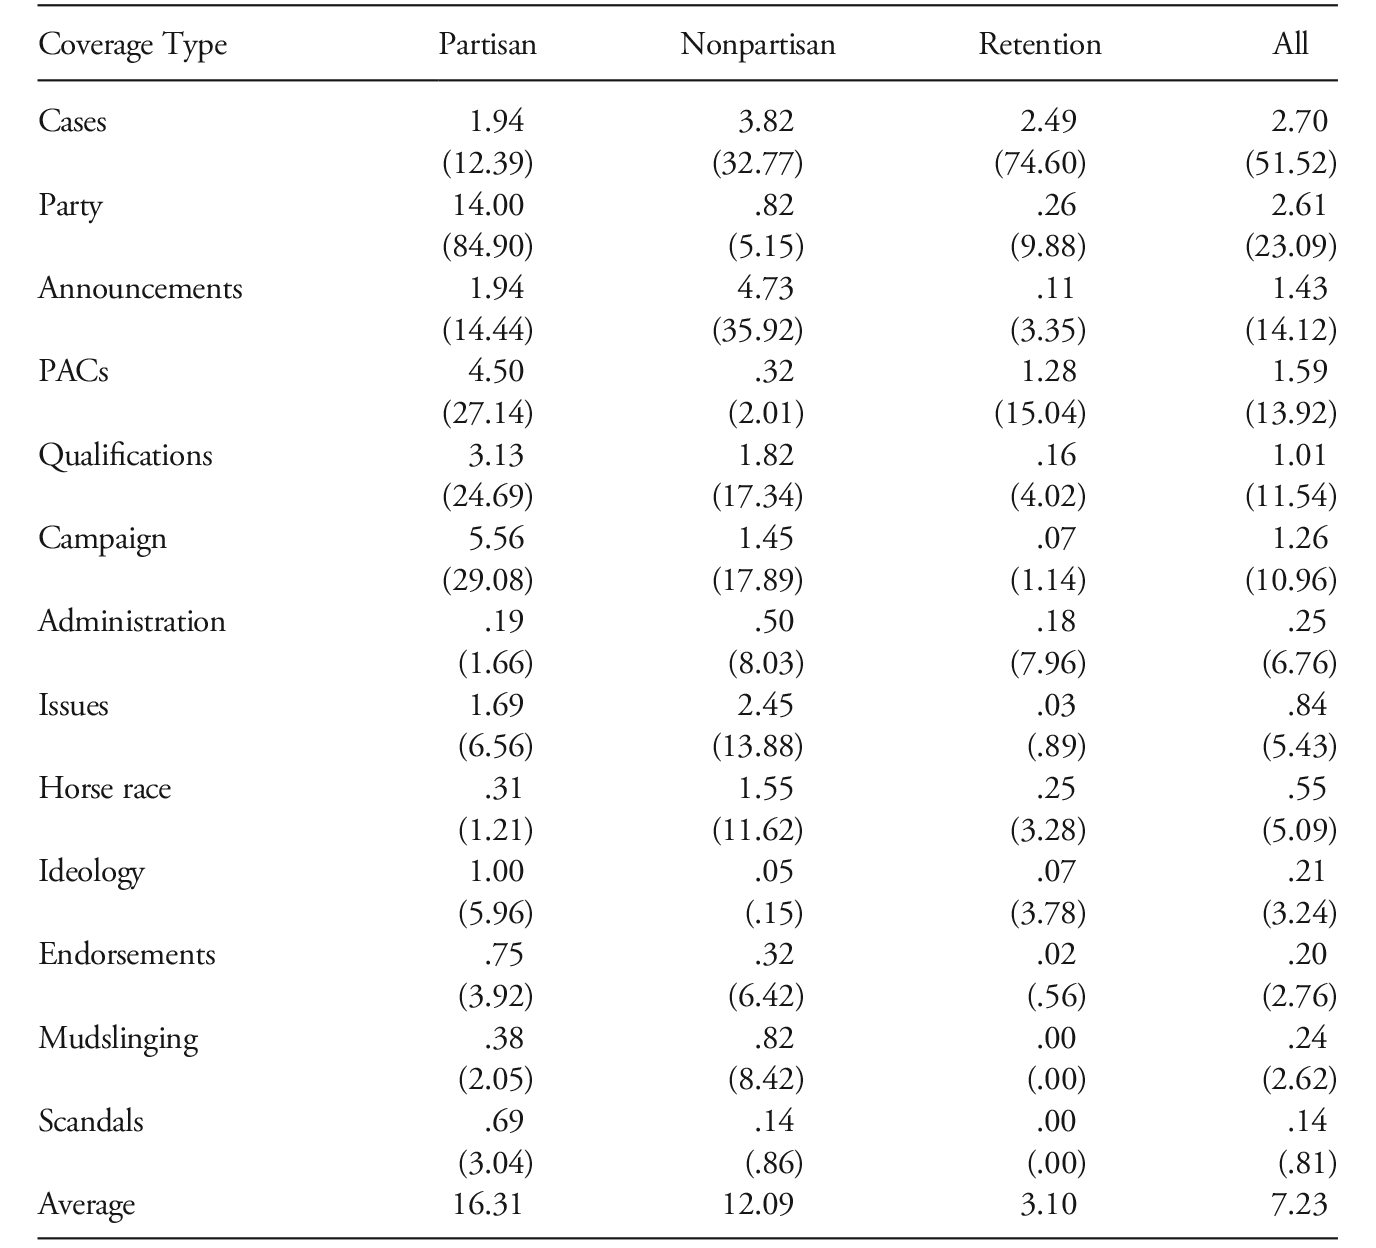
Note.— Average number of stories in which a content area appeared in the 6 months before an election. Values in parentheses are the average percentage of all race stories that contain one of the content areas.
Entries in table 1 show the average number of stories per race in which a specific content area appeared in the 6 months before an election. Values in parentheses represent the average percentage per race of stories that contain references to specific content areas.Footnote
30
The most common type of news coverage relates to candidates’ behavior in court cases. In the average contest, over one-third of local news articles referenced a candidate’s behavior. Nevertheless, there are stark institutional differences in this type of coverage. Such content appears in approximately three-fourths of articles covering retention elections but only about one-fourth of articles covering competitive elections (
 ).
States that use competitive—particularly partisan—judicial elections see greater types of coverage related to their expense or tone. For example, 29.1% of stories in partisan races and 17.9% in nonpartisan races mention the campaign activity of the candidates for judicial office.Footnote
31
These figures significantly outweigh those for retention elections (
 and
 , respectively). Similarly, 27.1% of stories covering partisan races mention the involvement of special interests or political actions committees (PACs), compared to only about 10.8% of nonpartisan or retention elections (
 ).
Local media also help to convey candidates’ policy positions by discussing their partisan orientations, their stances on specific issues, their ideological predispositions, or the endorsements of other individuals. Among partisan contests, local media make nearly unanimous reference to the party identification of the candidates (84.9% of all stories), which, by no surprise, dwarfs that for other types of judicial elections (
 ). Other types of cues get somewhat less coverage. Only about 5.4% of news stories mention candidates’ positions on specific issues; 3.2% mention their ideology; and 2.8% mention endorsements. The media are slightly more likely to mention nonpartisan candidates’ positions on issues (
 ) and their endorsements (
 ) compared to other types of courts.
Local media can also help to build popular interest around judicial campaigns by drawing greater attention to them. Horse-race coverage, for example, makes up about 5.1% of local coverage of judicial elections. The bulk of this goes to nonpartisan elections, where 11.6% of all stories mention the horse race—significantly more than other types of elections (
 ). Relatively few stories cover some of the more sensational types of campaign activity such as mudslinging or scandals. Only 2.6% of stories covering judicial elections were devoted to mudslinging, and less than 1% discussed a scandal. Neither attribute appeared in any of the retention elections under analysis, and the bulk of all scandal coverage is attributable to the highly salient judicial elections in Alabama.
Local media also provide voters with other types of useful, if not sensational, information in the months leading up to an election. In about 14.1% of news stories do the media make announcements that remind voters of an upcoming election.Footnote
32
In only about 11.5% of all stories are candidates’ qualifications discussed, but this figure is due to poor rates of coverage among retention contests. In 24.7% of partisan contests, and in 17.3% of nonpartisan contests, are the candidates’ qualifications discussed. In only 4% of all retention elections is an incumbent’s qualifications mentioned—significantly less than in contested races (
 ). News outlets also remind their subscribers about the types of administrative duties courts perform.Footnote
33
In only about 6.8% of stories do the media discuss courts’ administrative responsibilities.
4. A Robustness Check on the Validity of the AP Data
Does the AP’s coverage of state supreme court campaigns accurately reflect the types of information to which voters are likely to have access? It is not to be expected that voters learn about local news by literally reading articles coming across the State and Local Wire. Rather, one would expect that individuals in AP bureaus respond to the same types of stimuli as do those who work for local newspapers, for example. In this section, I present a robustness check on the validity of this assumption by comparing results from the AP to a sample of stories in local newspapers.
On their face, the new media coverage data appear to tap into concepts of salience. Some of the most highly covered races in the data set include the 2004 West Virginia race between Brent Benjamin and Warren McGraw, the 2012 Alabama race between Roy Moore and Bob Vance, and the 2002 Ohio race between Tim Black and Maureen O’Connor. Some of the least covered states are those without any challengers (i.e., retention elections). As a more rigorous check on robustness, I took a stratified sample of five state supreme courts—one partisan, two nonpartisan, and two merit selection states—and replicate the three aggregate variables from the AP using the most circulated newspapers in those states.Footnote 34 In all, these total 50 state supreme court elections.
In table 2, I present Pearson’s correlation coefficients between the AP measures of campaign salience and those taken from the five additional printed newspapers. I divide the results across three periods—the last 3 months of the race, the intermediate 3 to 6 months before the race, and the beginning 6 to 12 months before the race. Correlation coefficients show how well the two sources of information covary. As can be seen from the results in table 2, all three periods have high Pearson correlation coefficients between the AP and print newspaper measures, and all three easily reject the null hypothesis that there is no covariance between the two. These results suggest that the AP’s coverage of state supreme court elections is a reasonable proxy for more traditional forms of media.
Comparison of AP Stories and Five Printed Newspapers

Note.—
 . Correlation coefficients relate to how well Associated Press coverage and local newspaper coverage covary.
C. Control Variables Relating to Voter Information
The scholarly literature identifies other important sources of information for voters in state supreme court elections. First, institutional methods of electing judges can further voter knowledge. Partisan elections are almost certainly the most informative given the partisan heuristic. Nonpartisan, hybrid, and retention elections offer voters systematically less information given the absence of a party label. I include dichotomous indicators for each type of institution, where partisan elections are the excluded category in the regressions below.
Other electoral features such as campaign salience also affect voter participation. To begin, I collect the total amount of campaign money raised by every candidate in a state supreme court contest. These data are taken from the National Institute for Money in State Politics.Footnote 35 To account for the relative spending power of a dollar in a given locale, I divide these funds by state population.Footnote 36 I adjust these figures into millions of (2016) dollars.Footnote 37 As is common practice, I then log the total amount of fundraising in each campaign.
Next, I control for television advertising in state supreme court contests. Television advertising can be an effective way of grabbing voters’ attention and alerting them to which candidate best reflects their policy positions. I gather advertising data from the Brennan Center for Justice’s biennial series on state supreme court elections, Buying Time.Footnote 38 The reports provide the number of advertisements aired in a state supreme court race in addition to their tone (attack, promote, or contrast).Footnote 39 I gather these data by tone and log these figures.
Another factor affecting voter rolloff in state supreme court elections is timing. Generally, midterm and primary elections attract a different group of voters than do presidential and general elections. Primary elections are those that occur during a general or midterm cycle but before the general election itself.Footnote 40 Because presidential and general elections attract larger groups of voters who are mostly engaged by top-ticket contests, I expect that midterm and primary elections should exhibit lower rates of rolloff since participants are more highly motivated. I include dichotomous variables for these midterm and primary elections.Footnote 41
Other institutional factors can affect participation in judicial elections. Hall (Reference Hall2015) shows how a court’s professionalism, as measured by Squire (Reference Squire2008), is negatively associated with voter participation.Footnote 42 Professionalism is associated with lower rates of voter participation because more professional incumbents have the ability to shield themselves from quality challengers by strategically allocating their dockets and avoiding controversy (Brace and Hall Reference Brace and Gann Hall2001). I therefore include Squire’s (Reference Squire2008) measure of judicial professionalism in the statistical regressions below.
Candidate characteristics might also affect voter participation. For example, elections with incumbents are likely to exhibit lower levels of participation because challengers will be less likely to enter the race or mount a competitive campaign. Therefore, I include a dichotomous indicator for whether a given race is open. I expect that open elections should exhibit greater competition and, as a result, lower rates of rolloff. Relatedly, incumbents who were appointed to complete the term of a departing justice may not be expected to enjoy all the benefits of the incumbency advantage. Therefore, I also include a dichotomous indicator for whether a contest featured an interim-appointed incumbent.Footnote 43 I also control for whether candidates run within discrete geographic districts or at large.Footnote 44
I also control for candidates’ demographics. When information is scarce, voters are more likely to cue off of other types of information in deciding how—or whether—to vote. For example, some voters may cue off of a name because they associate it with a particular race or gender (Dubois Reference Dubois1984; Frederick and Streb Reference Frederick and Streb2008). I include two dichotomous variables that reflect whether a given state supreme court contest featured at least one nonwhite candidate or at least one female candidate.
Finally, retention elections—while largely inconspicuous—have some additional features that might inform voters. Officially, these contests are all unopposed, but organized opposition efforts can cut into the incumbency advantage (Clopton and Peters Reference Clopton and Scott Peters2013; Hughes, Reference Hughesforthcoming). Therefore, I include a dichotomous variable that indicates whether an incumbent faced an organized opposition effort during her retention election.Footnote 45 Gill (Reference Gill, Bonneau and Gann Hall2017) finds that critical judicial performance evaluations (JPEs) can also affect retention outcomes. To account for the potential mobilizing effect of negative evaluations, I include a control variable for the lowest score an incumbent received on her JPE.Footnote 46 While each of the 31 justices for whom JPE data are available was recommended to be retained, there is some variance in the lowest evaluation scores they received.Footnote 47
D. Statistical Methodology
The dependent variable (rolloff) is measured as a percentage. A linear regression is therefore an appropriate estimator. Nevertheless, the data are hierarchically structured because the unit of analysis, a supreme court election, is nested within states. In cases such as these, error variance is likely to be correlated within panels. For example, voter rolloff in a race in Alabama is likely to be correlated with other elections in that state but less so with elections in, say, Montana. Multilevel modeling is an ideal method by which to address such concerns (Gelman and Hill Reference Gelman and Hill2007). Below, I estimate multilevel linear regressions with random slope intercepts and error variance grouped by state.Footnote 48 To account for temporal heterogeneity, I also include fixed effects for each year in the data.
V. Results
In this section, I present statistical regression results. I begin with the most parsimonious model, which shows the effect of media coverage on voter participation in state supreme court elections without the effects from campaign expense and advertising included. This may be termed the Baseline Model. Media coverage is slightly collinear with campaign expense and advertising, so it will be useful to the analysis if we separate these effects to begin. I then add these campaign-related factors to the statistical models and compare the results to the Baseline. Finally, I present robustness checks that consider whether the effect of media coverage on voter participation is due to endogeneity stemming from campaign expense and advertising.
A. Baseline Models
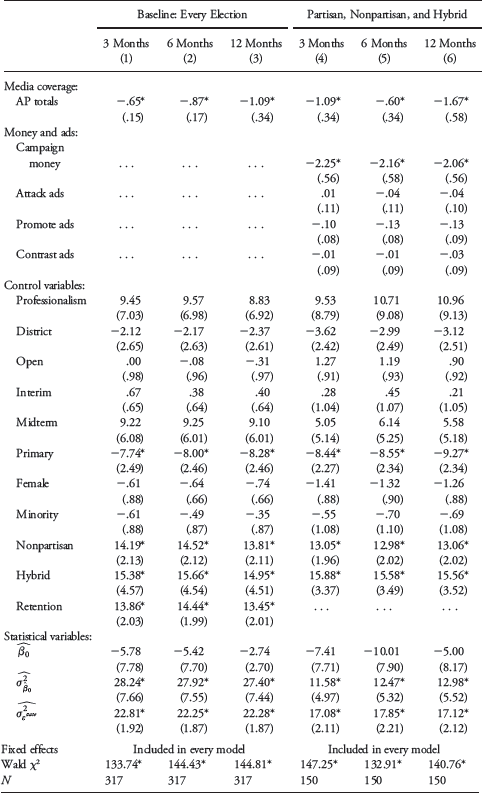
I present the results from the Baseline Model in columns 1–3 of table 3. Results are presented across three periods for the media coverage variables of interest. Note that the effect of media coverage on voter rolloff is negative and statistically significant in every model, as hypothesized. This means that as more stories circulate regarding the candidates in a supreme court contest, the more likely voters are to participate, all things being equal. In the 12 months before an election, I find that a change in media coverage from 1 standard deviation below to 1 standard deviation above the average race lowers rolloff from 21.2% to 17.3%, all things being equal—a 3.9-percentage-point decline (or an 18.1% change overall).Footnote 49 Finally, observe that longer periods of coverage are associated with greater rates of participation, suggesting that lengthier exposure to information helps voters to cast their votes compared to what they can learn in the short run.
Voter Rolloff and Media Coverage in State Supreme Court Elections (2002–14)
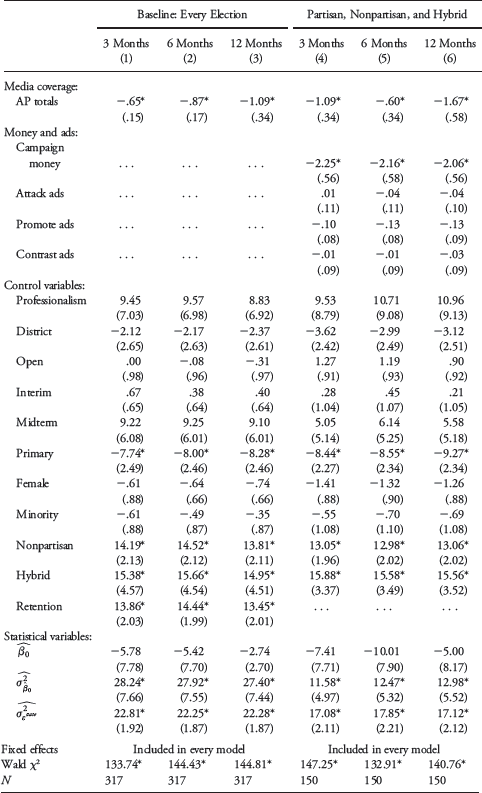
Note.— Multilevel linear regression coefficient estimates with errors grouped on each state court. Standard errors are in parentheses.
* p < .05, one-tailed.
B. Media and Campaign Effects on Voter Participation
While parsimonious, the Baseline Model assumes that campaign expense and tone are unrelated to participation. Previous scholarship finds that expensive, well-advertised, and even churlish campaigns stimulate the electorate. In this section, I examine the effect of the media on voter rolloff in competitive state supreme court elections. These include partisan, nonpartisan, and hybrid elections that feature at least one challenger. I control for campaign money along with the rate of television advertising in each race. My approach in this section makes the results most comparable to recent analyses of voter participation in state supreme court elections (e.g., Bonneau and Hall Reference Bonneau and Gann Hall2009; Hall Reference Hall2015). I present these results in columns 4–6 of table 3.
The media coverage variables remain negative and statistically significant, and their marginal effects are strictly greater than two of their counterparts in the Baseline Models. Even when controlling for campaign expense and advertising, I find that local media coverage has a significant effect on voter participation. In the 12 months preceding a state supreme court election, I find that a change from 1 standard deviation below to 1 standard deviation above the average rate of media coverage lowers predicted rolloff from 20.9% to 14.9%, all things being equal—a 6-percentage-point decline (or a 28.7% change overall).
Consistent with received wisdom, I also find that state supreme court campaigns affect voter participation. As candidates raise increasing sums of money, voters are more likely to participate in competitive judicial elections. A change from 1 standard deviation below to 1 standard deviation above the average expense of a judicial campaign results in a predicted decrease in voter rolloff from 22.2% to 16.1%, all things being equal—a 6.1-percentage-point decline (or a 27.5% change overall). Interestingly, then, the marginal standardized effect of campaign money on voter rolloff is nearly identical to that of local media coverage.
Unlike previous scholarship, however, I find no strong evidence that television advertising generates voter turnout in competitive elections. There are a few possible explanations for these null findings. First, television advertising is somewhat collinear with media coverage and campaign finance. When I omit media coverage from the model, promotional advertising is estimated to have a negative and statistically significant effect on voter rolloff (
 ). Second, Hall (Reference Hall2015) shows that television advertising, particularly attack advertising, most stimulates voting in elections without party labels. When I restrict the analysis to nonpartisan and hybrid elections, both attack advertising and promotional advertising attain statistical significance (
 and
 , respectively).
The differences between the television advertising results in table 3 and those in previous works could also be attributable to sample size. I examined 150 elections in partisan, nonpartisan, and hybrid contests, spanning the years 2002 to 2014. The data set used to estimate the campaign effects in table 3 is 123.9% larger than what is used in Hall and Bonneau (Reference Hall and Bonneau2013) and 57.9% larger than the data set presented in Hall (Reference Hall2015). It is possibly the case that the additional years’ worth of advertising data for this study led to the null findings. Indeed, when I restrict the analysis to between 2002 and 2008 (the period examined by Hall [Reference Hall2015]), I find similar results to these earlier studies. Finally, it could also be the case that media coverage is simply a better predictor of voter participation than television advertising, which could also account for the null finding for advertising.
C. Campaign Salience as a Predictor of Media Coverage
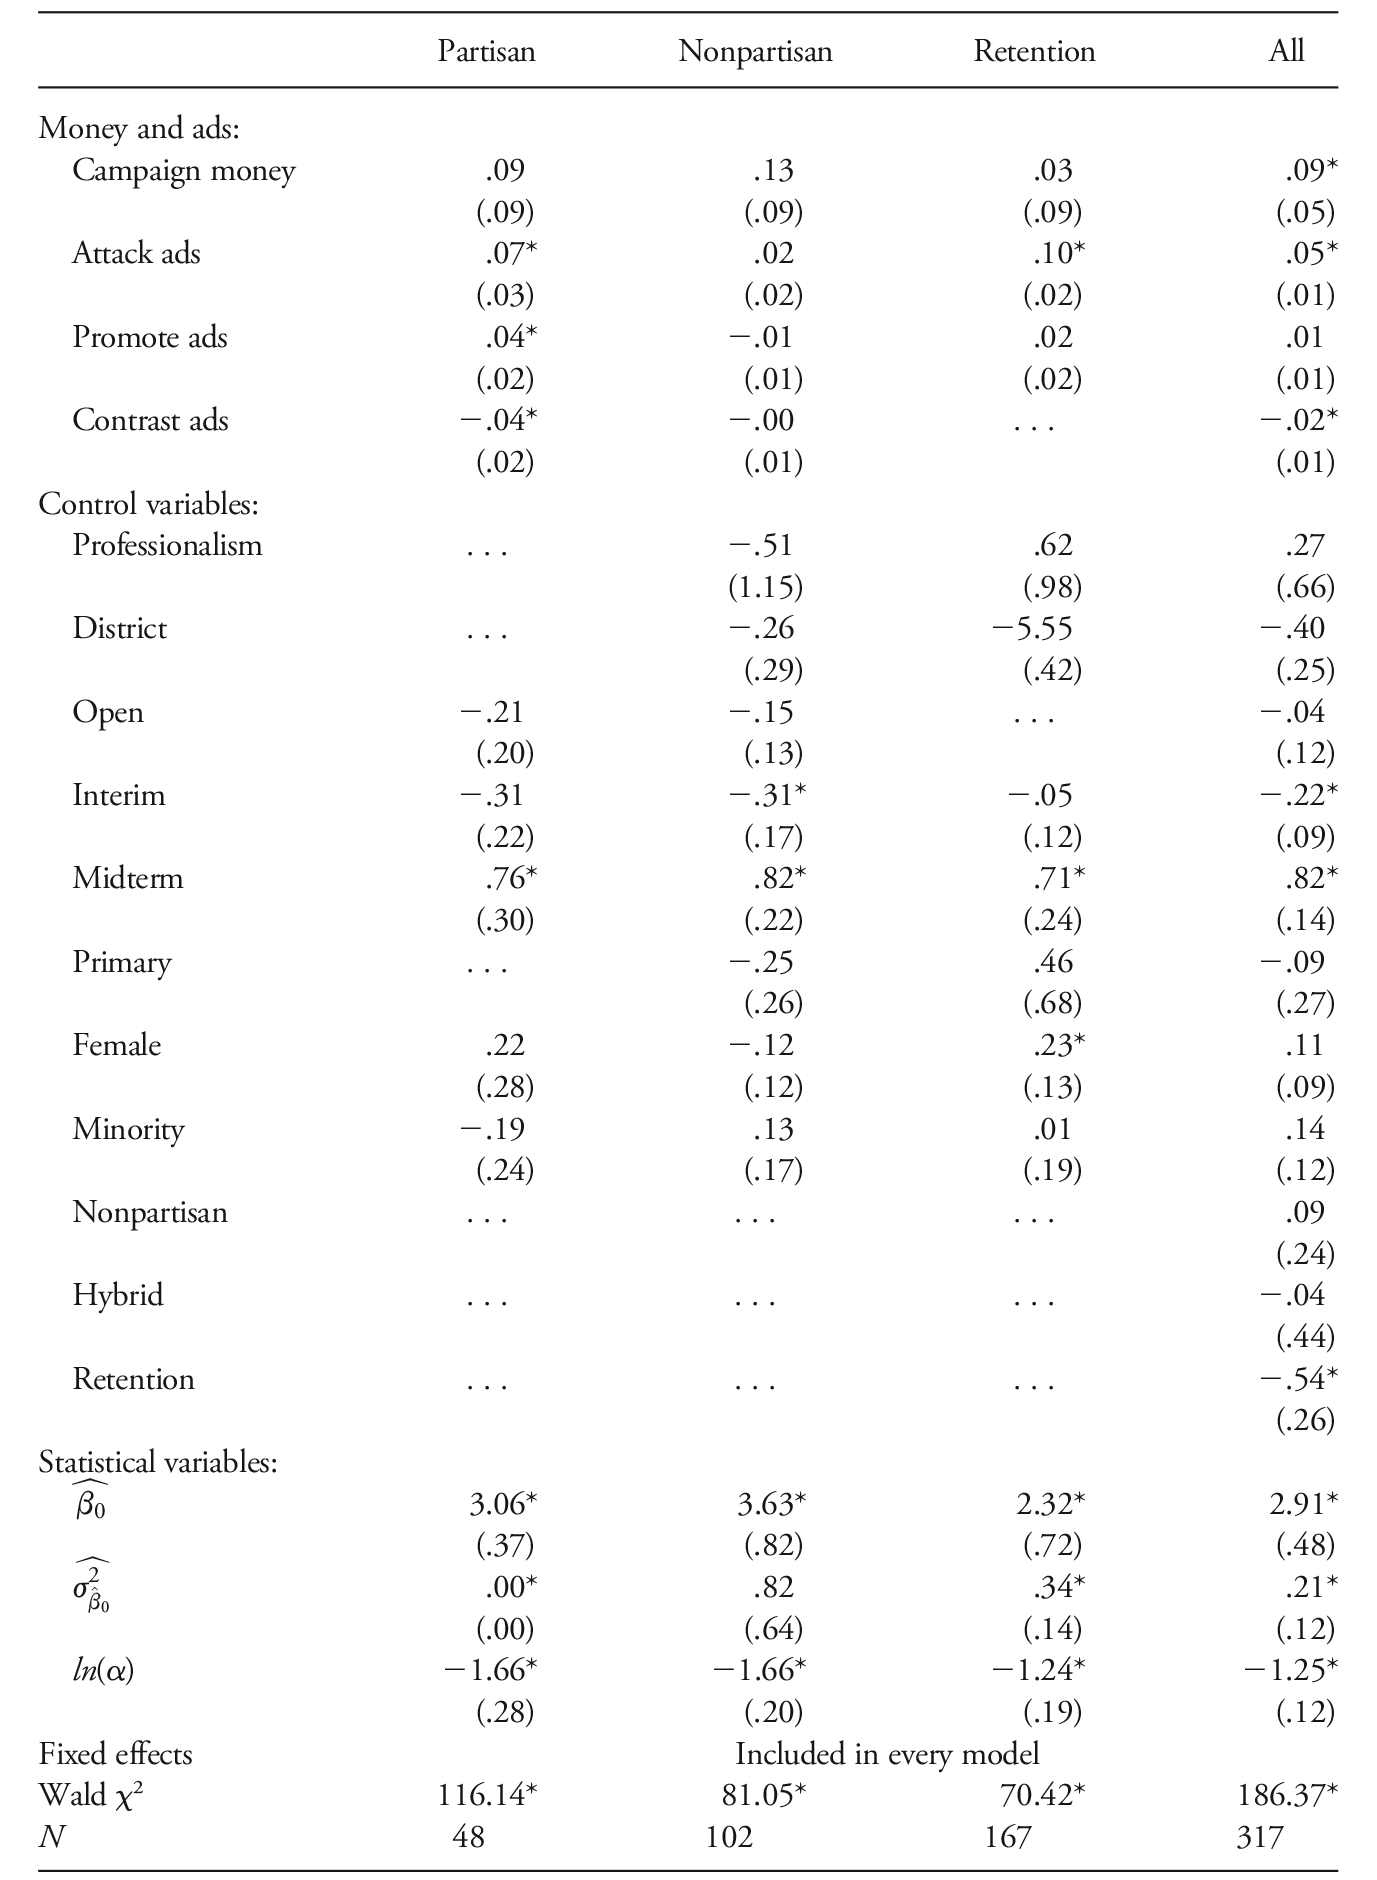
Does media coverage independently inform and mobilize voters, or does it simply mirror the types of information individuals are already likely to encounter in expensive, well-advertised elections? After all, previous research finds that local media are attracted to conflict in their coverage of state courts (e.g., Baum and Klein Reference Baum, Klein and Streb2007; Vining et al. Reference Vining, Wilhelm and Collens2015). And the content analysis presented in table 1 confirms that approximately 11% of all stories focus on the campaign activities of the candidates.Footnote 50 If the media provided voters with no new information than what was already on offer from the campaigns, then we run the risk of committing a Type I error.
In table 4, I present results from additional regression models in which the number of news articles covering the 12 months before a state supreme court race is the dependent variable.Footnote 51 The results suggest that a campaign’s expense likely plays at least some role in how the local media cover judicial races, although the effect is occasionally tenuous.Footnote 52 Only when every state supreme court election is pooled into a single model are we able to reject the null hypothesis that campaign financing does not garner news coverage.Footnote 53 One of the most consistent findings from those presented in table 4, however, is that local media are attracted to attack advertising. A change from 1 standard deviation below to 1 standard deviation above the average campaign’s number of attack advertisements results in an estimated 6.2 additional news stories, all things being equal (or a 54.2% increase overall). In some models, promotional advertisements are associated with increased media coverage, but contrast advertisements are actually predicted to depress coverage (particularly in partisan states).Footnote 54
Determinants of Local Media Coverage in State Supreme Court Elections
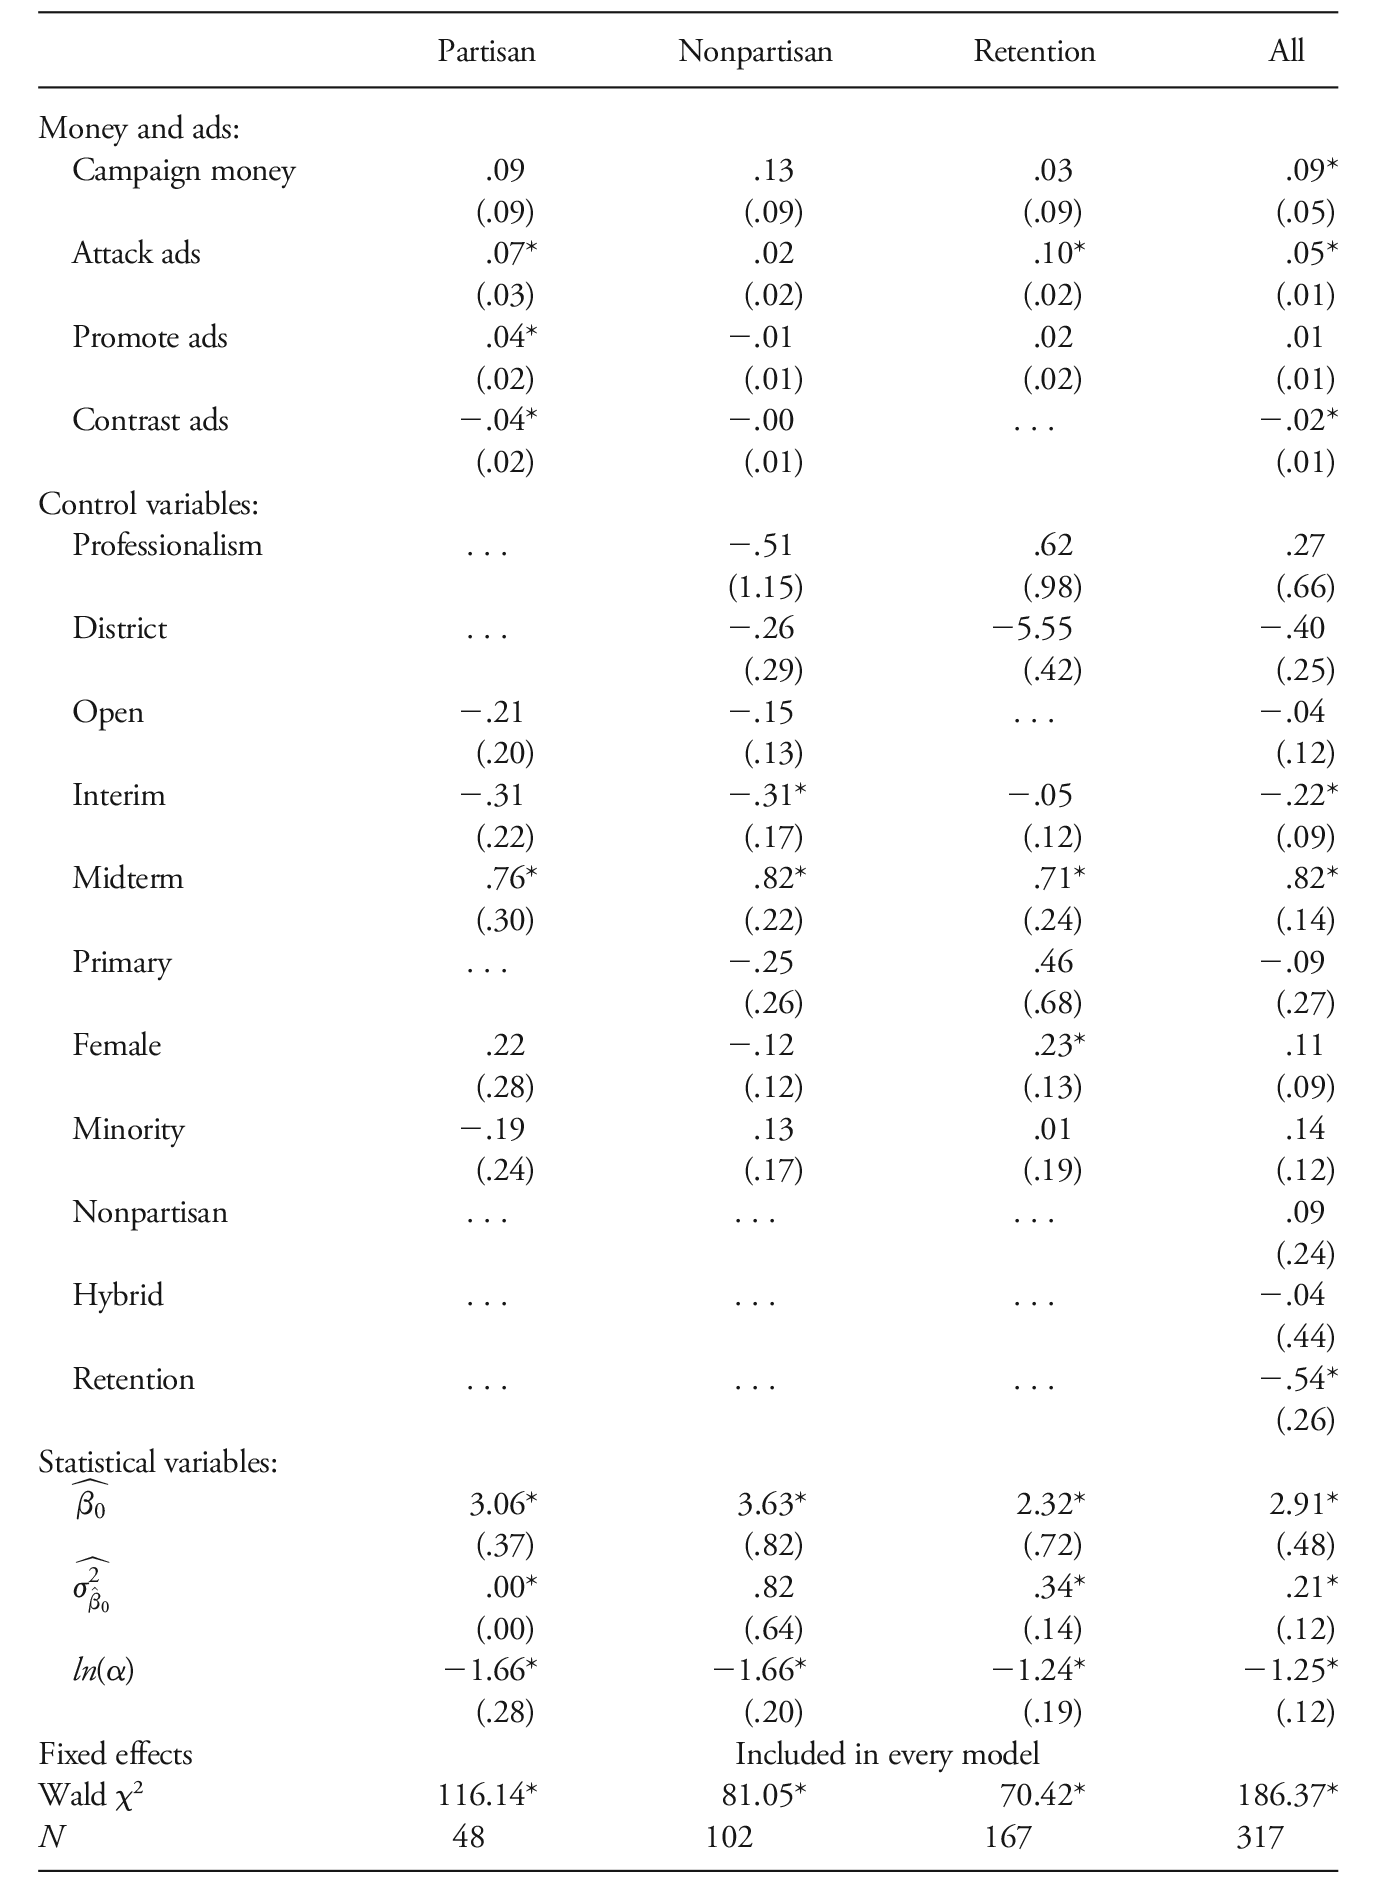
Note.— Multilevel negative binomial regression coefficient estimates with errors grouped on each state court. Standard errors are in parentheses. The “Nonpartisan” category in the third column includes hybrid elections.
* p < .05, one-tailed.
D. Media Coverage and Voter Rolloff in Merit Selection States
The previous section and the content analysis above help to show how local media cue at least some of their coverage off of campaign expense and advertising. If voters are responding to these more salient cues, then the effects attributed to media coverage above are possibly erroneous. To address this concern, I next examine media coverage and voter participation in merit selection states.
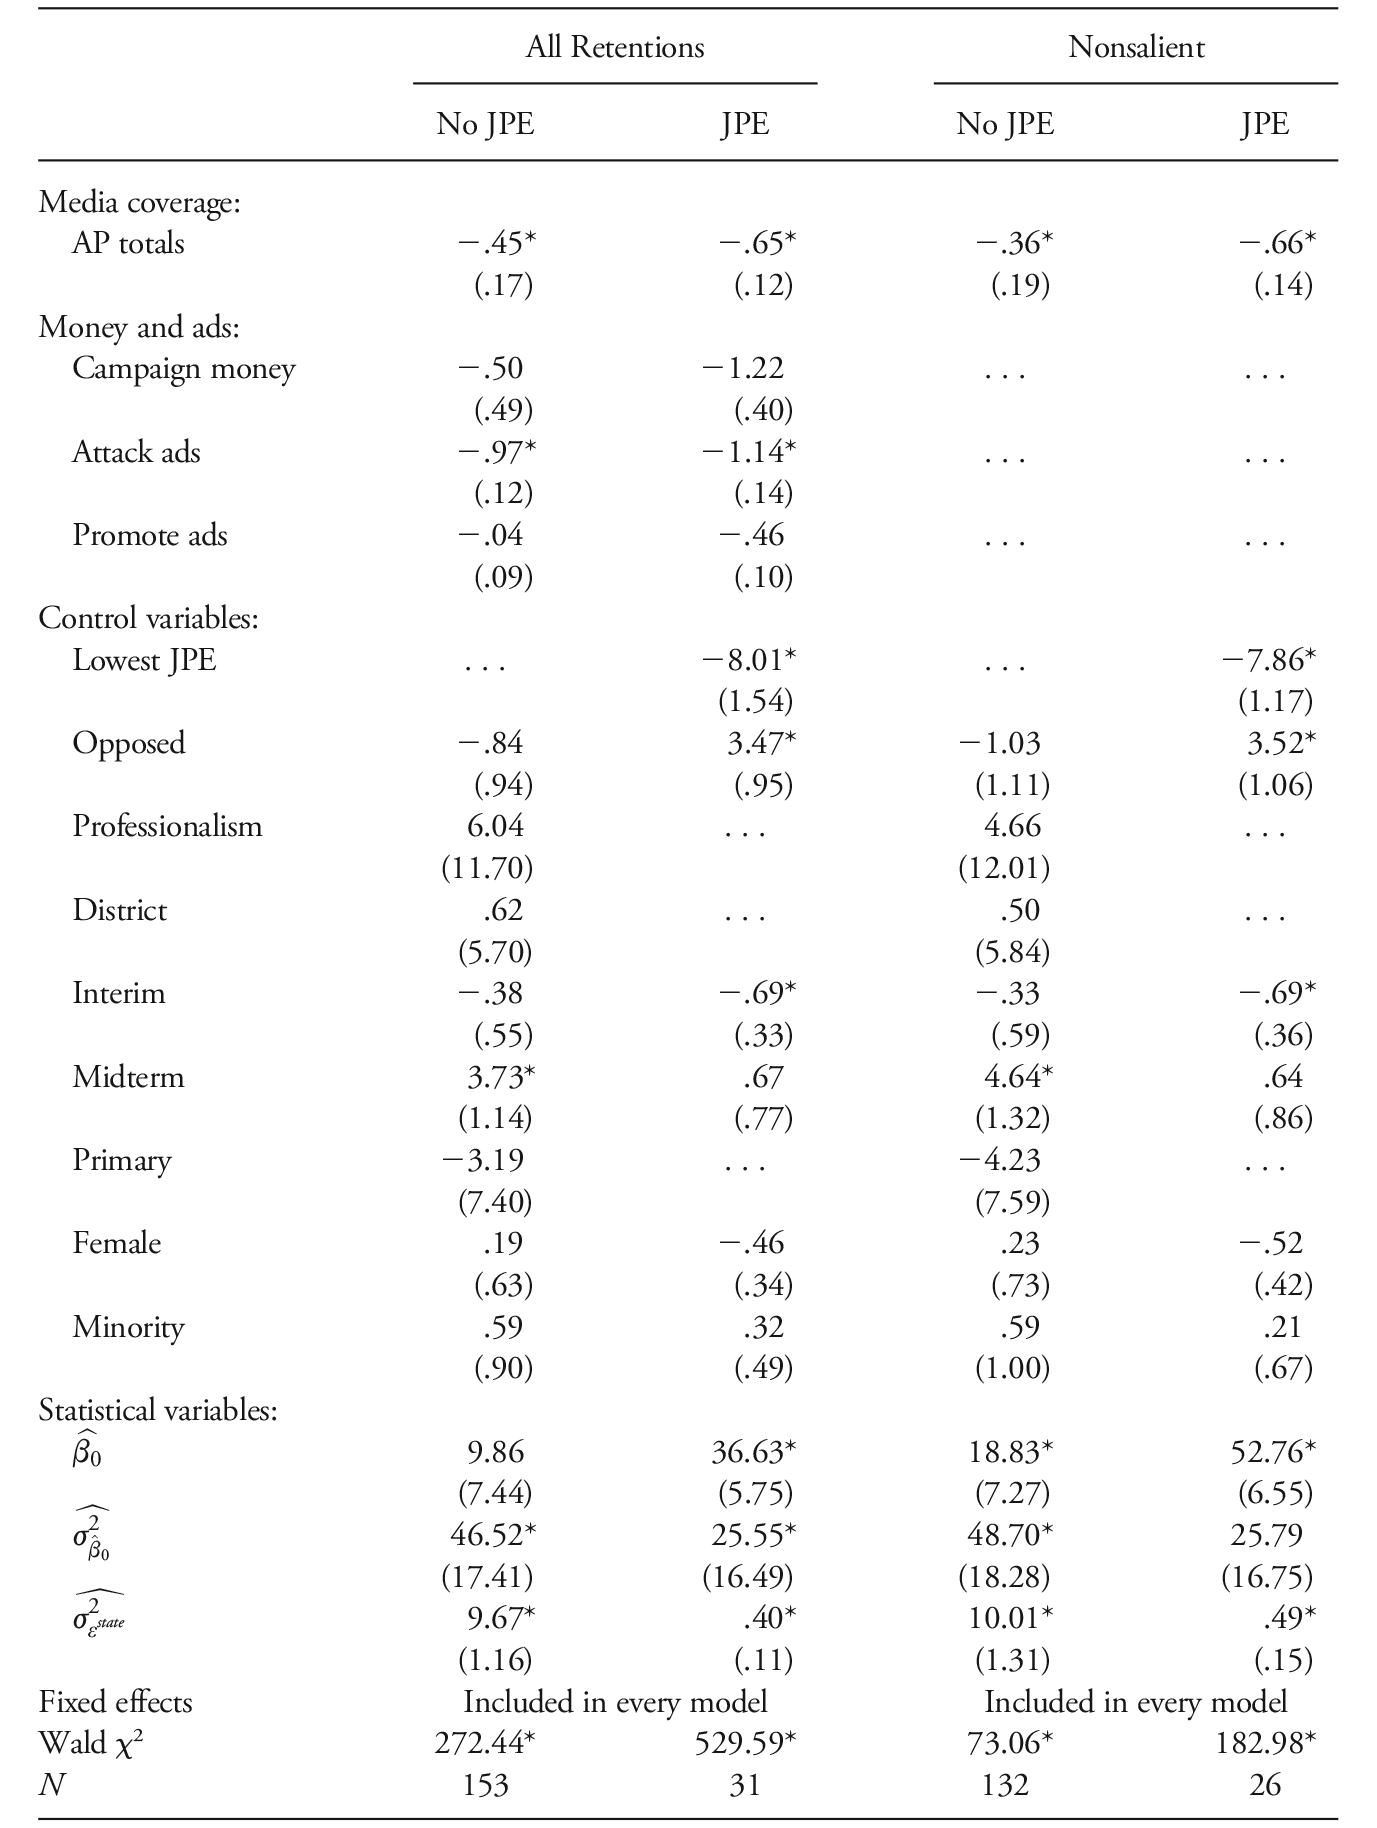
Merit selection states offer an ideal robustness check for the results in table 3 given that retention elections are often some of the least salient types of campaigns. Retention elections by default are unopposed, there is no party label, and candidates enjoy a sizable incumbency advantage. Between 2002 and 2014, 88.3% of all supreme court campaigns in merit selection states featured no television advertising, 94.2% featured no candidate fundraising, and incumbents averaged 70.2% support with 22% rolloff. If the media’s focus on judicial campaigns is what really drives voter engagement, then we would be unlikely to observe such an effect in states where campaigning is rare. To test this hypothesis, I reestimated the multilevel models of voter rolloff solely with respect to merit selection states.Footnote 55
I present results from these robustness checks in table 5.Footnote 56 The results are divided into four groups. The first includes every retention election in every merit selection state. The second major group omits every retention election in which some candidate either raised money for her retention or in which television advertisements were aired by any organization. This helps to further eliminate the possibility that campaign expense or advertising does not bias the results.Footnote 57 Finally, I separate the results to either include or exclude the variable JPE.Footnote 58
Voter Rolloff and Media Coverage in Merit Selection States
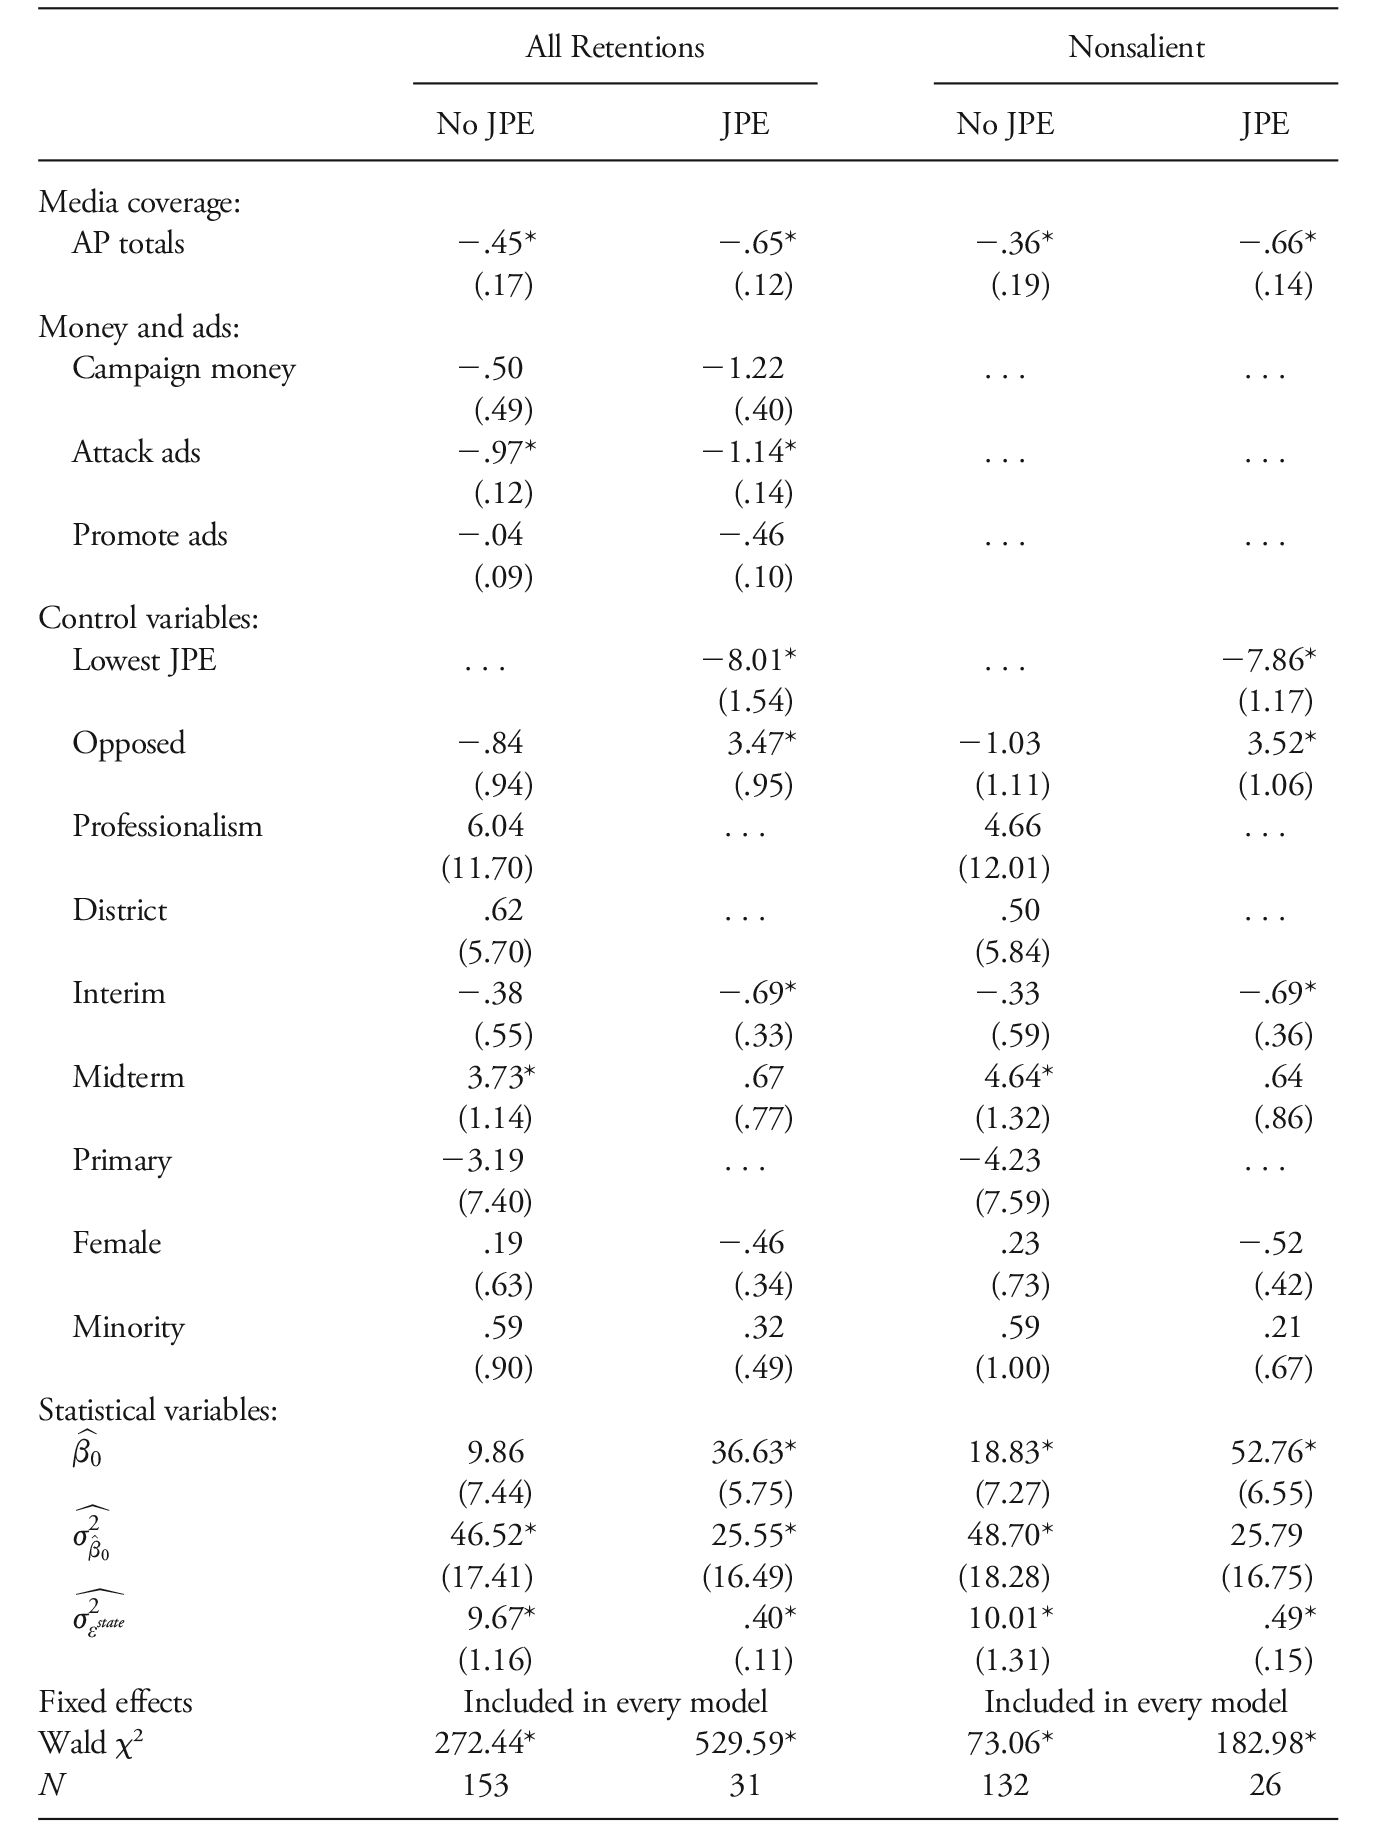
Note.— Multilevel linear regression coefficient estimates with errors grouped on each state court. Standard errors are in parentheses.
* p < .05, one-tailed.
Note right away that the media coverage variable is negative and statistically significant, as hypothesized, in each of the four multilevel models presented in table 5. It is worth pointing out that the marginal effect for media coverage is strictly smaller in the model that omits retention campaigns with fundraising and advertising, which supports the idea that at least some of the information the media conveys to voters simply reinforces that contained in judicial spending and advertising. Indeed, consistent with previous work, the models that examine all retention elections find strong evidence that expensive, well-advertised retention elections help to mobilize voters in traditionally inconspicuous campaigns (Hughes, Reference Hughesforthcoming).
Even when we control for the presence of opposition campaigns or performance evaluations, we see that greater media coverage significantly reduces voter rolloff. For all retention elections in which no money was raised and no advertisements were aired, a 1 standard deviation change from below to a 1 standard deviation above the average rate of media coverage results in a decrease in predicted rolloff from 24.2% to 22.9%—a 1.3-percentage-point change (or a 5.7% total change). In the model without judicial spending or advertising but including JPEs, media coverage is predicted to lower rolloff by 11.9%, all things being equal. Opposition campaigns and JPEs each attained statistical significance but in the opposite direction as hypothesized. Even still, these results derive from only 31 observations.
E. Coverage Content and Voter Rolloff in Judicial Elections
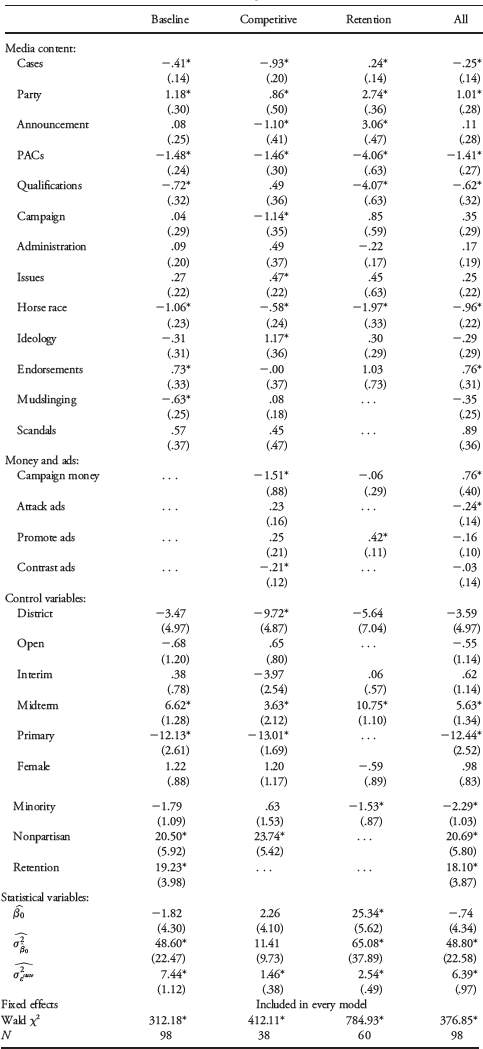
In the previous section, I found that media coverage of judicial campaigns increases voter participation even when incumbents are unopposed or raise no money to support their incumbency, or when neither they nor their surrogates air any television advertisements. What kinds of coverage, then, are likely to motivate such participation? In this section, I examine voter rolloff in response to media content of judicial elections. I reestimate multilevel regression models and present media effects in table 6 by content type.Footnote 59
Media Content and Voter Rolloff in State Supreme Court Elections (2002–2014)
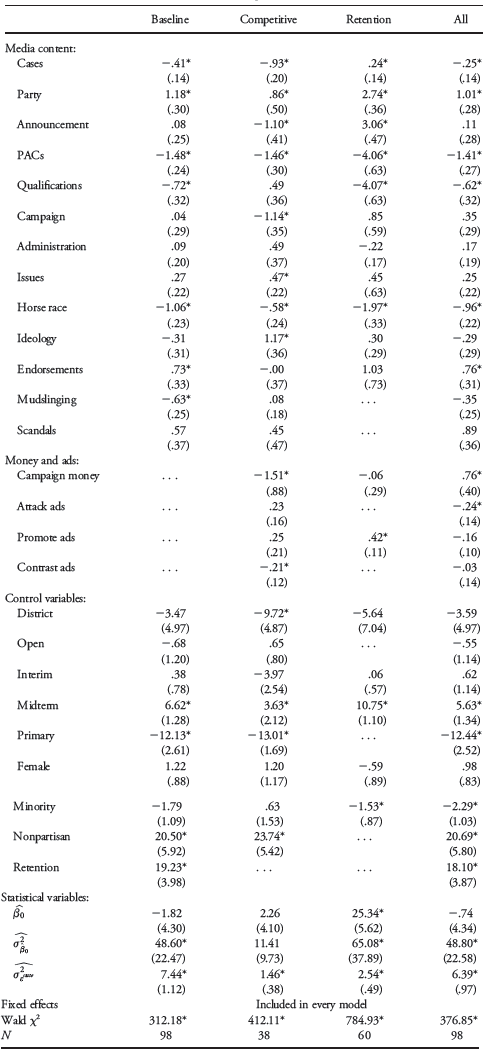
Note.— Multilevel linear regression coefficients with errors grouped on each state court. Standard errors are in parentheses.
* p < .05, one-tailed.
As anticipated, I find that media coverage of candidates’ and special interests’ activities is associated with greater rates of voter participation. This is good evidence that the media help to reinforce messages already presented by the campaigns themselves. Nevertheless, the models in table 6 also show how the media inform voters with other types of coverage. First, content relating to candidates’ voting behavior in court cases is associated with greater rates of participation in competitive elections.Footnote 60 Among these states, a change from 1 standard deviation below to 1 standard deviation above the average campaign’s case coverage is predicted to lower rolloff from 17% to 12.3%, all things being equal (a 27.6% decline). Interestingly, stories about candidates’ qualifications are also predicted to boost voter participation, especially in retention elections. Among all judicial elections, a change from 1 standard deviation below to 1 above the average number of stories about candidates’ qualifications is predicted to lower voter rolloff by 14.4%, all things being equal.
Similar to other types of elections, I find that horse-race coverage of judicial elections is also likely to increase voter participation. A change from 1 standard deviation below to 1 standard deviation above the average amount of horse-race coverage is predicted to decrease voter rolloff across all types of institutions by 2.8 percentage points (or 12.8%), all things being equal. Horse-race coverage rarely contains issue-specific information but helps to highlight the relative competitiveness of a given race or the likelihood that an individual’s vote will prove critical. A similar trend is evidenced for content relating to announcements and mudslinging. Therefore, it is interesting to compare the results from these types of issueless coverage to those relating to actual issues, ideology, partisanship, and endorsements. None of these variables are significantly associated with greater rates of voter engagement.
F. Other Control Variables Related to Voter Rolloff
I conclude this section with a brief discussion of the models’ other variables. First, note that controls for institutional design performed as anticipated throughout. All things being equal, when voters have access to candidates’ partisan affiliations, they are more likely to vote. An election’s timing can also affect voter participation. In some of the models, primary elections exhibited lower rates of rolloff, as hypothesized. But contrary to expectations, presidential elections were associated with greater rates of participation than were midterm elections. District elections also provided some mixed results. In only one model relating to competitive elections in a sample of 10 states did I find significant evidence that geographic districts increase voter participation. Despite the fact that institutional professionalism was signed appropriately in nearly every model, in none was it able to reject the null hypothesis. Elections featuring interim-appointed incumbents were associated with slightly greater rates of participation in merit selection states. I found no evidence that open elections featured greater rates of participation. I also found no evidence that voters cue off of candidates’ race in their voting, although at least one model in table 6 found that female candidates attract greater participation in a sample of 10 state supreme court elections.
VI. Conclusion
This research makes important new insights into the scholarly debate surrounding judicial elections, the public’s capacity to participate in them, and the media’s ability to facilitate that participation. The press is an important political intermediary in American politics, and yet virtually nothing is known about how the news media influence voter engagement in judicial elections. To address these shortcomings, I gathered new data relating to local media coverage of state supreme court campaigns. These data measure the volume of coverage in every type of judicial election across 34 states, 13 years, and 317 total state supreme court contests. Along with these new data, I also coded the content of over 700 news articles. The result is one of the most comprehensive analyses of media coverage of state supreme court elections to date.
I examined the effect of media coverage on voter participation in state supreme court elections. I found that increasing rates of coverage had a mobilizing effect on voters that was comparable to that of expensive campaigns. Additional analyses found that part of this effect was likely attributable to campaign expense and advertising rather than to the media itself. Nevertheless, robustness checks on merit selection races without any spending or advertising showed an independent effect of media coverage on voter participation. Additional tests showed that specific media content such as candidates’ voting behavior, qualifications, mudslinging, and the horse race were also likely to increase voter participation. Therefore, this research not only contributes to our understanding of how voters engage in judicial elections (e.g., Bonneau and Hall Reference Bonneau and Gann Hall2009; Hall Reference Hall2015) but also why supreme court justices might pander to popular preferences in response to increasing media coverage (Cann and Wilhelm Reference Cann and Wilhelm2011).
This research points to causal links between media coverage and voter participation, but without experimental methods, it is nearly impossible to eliminate altogether alternative explanations of voter participation. While subsequent work will need to take up this research agenda, others should consider the myriad ways in which media coverage might also affect judicial elections. For example, does greater transparency in the media hinder the incumbency advantage as campaign expense and advertising have been found to? And how has a receding news industry affected principal-agency in judicial elections? Finally, while I have briefly considered how the media choose to cover judicial campaigns, nothing approaching a full-blown theoretical or empirical model was advanced herein. Future scholarship will need to take up this task.
Appendix A. Supplementary Data on Rolloff and Media Coverage
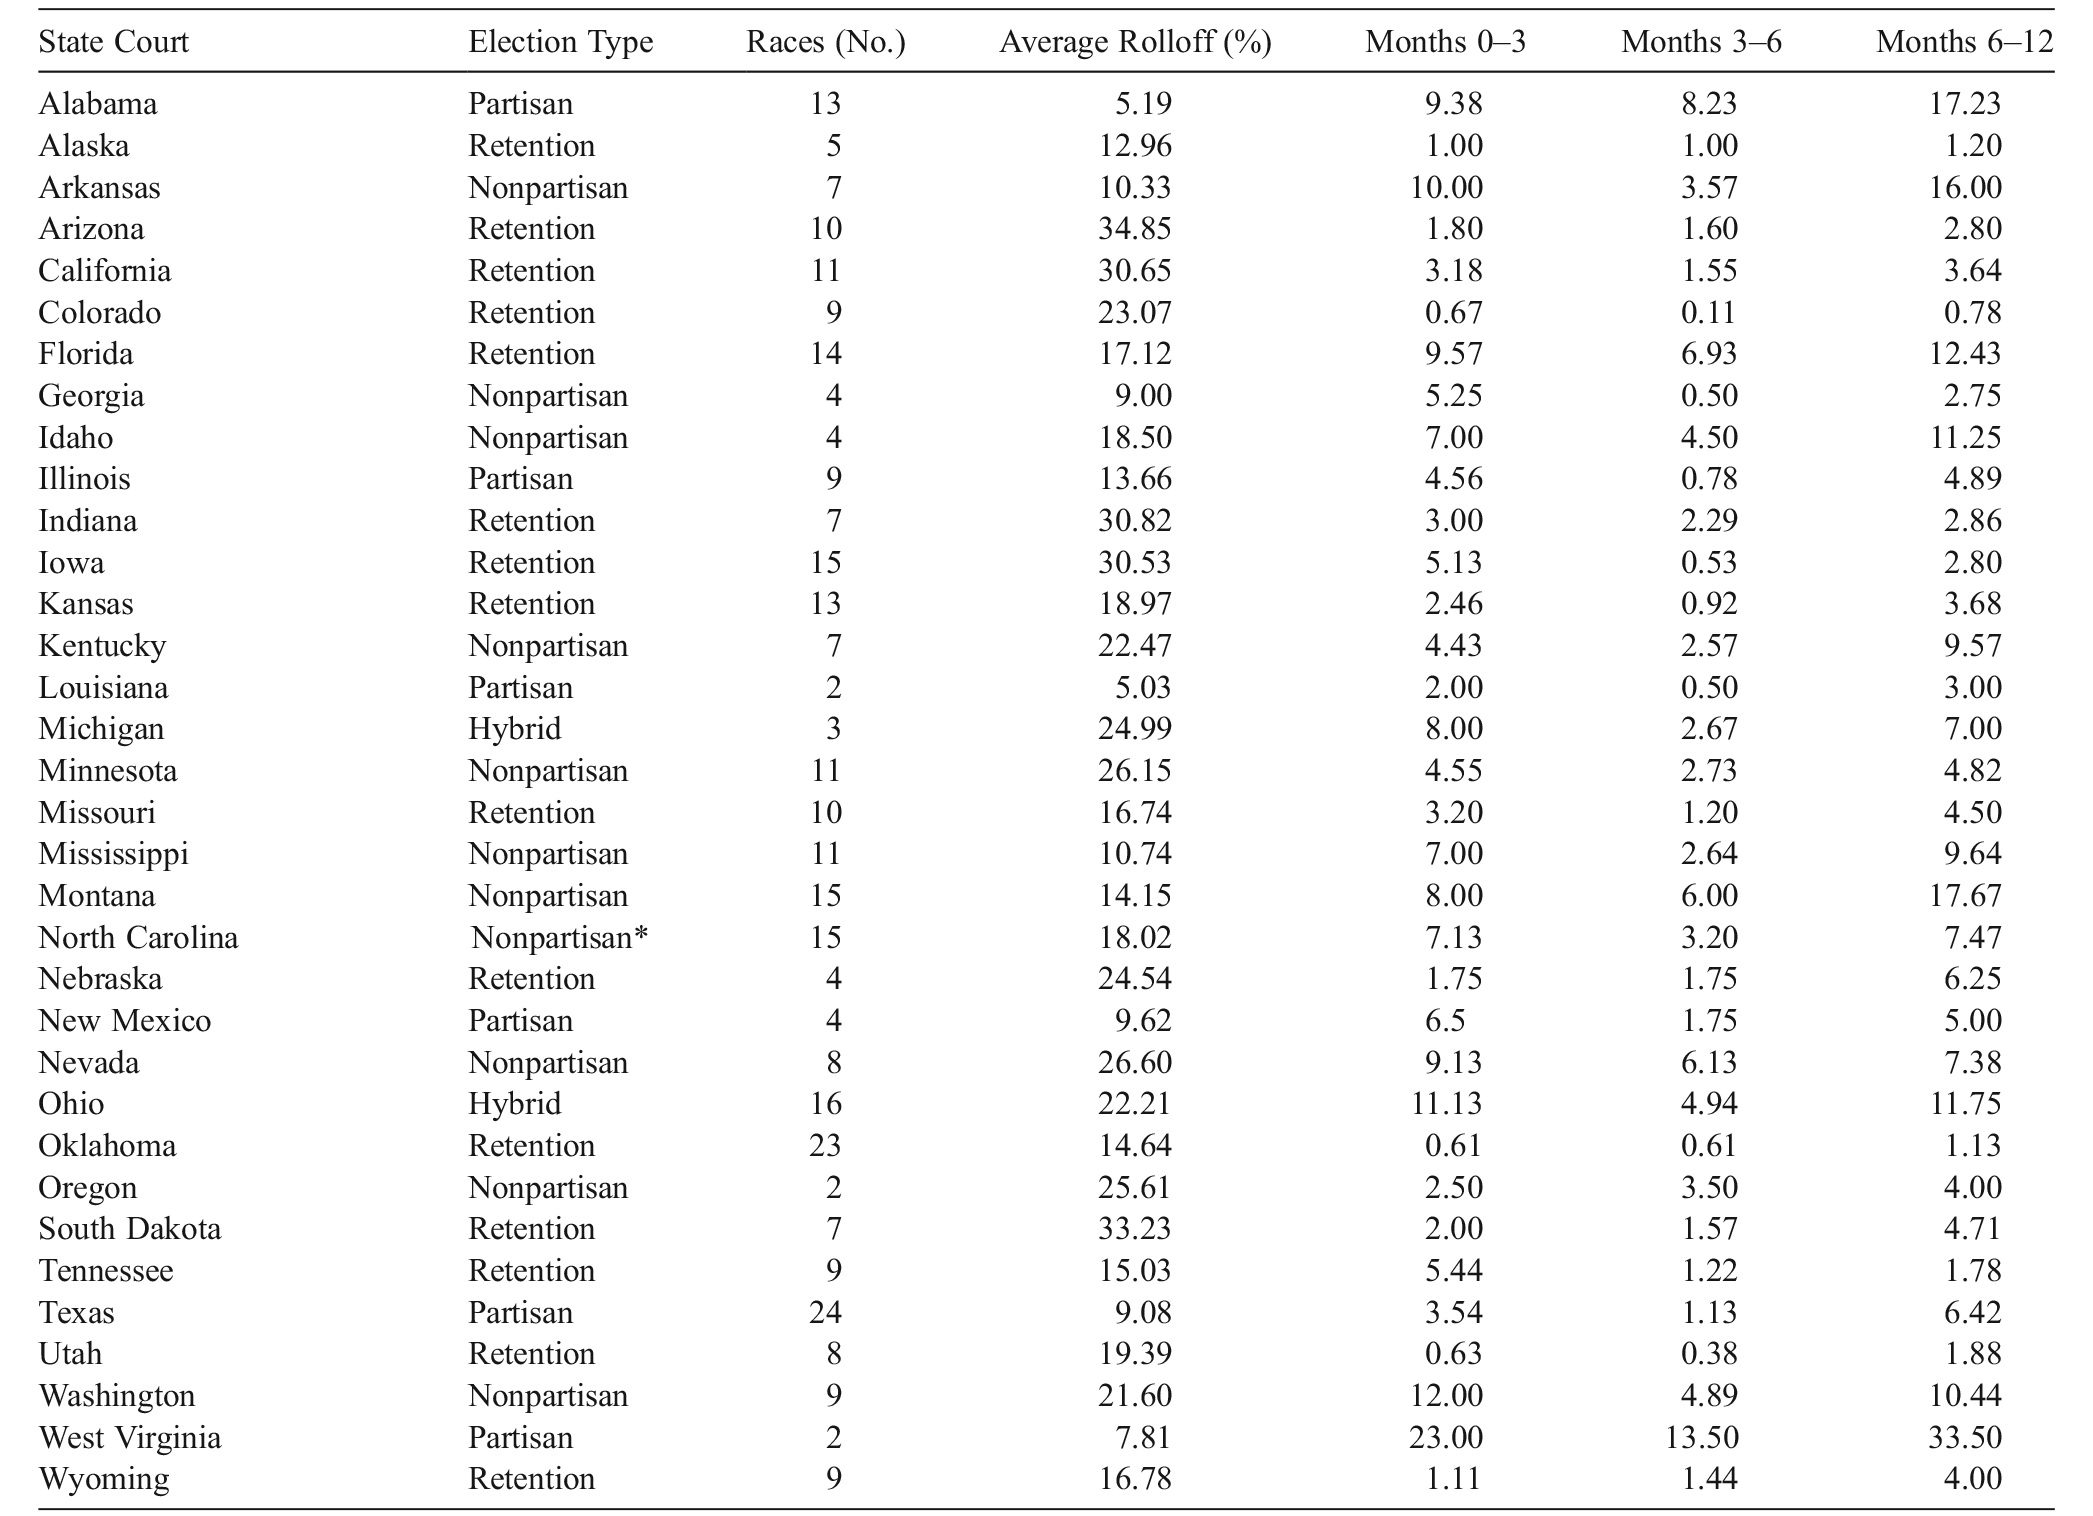
In this supplementary appendix, I present additional data relating to state supreme court elections, participation, and media coverage. In table A1, I summarize each state supreme court’s method of accountability, the number of contests studied, the average rolloff rate, and the average rate of media coverage.
Press Coverage and Participation in State Supreme Court Elections (2002–14)
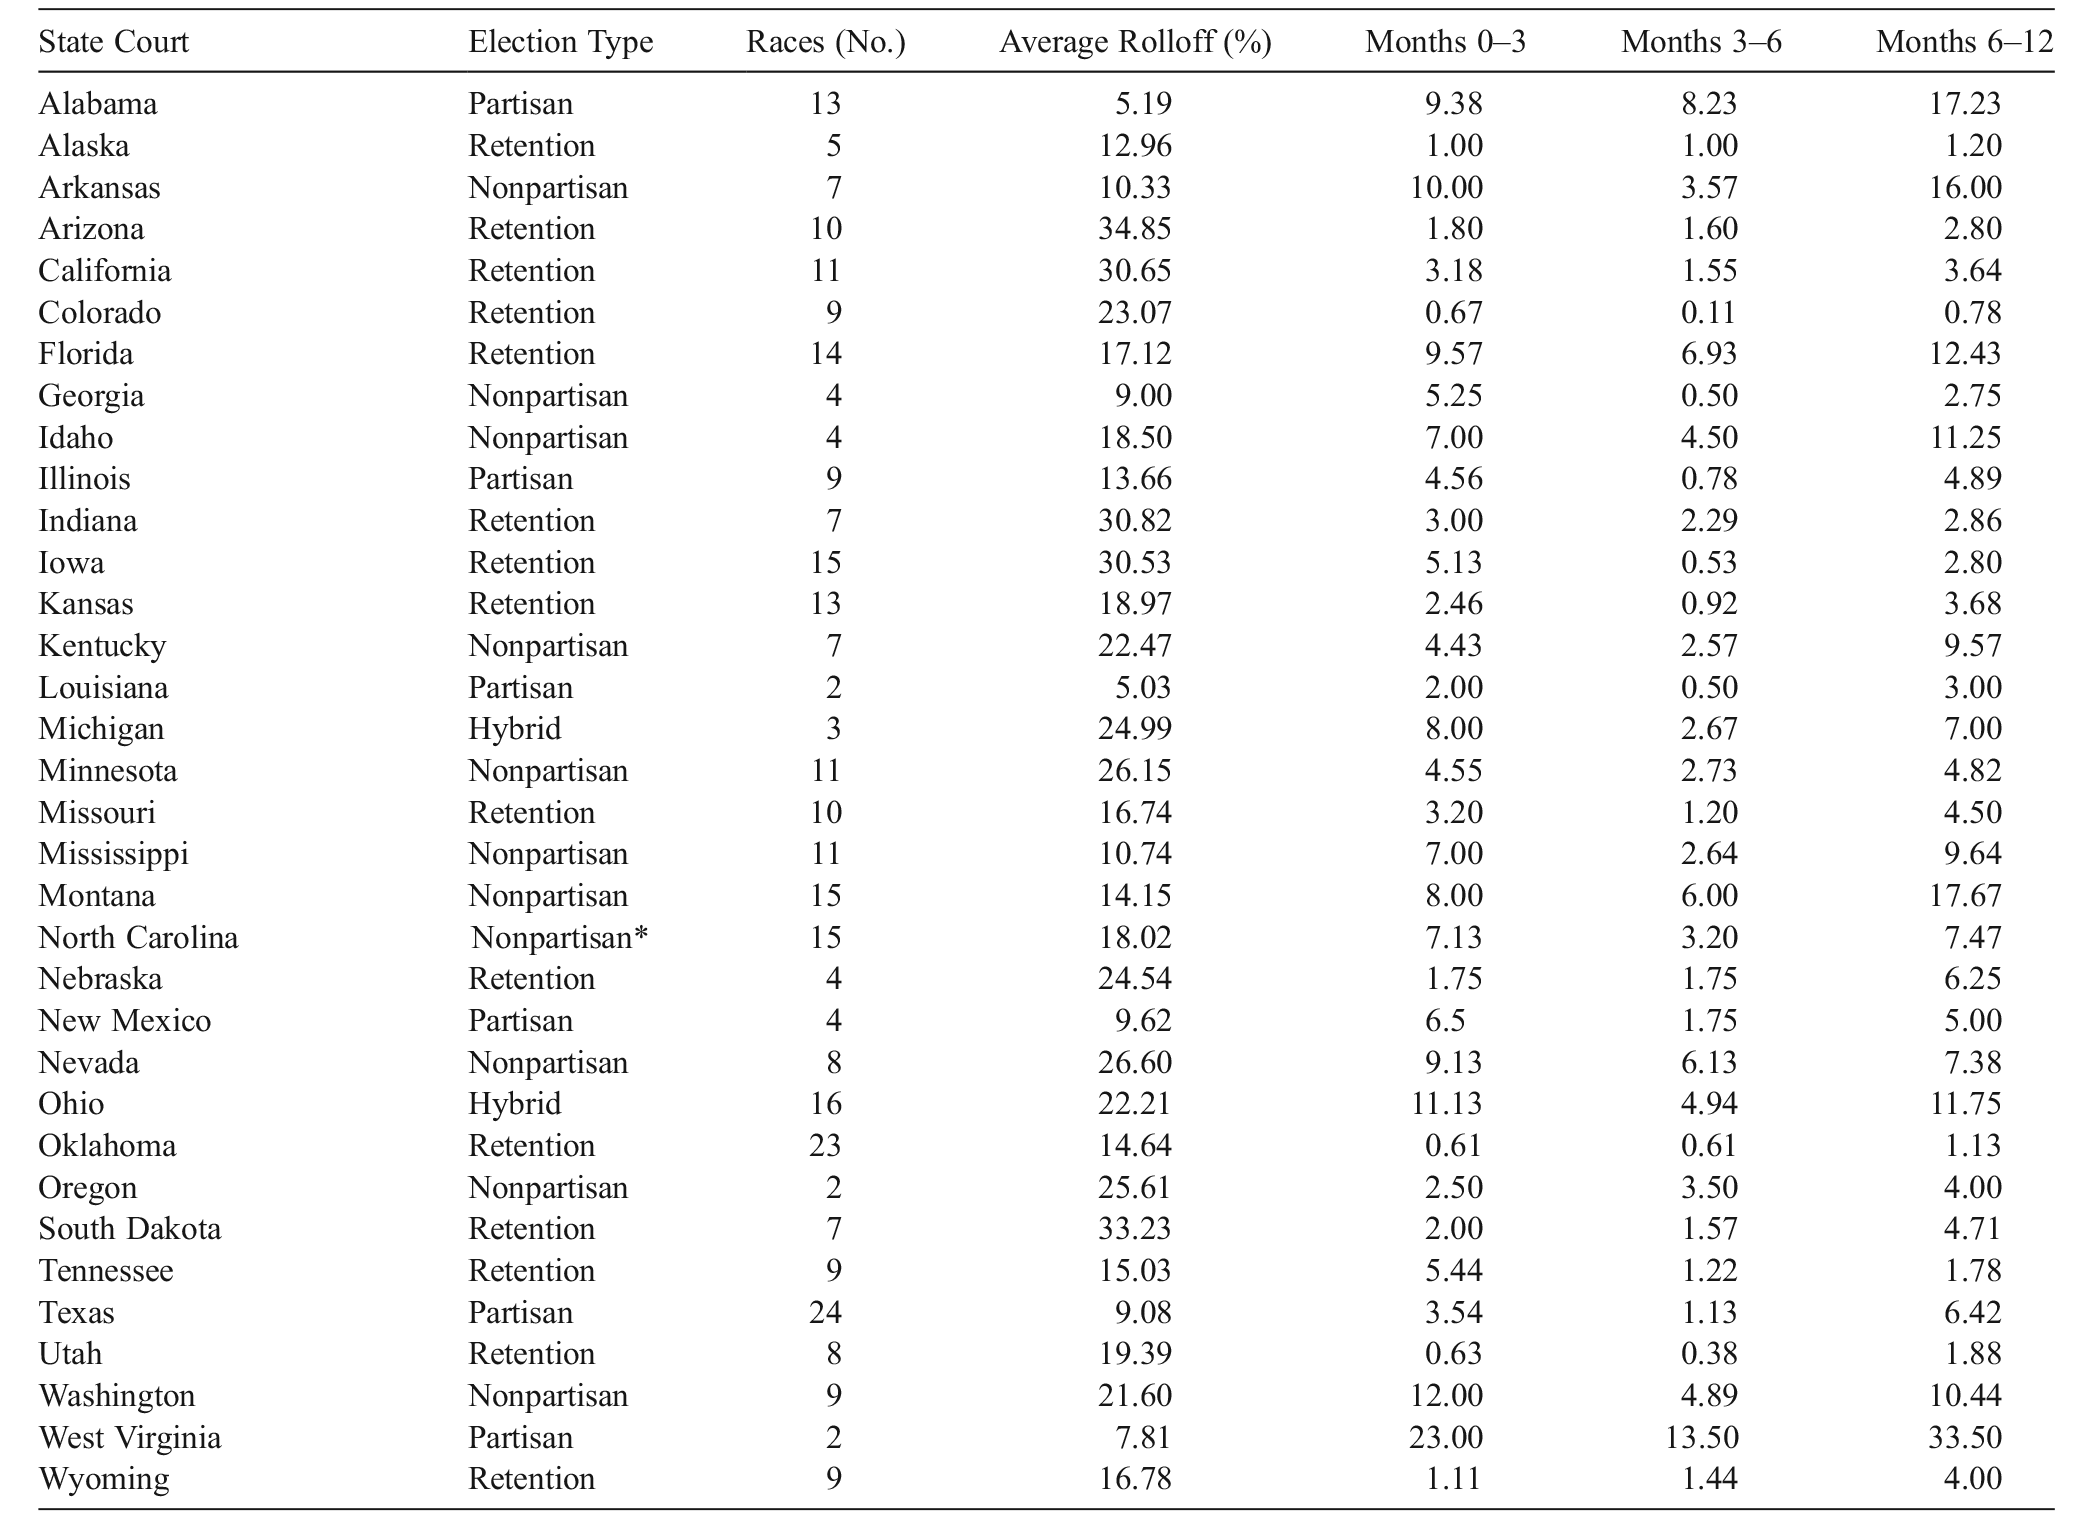
* North Carolina switched from partisan to nonpartisan elections in 2004.
Appendix B. Codebook for Content Analysis of AP Coverage
In this supplementary appendix, I outline the data-collection process for the content analysis presented in Section IV.B.2. I gathered data by typing candidates’ names and their states into a LexisNexis search of the AP’s State and Local Wire for the 6 months preceding an election. Duplicate results were partially removed by switching the “Duplicate Options” setting to “On.” Other duplicates were removed manually. When searching, candidates’ names were placed in quotation marks, and multiple versions of these names were used if needed. For example, the same search might find articles related to a candidate named John A. Smith using “John Smith” and “John A. Smith.” Finally, the Boolean operator “OR” was put between each candidate’s name, and the Boolean operator “AND” was put before the state name. Below, I define each of the 13 content areas under analysis and outline how each variable was coded.
-
Cases: Relates to legal cases. An article is included in this count if it discusses how candidates behaved in legal cases, including recusals. This count does not include cases to which a candidate was a party. But I do include cases to which a candidate played any official role such as attorney, judge, and so on.
-
Party: Relates to candidates’ party affiliations. An article is included in this count if it discusses the partisanship of any of the candidates for an individual office. It need not be the case that candidates vocally or officially affiliate with a party, although such is sufficient. I also include cases in which journalists infer a partisan affiliation. For example, I would include among our count the following hypothetical passage: “Candidate X, who is widely supported among Republican Party officials…. Candidate Y, however, receives most of her backing from Democrats.”
-
Announcements: Relates to an announcement pertaining to candidates’ bids for office. An article is included in this count if it announces an upcoming election date or the candidates for office. Also included in this count are announcements that candidates have cleared a technical hurdle toward their candidacy—such as filings deadlines. These counts essentially relate to reminders to voters that individuals are candidates for a position on a state supreme court.
-
PACs: Relates to the campaign activity of political action committees or special interest groups. An article is included in this count if it mentions PAC spending, advertising, or any other type of support or opposition relating to any candidate for a position on a state supreme court.
-
Qualifications: Relates to the qualifications of any of the candidates for a position on a state supreme court. An article is included in this count if it discusses a candidate’s occupational experience for the office to which he aspires. This can include experience as a judge or attorney, for example, although it can also include education, bar licenses, other government work, and so on. Not included in this category are titles. It is insufficient to count someone’s title such as “District Judge Smith” as an indication of his fitness for office. Rather, a lengthier discussion pertaining to the candidate’s years of experience or professional conduct is required before an article is included in this count.
-
Campaign: Relates to the campaign activity of candidates. An article is included in this count if it mentions the amount—although it need not be a specific dollar figure—of money that candidates have raised or spent for the office they are pursuing. Also included in this category are the television advertisements attributable to candidates. Finally, I also include discussions pertaining to any other campaign activity such as debates, bus tours, and so on.
-
Administration: Relates to the administrative duties of state supreme court justices. An article is included in this count if it mentions the administrative functions of supreme court justices such as administering oaths of office or managing personnel or other institutional resources.
-
Issues: Relates to specific issue areas. An article is included in this count if it discusses candidates’ specific stances on issues such as abortion, gun rights, taxation, and so on. It is insufficient for an article to discuss that candidates were asked about their positions on, say, the Second Amendment, to which they responded that they would not take a position. This variable is essentially a measure of a candidate’s propensity to take a position. I do not include votes cast in previous cases in this count. They are reserved for the variable Cases.
-
Horse Race: Relates to horse-race coverage. An article is included in this count if it discusses where the candidates are with respect to one another in a given race. This generally relates to polling data, although other insights relating to, for example, previous election results that lead journalists to speculate over how candidates will perform against one another are also included. Not included in this category is the amount of money or television advertisements candidates have raised or aired, which are coded in Campaign.
-
Ideology: Relates to ideology. An article is included in this count if it mentions the ideological predispositions of a candidate. This can include whether a candidate is liberal or conservative, left or right, or even his judicial philosophy such as whether he believes in a living Constitution versus “strict construction.” This count is distinct from Issues and Party in that it need not cover candidates’ party orientations or their specific stances on issues such as abortion or gun rights.
-
Endorsements: Relates to a candidate’s political endorsements. An article is included in this count if it discusses the endorsements a candidate has garnered. Not included in this count are discussions relating to campaign donations. Also not included are incidents in which entities decline to endorse any candidate. An article must directly tie a candidate to a specific endorsement for the present office to which she aspires.
-
Mudslinging: Relates to mudslinging. An article is included in this count if it discusses any candidate behavior that could be described as mudslinging. For an article to be included in this count, a candidate must specifically attack his or her opponents. This could include criticism of their (or their surrogates’) advertising, campaign literature, and so on. Not included among these articles are references to a candidate as the subject of such mudslinging attacks. A candidate must actively engage in such mudslinging to be counted.
-
Scandals: Relates to scandals. An article is included in this count if it discusses a scandal relating to a candidate for a position on a state supreme court. A scandal might relate to a potential crime, misuse of government resources, sexual impropriety, or some other story that would bring the moral or ethical character of a candidate into question. Scandals are not considered to be retroactive. That is, an issue may not begin as a scandal but can evolve as more information is made known. For example, a candidate might have an ethics complaint pending against him, but this is not considered a scandal until some official recognition that one has behaved improperly. In determining what does and does not constitute a scandal, the coder is to determine whether the preponderance of evidence, at the time the article is written, brings the moral or ethical character of a candidate into question.
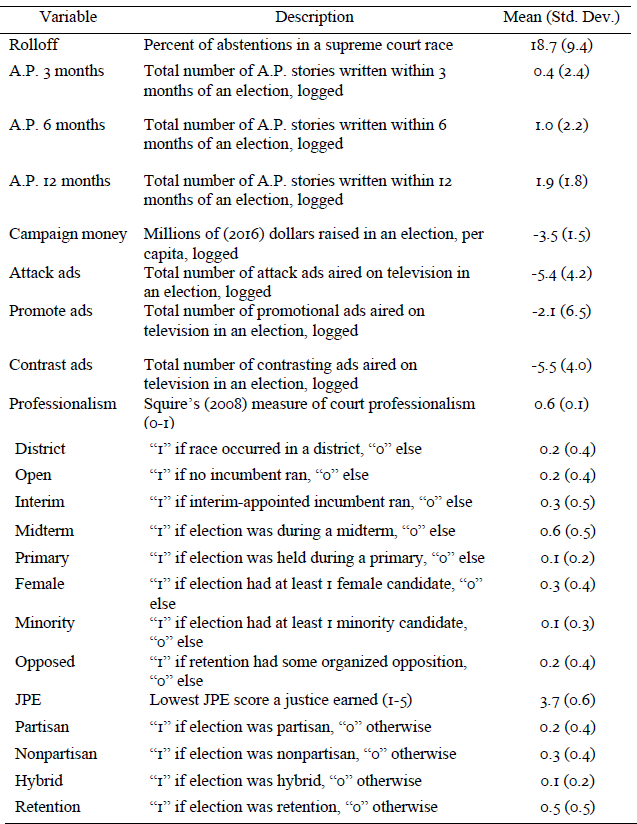
Appendix C. Descriptive Statistics
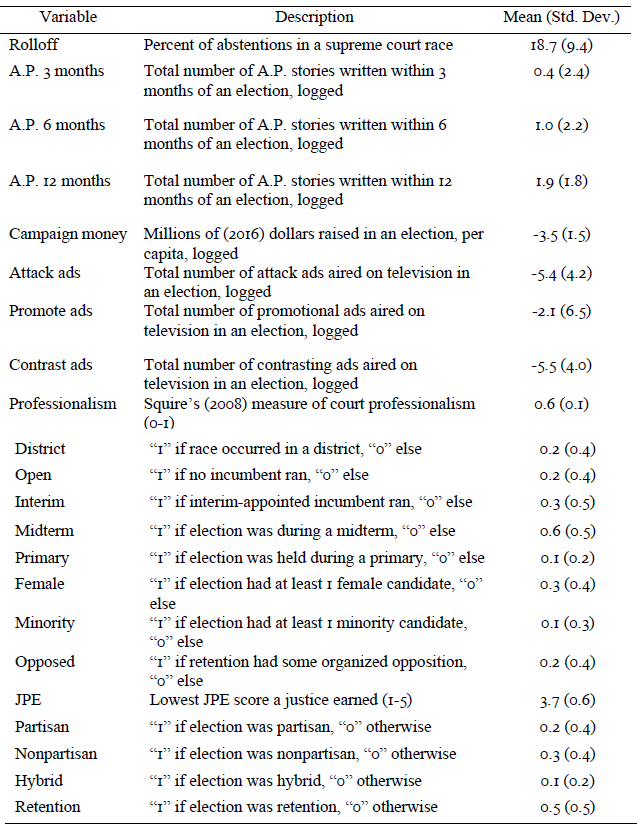
In this supplementary appendix, I provide additional information relating to the variables in the statistical models above. In table C1, I provide descriptive statistics, coding schemes, means, and standard deviations for these data. For descriptions of the variables used in the content analyses, see Section IV.B.2 along with appendix B.
Descriptive Statistics for Variables in Quantitative Analyses