


Introduction
Large-scale model simulations indicate that the Arctic sea-ice cover plays a significant role in global climate and may be a harbinger of global warming. These simulations also indicate that there are uncertainties concerning the proper way to treat the complex interactions between the ice, ocean and atmosphere (Reference Ingram, Wilson and MitchellIngram and others, 1989; Reference Manabe and StoufferManabe and Stouffer, 1993; Reference Rind, Healy, Parkinson and MartinsonRind and others, 1995). SHEBA, a study of the Surface Heat Budget of the Arctic Ocean (Reference Moritz, Curry, Thorndike and UntersteinerMoritz and others, 1993; Reference Moritz and PerovichMoritz and Perovich, 1996), is a large, interdisciplinary program designed to address this significance and uncertainty. The SHEBA goals are to understand the ice-albedo and cloud-radiation feedback mechanisms and to use that understanding to improve the treatment of sea ice in large-scale models.
As part of the year-long SHEBA field experiment (Reference PerovichPerovich and others, 1999b), we measured the temperature field of the ice over the annual cycle from October 1997 through October 1998. Temperature measurements, along with mass-balance measurements, were made at several sites selected to sample different ice types, ranging from first-year ice to thick multi-year ridges. The sites were all within a few kilometers of one another. Previous work has determined the annual cycle of ice temperature for shore-fast ice and multi-year pack ice (Reference UntersteinerUntersteiner, 1961, Reference Untersteiner1964; Reference Doronin and KheisinDoronin and Kheisin, 1977; Reference BilelloBilello, 1980). In this paper we address the annual cycle for first-year ice, melt ponds, ridges and undeformed multi-year ice and explore the similarities and differences in the annual cycle of ice temperature and mass balance for these ice types. We also investigate the spatial variability of ice temperature and relate this variability to snow depth and ice thickness. These temperature time series provide insight into the impact of ice type on sea-ice thermodynamics and can also be used as a diagnostic tool for sea-ice thermodynamic models.
Instruments and Methods
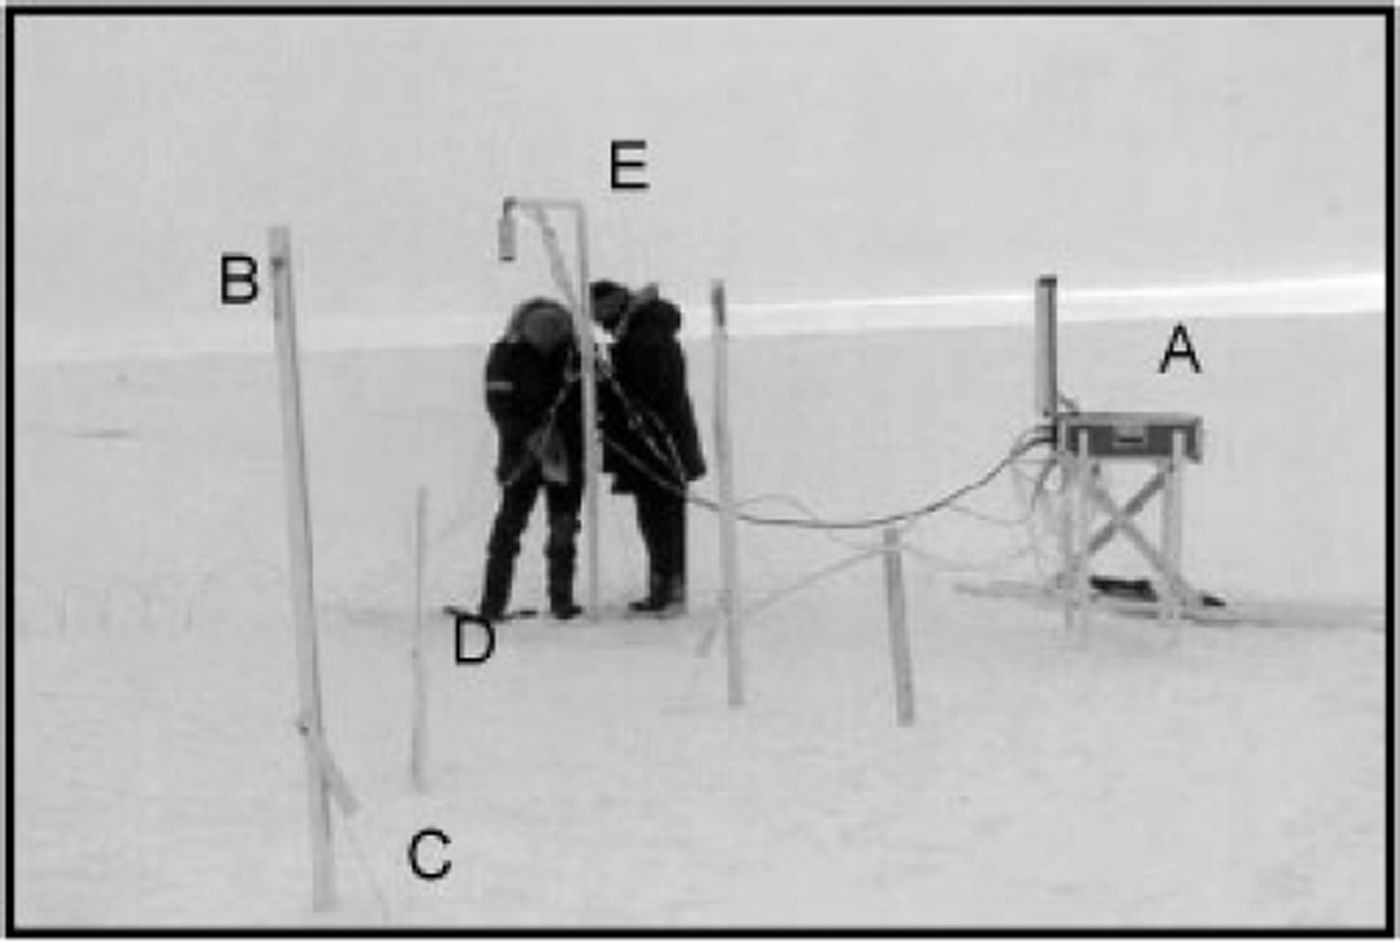
Figure 1 shows a standard ice-temperature site placed in multi-year ice. All temperature sites were installed in October 1997, and most of them operated until September 1998. Each site consisted of a datalogger (A) and three ablation-stake (B)/ thickness-gauge (C) pairs in a triangular array surrounding a thermistor string (D) at a distance of roughly 1 m. At this particular site there was also an acoustic sensor (E) that monitored the position of the top of the snow or ice.
Temperature and mass-balance instruments at a multi-year-ice site (quebec). instrumentation at ms site included: (a) campbell scientific CR-10 datalogger, (b) ablation stakes, (c) thickness gauges, (d) thermistor probe and (e) acoustic sounder.
Thermistor strings were the central component of our ice-temperature sites. The basic building-block of the thermistor string was a meter-long PVC rod with ten YSI#44033 thermistors mounted at 10 cm intervals. Individual rods were connected to make strings with thermistors spaced at intervals of 5 or 10 cm. The strings extended from the air, through the snow and ice and into the upper ocean. Thermistor measurements were collected hourly and the data were stored using a Campbell Scientific Inc. CR-10 datalogger. The accuracy of the thermistors was better than 0.1 °C. Sites were periodically visited to retrieve data and to manually read the ablation stakes and thickness gauges.
Ablation stakes and thickness gauges are the standard equipment used in sea-ice mass-balance measurements (Reference UntersteinerUntersteiner, 1961; Reference HansonHanson, 1965; Reference WettlauferWettlaufer, 1991). Ablation stakes are simply white sticks frozen into the ice and are used to determine the position of the surface. A thickness gauge consists of a stainless-steel wire with a wooden handle on one end and a metal crossbar on the other. These gauges are frozen into the ice with the handle above the surface and the crossbar dangling in the ocean. To make a measurement, the wire is hooked up to a generator, melting the wire free of the ice, and the handle is lifted until the crossbar hits the bottom of the ice, and the vertical position of the handle is read on the ablation stake, giving the position of the ice bottom.
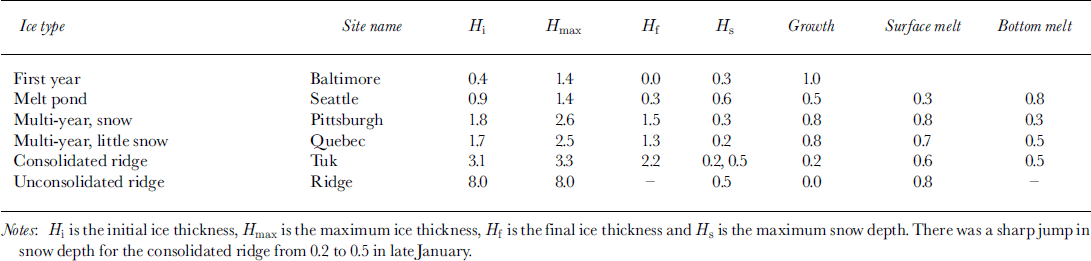
We installed thermistor strings at several locations including six sites on the SHEBA main floe. The sites were: (a) young ice, (b) ponded ice, (c) snow-covered multi-year ice, (d) multi-year ice with only a thin snow cover, (e) a consolidated ridge and (f) a new ridge. SHEBA was an interdisciplinary experiment, and there was close coordination between atmosphere, ice and ocean studies. To provide a common frame of reference we named all of our sites after cities. The names of each of our sites are provided in Table 1.
Summary of ice-temperature sites (units are meters)
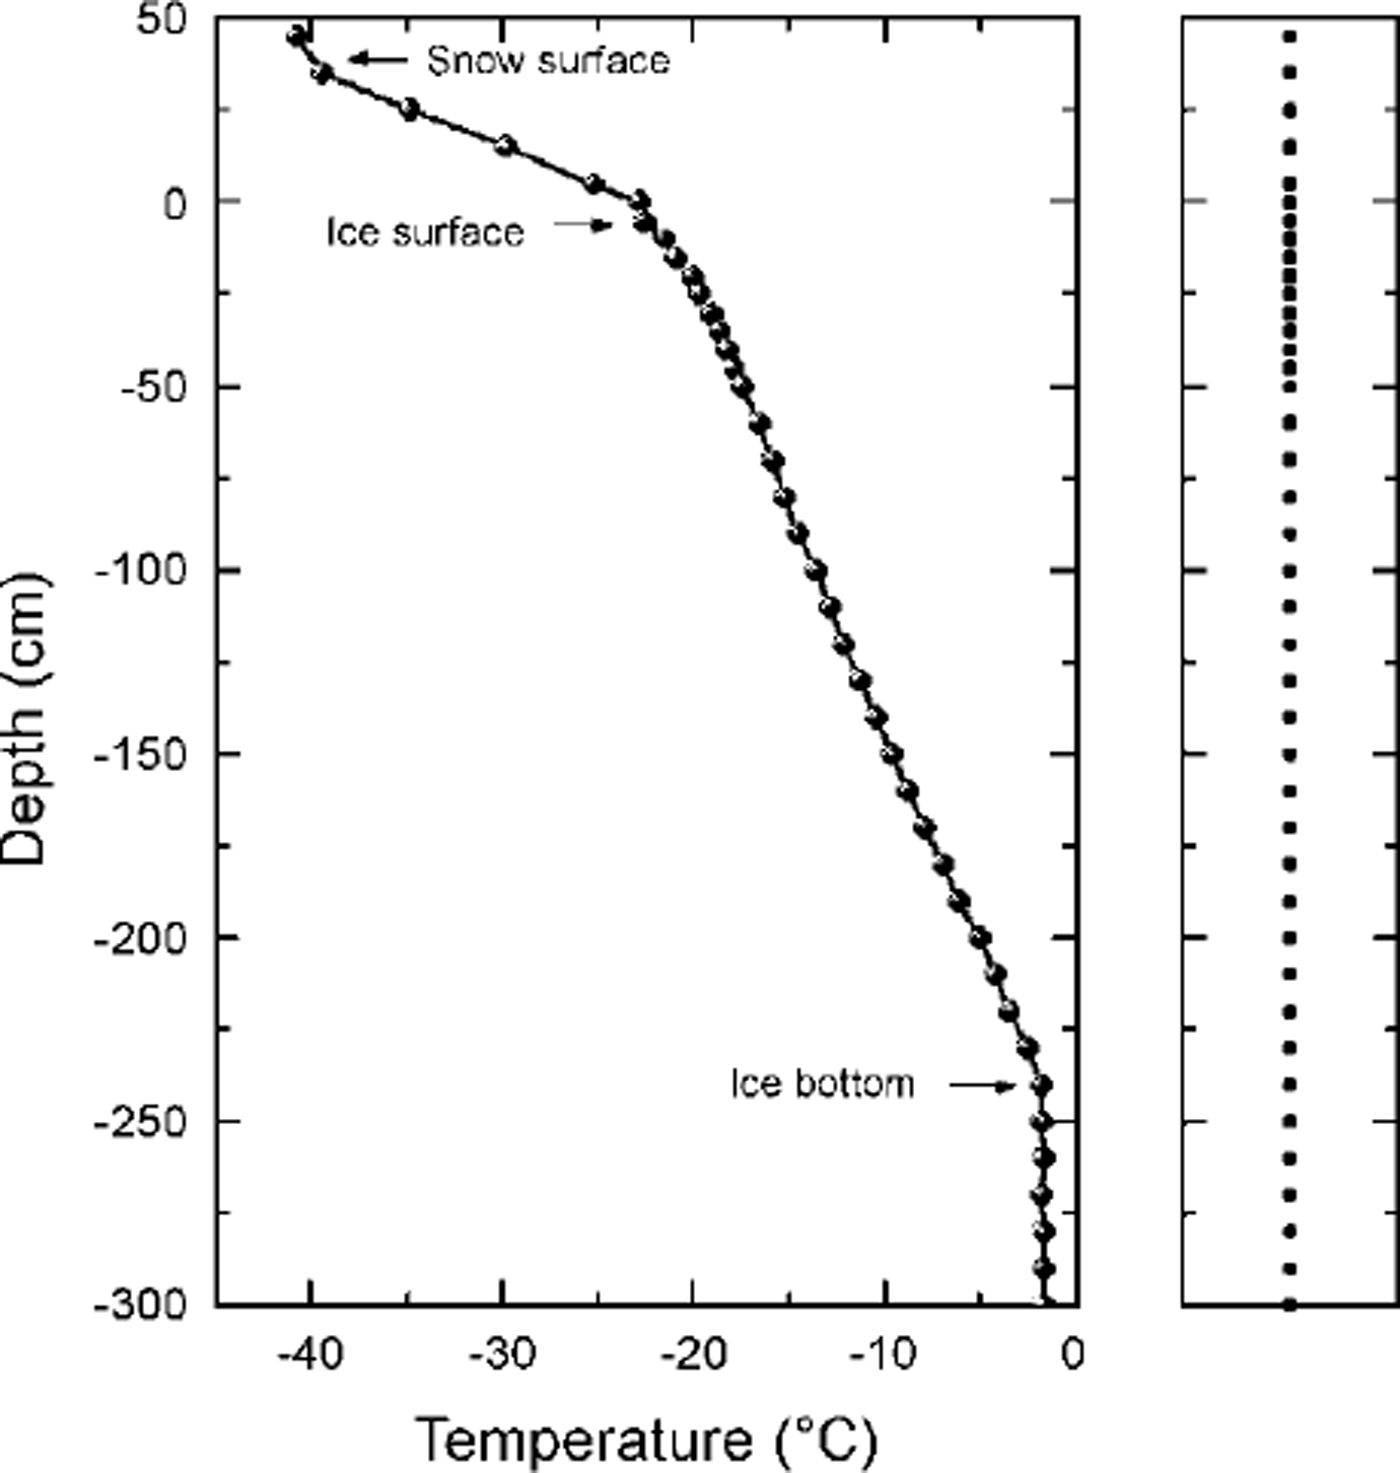
A temperature profile from snow-covered multi-year ice is plotted in Figure 2. The spacing at this site was 10 cm in the snow, 5 cm in the upper 50 cm of the ice and 10 cm elsewhere. As the arrows in Figure 2 illustrate, changes in slope of the temperature profile can be used to determine the location of the snow surface, the ice surface and the ice bottom (Reference Perovich, Elder and Richter-MengePerovich and others, 1997) and thus can be used to estimate the snow depth and ice thickness.
Temperature profile from snow-covered multi-year ice on 25 february 1998. the dark dots in the righthand panel denote the thermistor positions at this site.
Results
Temporal evolution
The annual cycle of temperature and mass balance from October 1997 to October 1998 for the six sites is displayed in Figure 3. Key features in the growth and decay history of each site are summarized in Table 1. A more detailed description of these sites, as well as the complete temperature record for each site, is available on CD-ROM (Reference PerovichPerovich and others, 1999a).
The annual cycle of temperature for (a) first-year ice, (b) ponded ice, (c) multi-year ice, (d) multi-year ice with a thin snow cover, (e) an old consolidated ridge and (f) a deep unconsolidated ridge. the internal ice temperature is displayed using color contours, with blue being cold (−20°c) and red warm (0°c). the gray shaded area represents snow depth, black areas are missing data, the navy blue represents the ocean, the boundary between red and navy blue is the ice/ocean interface, and the red-white boundary is the ice/air interface.

The general seasonal evolution of temperature is similar at all sites. As the color contours show, a cold front propagates down through the ice in winter. At all sites but one, growth at the underside of the ice began in mid-November and continued through late May. The one exception was the 8 m thick unconsolidated ridge, where the bottom was melting the entire year. The ice warmed throughout late spring. By July the ice was within a degree of being isothermal at its freezing point. Superposed over this seasonal trend were short-term oscillations in the temperature of the upper 50 cm of the ice due to synoptic weather changes.
The first-year site started growing in late August 1997 and was about 40 cm thick in mid-October 1997 (Fig. 3a). Ice thickness here increased from 0.4 m in October 1997 to 1.4 m in June 1998. The thin ice and deep snow kept ice temperatures relatively warm during winter. This area was heavily ponded in summer 1998, with many of the ponds melting all the way through to the ocean. The thermistor site became a small pond and melted through to the ocean, ending the temperature record in July. However, not all of the first-year ice at this site melted; by the end of summer the non-ponded area was about 80 cm thick.
The ponded ice (Fig. 3b) was in a shallow depression that drifted in with snow in early November. From December on, the snow was 50−60 cm deep at this site. Because of the freezing of the pond early in the fall and the deep snow in winter and in spring, ice temperatures here were warmer than at the other sites. Ice thickness at the pond site increased from 0.9 m in October 1997 to only 1.4 m in June 1998. Even though the pond site initially was more than twice as thick as the first-year ice, by the end of the growth season they were the same thickness. In the summer, surface melting was delayed by the heavy snow cover. The area around the pond site was heavily ponded in summer 1998, as it was in summer 1997. For the most part, the ponded areas of 1997 were the ponded areas of 1998. During summer melt there was 30 cm of surface ablation and 80 cm of bottom ablation at the pond site. Bottom melting in August was enhanced by close proximity to a lead.
One of the multi-year sites (Fig. 3c) was also the mass-balance site for the SHEBA column (Reference PerovichPerovich and others, 1999b). This site was surrounded by ponds throughout the summer, though the temperature site itself remained pond-free. The ice thickness increased from 1.85 m in October 1997 to 2.6 m in June 1998. During summer there was 80 cm of surface ablation and 30 cm of bottom ablation.
There was another multi-year site that was a slightly raised hummock (Fig. 3d) with a thin snow cover (10−20 cm). The thin snow cover resulted in cold ice temperatures and significant ice growth. Ice thickness increased from 1.75 m in October 1997 to 2.55 m injune 1998. By comparison, the initial thickness at this site was twice as much as at the pond site, yet there was 50% more ice growth here. During summer melt there was 70 cm of surface ablation and 55 cm of bottom ablation.
There was significant ridging activity near the consolidated ridge site (Fig. 3e) throughout the winter. The snow cover was fairly thin (15−20 cm) until late January when the snow depth began to increase due to drifting, eventually reaching 50 cm in April. This relatively shallow snow, combined with the thick ice, resulted in cold ice temperatures at the consolidated ridge during winter. However, since the ice was thick, growth at this site was modest, with an increase from 3.1 m in October 1997 to 3.3 m injune 1998. The temperature record at this site ends in late July, when the thermistor string was destroyed by a mama bear and cub. During summer melt, there was 55 cm of surface ablation and 50 cm of bottom ablation. In winter, snow depths were 20−30 cm.
The young ridge (Fig. 3f) that was instrumented probably formed in the spring of 1997. In the fall of 1997, individual blocks could easily be identified in the ridge, both on the surface and on the underside of the ridge. It took the entire growth season for the winter cold pulse to approach the bottom of the ice. In the summer the ridge ice never became isothermal, as the ice in the middle of the ridge stayed a bit cooler than freezing (−2 to −4°C). Initially the ridge was 8 m thick. We were unable to monitor the ice thickness at this site because the thickness gauges failed
Variability with snow and ice conditions
The results indicate that the internal ice-temperature field at SHEBA was not horizontally homogeneous. Driven by differences in snow depth and ice thickness, there was significant spatial variability in the ice temperature. Time series from October to June of air temperatures, snow/ice interface temperatures and temperature 50 cm deep in the ice at the six sites are plotted in Figure 4. Air temperatures were measured 0.5−1.0 m above the surface. During winter, air temperatures measured using the thermistor strings were consistent with more rigorous measurements made by the SHEBA atmospheric boundary-layer team (Reference Claffey, Andreas, Perovich, Fairall, Guest and PerssonClaffey and others, 1999). Even though our sites were up to 5 km apart, air temperatures typically were within 1−2°C, implying that during winter, atmospheric forcing was quite similar at these sites. However, there were significant differences in the snow/ice interface temperature and in the internal ice temperature between the sites. In late December, for example, interface temperatures ranged from −40°C for the consolidated ridge to −10°C for the pond site. Similar large differences occurred during other cold periods in mid-January and late February.
Time series of (a) air temperatures, (b) snow/ice interface temperatures and (c) temperature 50 cm deep in the ice for the six sites, october 1997−june 1998.

Though the magnitude of the snow/ice interface temperature variation changed throughout the winter, the thermal sequence of the sites did not. In the simplest sense, thin ice and deep snow produced warm interface temperatures, while thick ice and shallow snow resulted in cold interface temperatures. The pond and first-year ice sites were the warmest. In late November, snowdrifts "filled in" the pond site. After this point, snow depths at the pond site were >50cm, and snow/ice interface temperatures were always the warmest of the six sites. The first-year ice site, with the thinnest ice and average snow depths, had the next warmest temperatures. The multi-year ice with a 25−30 cm snow cover had interface temperatures that were 5−10°C colder than the first-year ice. The interface temperature of the unconsolidated ridge was close to the snow-covered multi-year-ice site, typically being 2°C colder. The thin-snow, multi-year-ice site and the consolidated ridge had the coldest snow/ice interface temperatures. Both of these sites had a combination of a relatively shallow snow cover and relatively thick ice. From December through February the consolidated ridge had the coldest interface temperatures. In February, ice ridging and snowdrifting caused an increase in snow depth at the consolidated ridge site. Interface temperatures increased to values comparable to the thin-snow, multi-year-ice site.
Internal ice temperatures from a depth of 50 cm in the ice show the same kind of behavior, though attenuated, as the interface temperatures. The sequence of the sites from warm to cold is unchanged from the snow/ice interface temperatures, though the maximum variation between sites at this depth is < 20°C. The clustering of the sites into two groups, (1) first-year and ponded ice and (2) multi-year and ridged ice, is much more pronounced. Also, as would be expected, the temperature time series at depth is smoother, since rapid fluctuations in air temperature do not propagate to this depth.
These temperature observations, taken in conjunction with the observed large spatial variability in snow depth (Sturm and others, in press a, b), imply that under some circumstances there may be significant heat transport horizontally as well as vertically. For example, we often found hummocks adjacent to melt ponds, separated by only a few meters. As Figures 3 and 4 indicate, temperature profiles are quite different in ponded ice and a hummock. Selecting a cold period (25 February 1998), we calculated vertical temperature gradients in the ponded ice of roughly 8˚C m−1. Comparing profiles for the pond and a hummock, and assuming that they were 3 m apart, gives computed horizontal temperature gradients of approximately 4˚C m−1. This represents an extreme case where horizontal gradients would be largest. This is roughly half of the vertical gradients and could represent a non-negligible mechanism for additional heat loss.
Summary
At all sites the seasonal evolution of ice temperature followed a general pattern of (1) a cold front propagating down through the ice in the fall, (2) cold ice temperatures and ice growth in late fall, winter and early spring, and (3) warming to the freezing point in the summer. Within this general pattern, there was considerable spatial variability in ice temperature, particularly during winter, with variations in snow/ice interface temperatures as great as 30°C between sites. Generally, the snow/ice interface and internal ice temperatures were warmer for thinner ice and deeper snow, while thicker ice and shallower snow resulted in colder temperatures. The coldest ice temperatures were observed in a consolidated ridge with a thin snow cover, while the warmest were in ponded ice. The pond was in a depression that quickly drifted in with snow, resulting in warm ice temperatures and reduced ice growth. The spatial variability in snow depth and ice conditions can result in situations where there is significant horizontal transport of heat.
Acknowledgements
The SHEBA program is funded by the Office of Naval Research High Latitude Physics program and the U.S. National Science Foundation Arctic System Science program. This work was funded under Office of Naval Research grant N00014−97−1−0765. Thanks to B. Bosworth and J. A. Richter-Menge for their capable assistance during the deployment of the mass-balance sites. We appreciate the excellent support of the crew of the des groseilliers and the SHEBA logistics team.



