INTRODUCTION
The Cretaceous deep-marine sediment succession of the Magallanes foreland basin in Southern Patagonia (51°S) provides excellent exposures for studying redox changes in sediments related to changing seawater levels. The marine sedimentary succession comprises the Upper Jurassic and Cretaceous formations Tobífera, Zapata, Punta Barrosa and Cerro Toro. The depositional environment is restricted to two basins: first, the late Jurassic to early Cretaceous Rocas Verdes back-arc basin; and later, the Magallanes retro-foreland basin (Dalziel et al., Reference Dalziel, de Wit and Palmer1974; Biddle et al., Reference Biddle, Uliana, Mitchum, Fitzgerald, Wright, Allen and Homewood1986; Wilson, Reference Wilson1991; Fildani & Hessler, Reference Fildani and Hessler2005). Tectonic loading during the closure of the Rocas Verdes Basin and obduction of its remnants caused lithospheric flexure, creating a bathyal retro-foreland basin with a foredeep filled with deep-marine sediments. The thermal evolution of the Magallanes Basin and its pattern of diagenetic, anchizonal and epizonal overprints reflects a complex metamorphic history (Süssenberger et al., Reference Süssenberger, Schmidt, Wemmer, Baumgartner and Grobéty2017).
It is generally assumed that the chlorite composition is controlled by the chemistry of the host rock, the coexisting mineral assemblage, fluid–rock interactions, the cation interchange possibility in the crystal structure and the metamorphic grade (Trincal & Lanari, Reference Trincal and Lanari2016). Di-trioctahedral and tri-trioctahedral chlorites are common constituents in the sampled low-grade metamorphic sediments and are valuable minerals in terms of their use as geothermometers (e.g. Vidal et al., Reference Vidal, Parra and Vieillard2005; Lanari et al., Reference Lanari, Wagner and Vidal2014), metamorphic facies indicators (e.g. Frey & Robinson, Reference Frey and Robinson1999) and to decipher hydrothermal alteration (e.g. Schmidt & Robinson, Reference Schmidt and Robinson1997). Mn-rich chlorite varieties (e.g. pennantite) are less widespread and their occurrence is often associated with Mn-rich deposits or the hydrothermal alteration of Mn-rich phases (Chinchilla et al., Reference Chinchilla, Arroyo, Merinero, Piña, Nieto, Ortega and Lunar2016; Ossa Ossa et al., Reference Ossa Ossa, Hofmann, Vidal, Kramers, Belyanin and Cavalazzi2016).
The concentration and distribution of Mn oxides in seawater and sediment have often been considered to be due to changes in the redox state of modern and ancient oceans and are therefore well-known elemental proxies for depositional conditions (Burdige, Reference Burdige1993; Pufahl & Fralick, Reference Pufahl and Fralick2004). Mn2+ is a soluble ion in seawater, but is thermodynamically unstable in the presence of oxygen (Bricker, Reference Bricker1965; Aller, Reference Aller1980; Burdige, Reference Burdige1993). The enrichment of Mn phases occurs in oxygenated environments leading to the precipitation of Mn oxides/oxyhydroxides (MnO2-pyrolusite, Mn3O4-hausmannite or MnOOH-manganite). The dissolution of these phases and local enrichments of Mn2+ is promoted by reducing conditions at the sediment–water interface due to, for example, the degradation of organic matter (e.g. Froelich et al., Reference Froelich, Klinkhammer, Bender, Luedtke, Heath, Cullen, Dauphin, Hammond, Hartman and Maynard1979; Nealson & Saffarini, Reference Nealson and Saffarini1994). Generally, Mn is accumulated above its crustal abundance in pelagic sediments (Murray & Irvine, Reference Murray and Irvine1985) and in sediments of continental margins.
In the present case study, we examine the chemical composition of chlorite and whole rock from low-grade metasediments of the Magallanes foreland basin in order to track changes in the depositional environment and to discriminate stratigraphic formations. The study includes chlorites affected by two distinct metamorphic events, by regional metamorphism with temperatures between 230 and 270°C (Süssenberger et al., Reference Süssenberger, Schmidt, Wemmer, Baumgartner and Grobéty2017; Süssenberger, Reference Süssenberger2018) and/or by contact metamorphism (<370°C; Süerger et al., Reference Süssenberger, Wemmer and Schmidt2018) in order to evaluate whether metamorphic events alter proxies for stratigraphic discrimination. The Mn concentrations of chlorite and whole rock may be used to decipher depositional conditions. This opens up the possibility of using the Mn composition of chlorite as a chemo-stratigraphic mapping tool in areas where lithologies are intrinsically difficult to differentiate and have been affected by low-grade metamorphism and deformation.
GEOLOGICAL SETTING
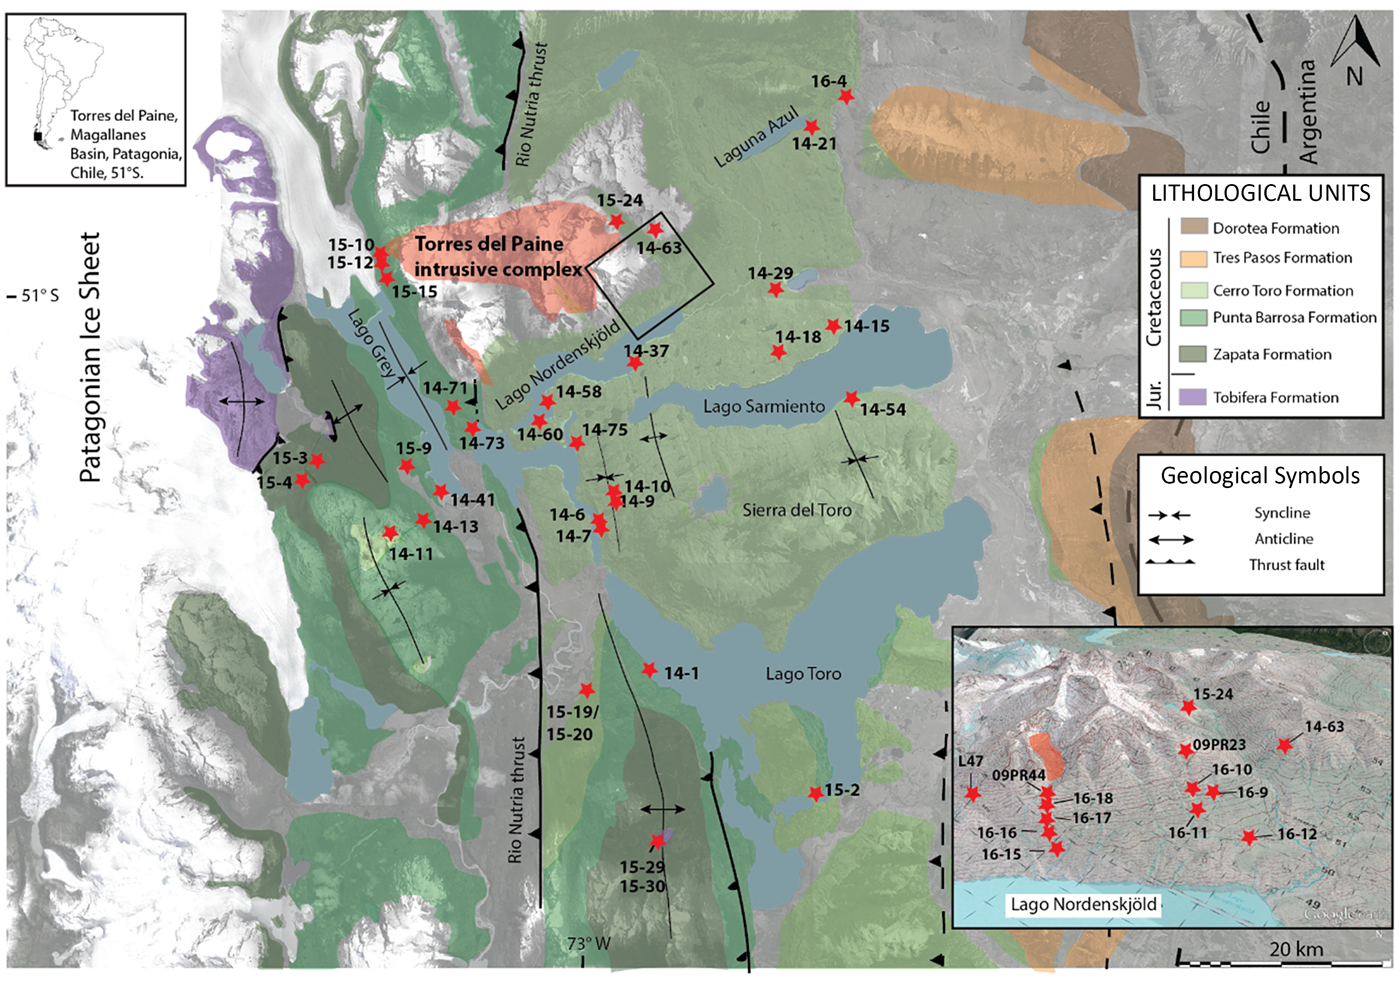
The studied sediments are part of the Magallanes foreland basin, which represents one of the thickest sediment accumulations on the South American continent (Natland et al., Reference Natland, Gonzalez, Canon and Ernst1974; Biddle et al., Reference Biddle, Uliana, Mitchum, Fitzgerald, Wright, Allen and Homewood1986; Wilson, Reference Wilson1991) (Fig. 1). The thermal evolution of the basin is characterized by a complex pattern of diagenetic, anchizonal and epizonal overprints related to burial, thrust-driven exhumation and Miocene magmatic events (Wilson, Reference Wilson1991; Fosdick et al., Reference Fosdick, Romans, Fildani, Bernhardt, Calderon and Graham2011; Leuthold et al., Reference Leuthold, Müntener, Baumgartner, Putlitz, Ovtcharova and Schaltegger2012; Süssenberger et al., Reference Süssenberger, Schmidt, Wemmer, Baumgartner and Grobéty2017). A general trend of decreasing metamorphic conditions is observed from west to east (Süssenberger et al., Reference Süssenberger, Schmidt, Wemmer, Baumgartner and Grobéty2017).
Regional geological map of the study area. Sample localities are marked by red stars. The majority of the contact metamorphic samples are located within the black square (modified from Fosdick et al., Reference Fosdick, Romans, Fildani, Bernhardt, Calderon and Graham2011; Süssenberger et al., Reference Süssenberger, Schmidt, Wemmer, Baumgartner and Grobéty2017).

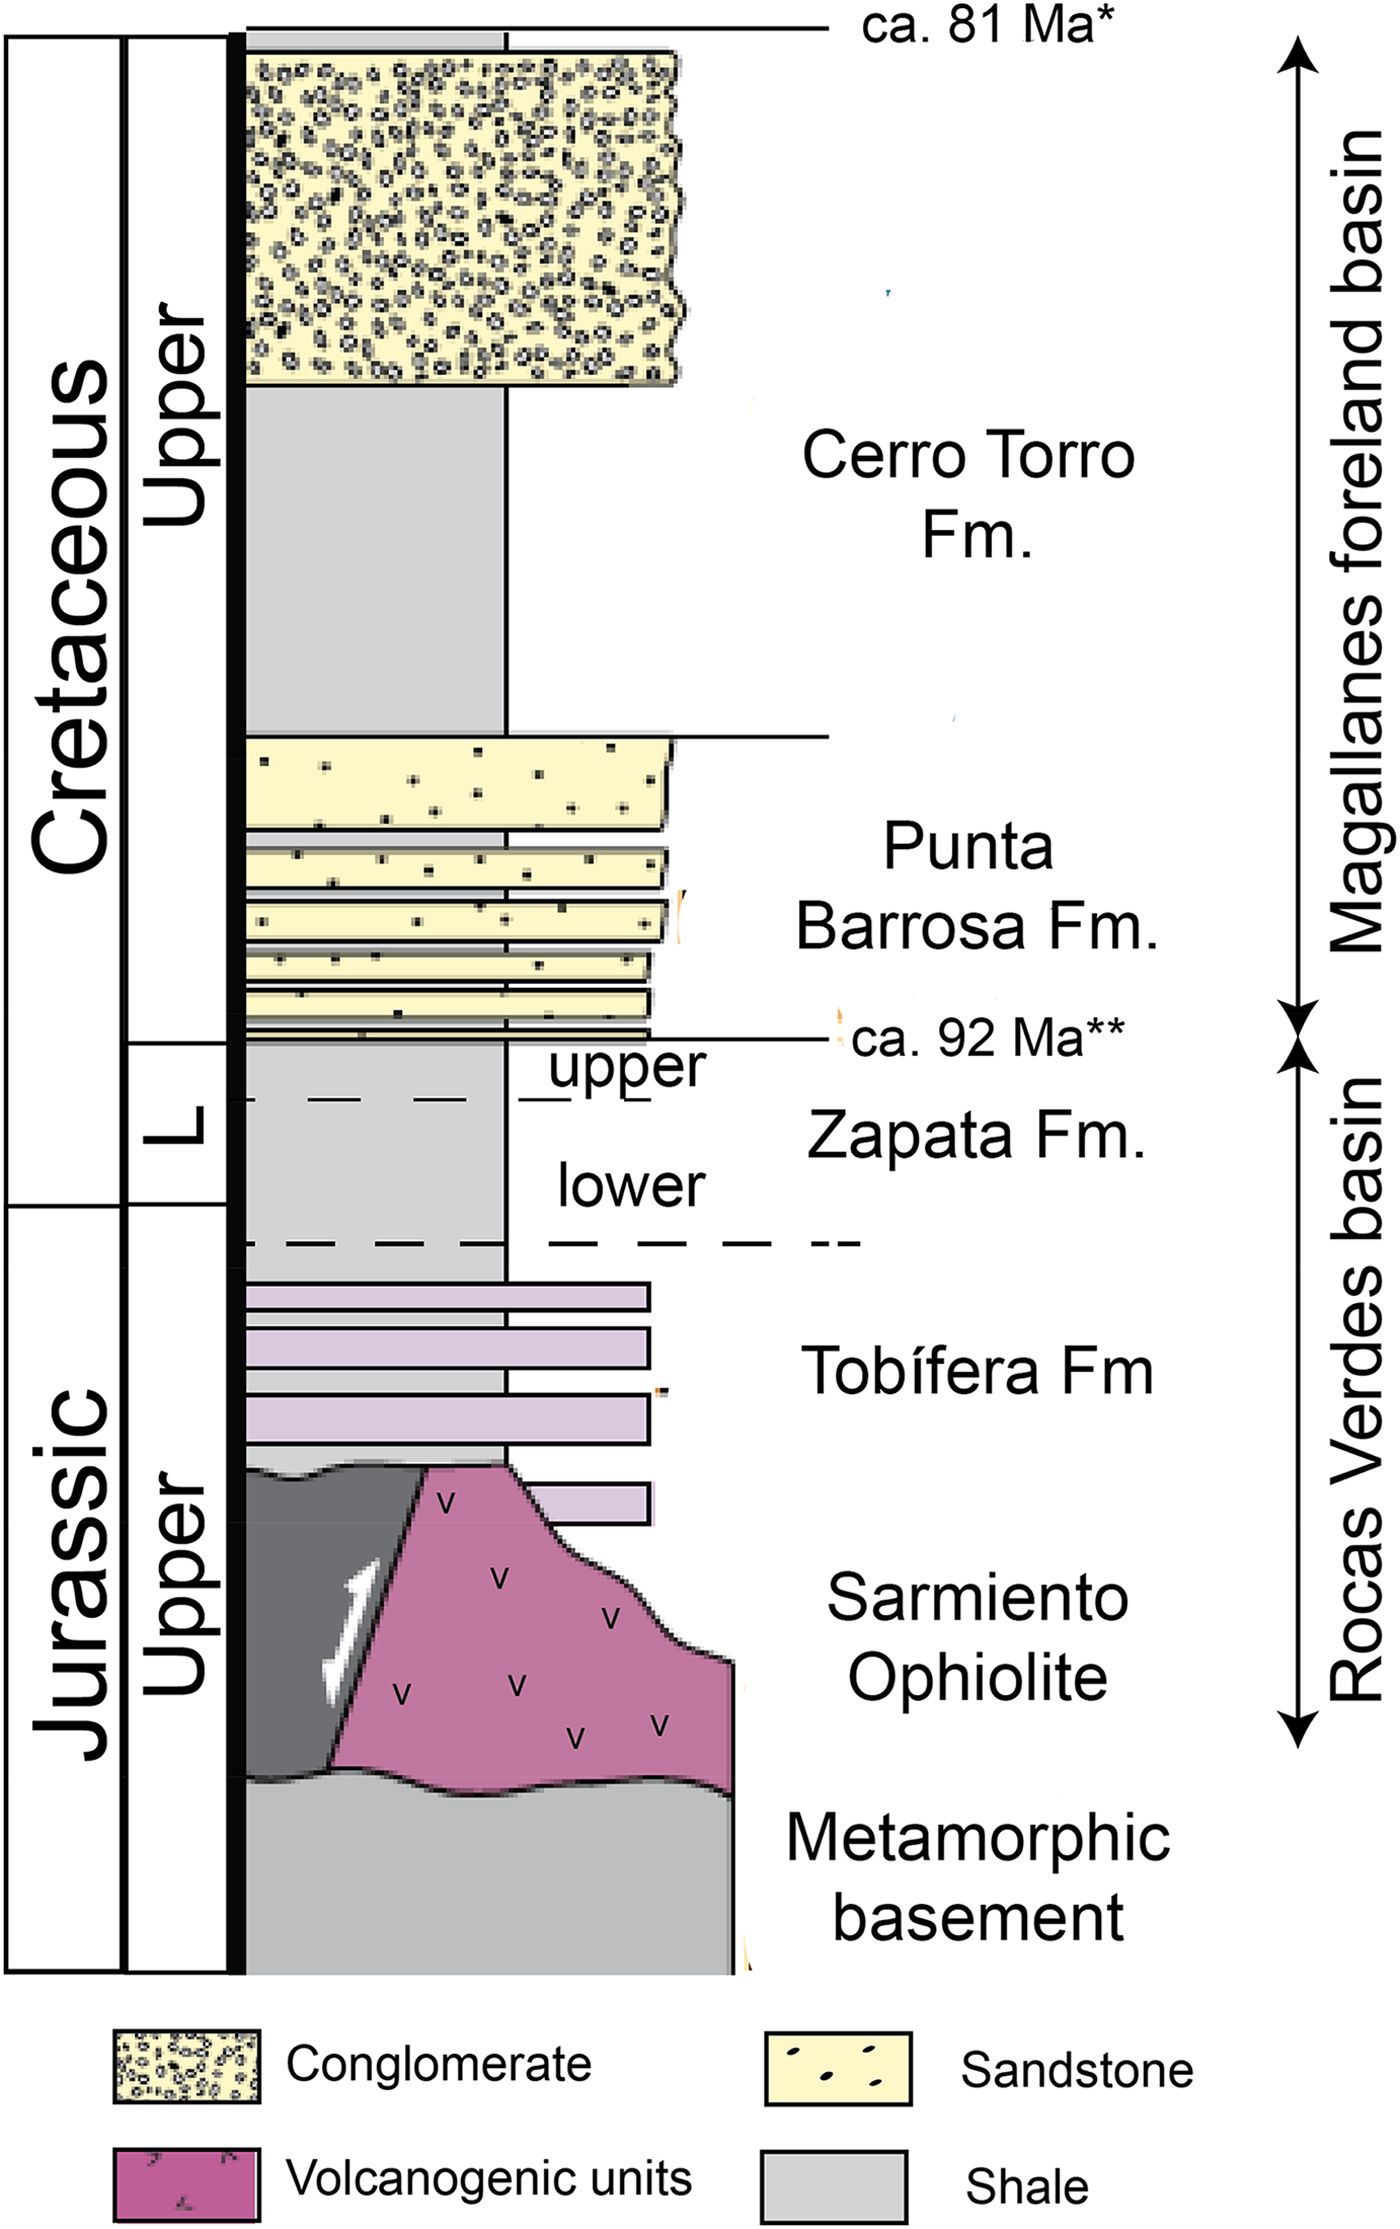
The Magallanes foreland basin was filled throughout the Cretaceous with an ~7 km thick sedimentary sequence consisting mainly of deep-marine to shallow-marine deposits (e.g. Wilson, Reference Wilson1991) (Fig. 2).
Stratigraphy of the Magallanes Basin filling units from the Upper Jurassic to the Upper Cretaceous. The overall sedimentary thickness is ~7 km. Stratigraphic-age constraints are from Bernhardt et al. (Reference Bernhardt, Jobe, Grove and Lowe2012)* and Fildani and Hessler (Reference Fildani and Hessler2005)**. Stratigraphic column modified from Daniels et al. (Reference Daniels, Auchter, Hubbard, Romans, Matthews and Stright2017) and Schwartz et al. (Reference Schwartz, Fosdick and Graham2017).

The basin configuration is strongly related to the closure of its predecessor Rocas Verdes back-arc basin and the development of the Patagonian fold-and-thrust belt (Dalziel et al., Reference Dalziel, de Wit and Palmer1974; Natland et al., Reference Natland, Gonzalez, Canon and Ernst1974; Biddle et al., Reference Biddle, Uliana, Mitchum, Fitzgerald, Wright, Allen and Homewood1986; Wilson, Reference Wilson1991). During the Middle to Upper Jurassic, southern Gondwana underwent crustal extension, which formed the Rocas Verdes Basin (Bruhn et al., Reference Bruhn, Stern and de Wit1978; Gust et al., Reference Gust, Biddle, Phelps and Uliana1985; Pankhurst et al., Reference Pankhurst, Riley, Fanning and Kelly2000). The extensional phase climaxed in the formation of quasi-oceanic crust exposed as ophiolites (Sarmiento Complex; Dalziel, Reference Dalziel1981; Pankhurst et al., Reference Pankhurst, Riley, Fanning and Kelly2000; Stern & Wit, Reference Stern and de Wit2003). The basin floor was portioned into a graben–horst system and was first filled with the Upper Jurassic Tobífera Formation, consisting predominantly of silicic volcanic rocks and mud-rich sediments in a moderately deep-marine setting, well below the storm-wave base (Gust et al., Reference Gust, Biddle, Phelps and Uliana1985; Wilson, Reference Wilson1991) (Fig. 2). The overall thickness of the Tobífera Formation is considered to be at least 1000 m (Katz, Reference Katz1963; Wilson, Reference Wilson1991). Mudstones record periodically hemipelagic sedimentation under anaerobic conditions (Wilson, Reference Wilson1991). The overlying Zapata Formation consists mainly of grey to black, mud-rich sediments that were deposited in a hemipelagic environment that was low in oxygen and at water depth of at least 2500 m (Wilson, Reference Wilson1991; Fildani & Hessler, Reference Fildani and Hessler2005). More sand-rich segments of the Zapata Formation indicate at least periodically a more proximal and bathyal depositional setting (Cecioni, Reference Cecioni1957; Cortés, Reference Cortés1964; Stinnesbeck et al., Reference Stinnesbeck, Frey, Rivas, Perez, Cartes, Soto and Lobos2014). The thickness of the Zapata Formation varies between 1000 and 1200 m (Cortés, Reference Cortés1964). Both formations, Tobífera and Zapata, are exposed in the Magallanes foreland basin and represent the obducted remnants of the former Rocas Verdes Basin (e.g. Fosdick et al., Reference Fosdick, Romans, Fildani, Bernhardt, Calderon and Graham2011). The Zapata Formation is capped by the more sand-rich Punta Barrosa Formation, which records the onset of the Magallanes foreland basin deposition (Fig. 2). The deep-water sandstones are associated with the transition from an extensional to a compressional regime with subsequent fold-and-thrust belt and foreland basin formation (Wilson, Reference Wilson1991; Fildani et al., Reference Fildani, Cope, Graham and Wooden2003; Fosdick et al., Reference Fosdick, Romans, Fildani, Bernhardt, Calderon and Graham2011). Based on biostratigraphical assemblages, a marine deposition environment with depths between 1000 and 2000 m is assumed (Natland et al., Reference Natland, Gonzalez, Canon and Ernst1974). The overlying Coniacian to Campanian Cerro Toro Formation consists mainly of hemipelagic shales and a thick conglomeratic layer (~400 m) (Fig. 2). Natland et al. (Reference Natland, Gonzalez, Canon and Ernst1974) suggested a maximum depositional depth of 2000 m. During the Upper Cretaceous, marine deposition continued under euxinic conditions (e.g. Natland et al., Reference Natland, Gonzalez, Canon and Ernst1974).
MATERIALS AND METHODS
Samples and metamorphic degree
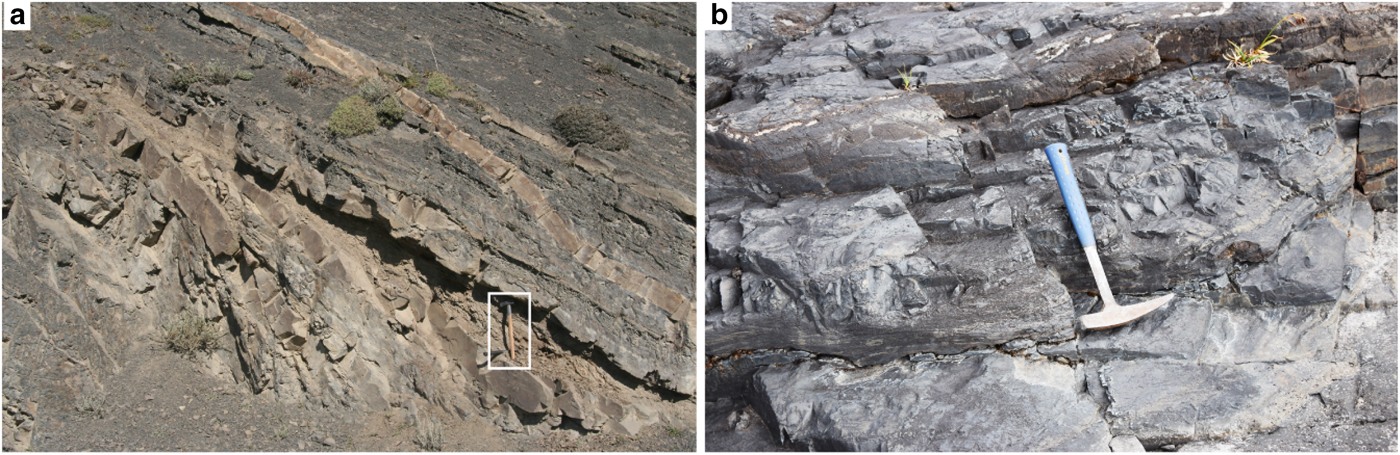
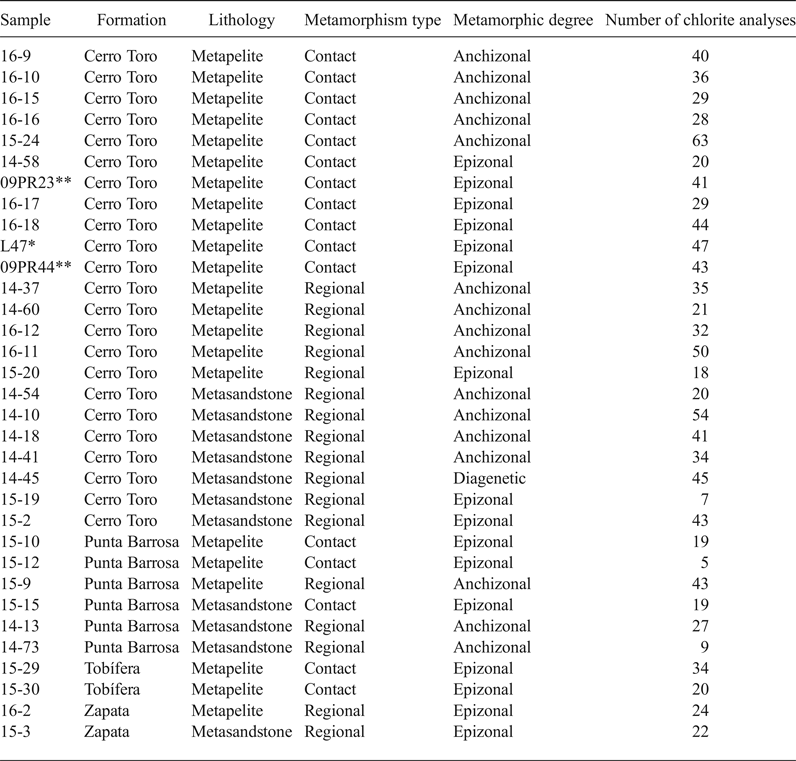
The fieldwork and sampling strategies were broadly conceived to cover the regionally outcropping Upper Jurassic and Cretaceous stratigraphic formations, two lithologies – metapelite and metasandstone – and metamorphic degrees from diagenesis to epizonal due to either contact or regional metamorphism (Fig. 3; Table 1; Table S1). Grading of metamorphism was based on Kübler index (KI) measurements by X-ray diffraction (XRD; Süssenberger et al., Reference Süssenberger, Schmidt, Wemmer, Baumgartner and Grobéty2017, Reference Süssenberger2018). The transition from low-temperature regional to contact metamorphism as well as the transition between different stratigraphic units appear to be veiled by the very fine-grained, dark lithology and are intrinsically difficult to differentiate by macroscopic or microscopic means. Generally, metasandstones are recognized by their thicker, coarse-grained, light brown layers (Fig. 3a). Metapelites occur as fine-grained, dark brownish to blackish, laminated layers (Fig. 3b).
Representative rock lithologies. (a) Metasediments of the Cerro Toro Formation. Metasandstones are recognized by their thicker, light brown layers. Metapelites occur as dark brownish to blackish, thin layers (hammer for scale is indicated by the white rectangle; hammer length is 60 cm). (b) Fine-grained metapelite of the Zapata Formation (hammer length is 28 cm).

Compilation of analysed samples, including the number of individually measured chlorite grains. *Sample from Tobler (Reference Tobler2012). **Sample from Bodner (Reference Bodner2013).

In total, 40 samples belonging to the stratigraphic units of the Tobífera, Zapata, Punta Barrosa and Cerro Toro Formations were prepared for microscopic and geochemical analyses to provide evidence for the stratigraphic discrimination. The geochemical data set comprises 1042 chlorite compositions and 40 whole-rock analyses.
Whole-rock analysis: X-ray fluorescence
The major element abundances (SiO2, TiO2, Al2O3, Fe2O3, MnO, MgO, CaO, Na2O and K2O) were determined by X-ray fluorescence (XRF) and absorption analysis on fused lithium tetraborate glass slices using a Philips PW2400 XRF spectrometer at the University of Lausanne.
Scanning electron microscopy
A JEOL JSM7001 F scanning electron microscope (SEM) equipped with the energy-dispersive X-ray spectroscopy (EDS) system JED 2300 was used at the University of Geneva. SEM was used as an imaging device to characterize the various clay mineral assemblages based on their textural intergrowth, crystal shape and size, whereas the semi-quantitative chemical composition is investigated using EDS. The semi-quantitative determination of Mn-rich phases such as clay minerals and carbonates served as a powerful tool to observe the textural relationships between Mn-bearing minerals and to track the redistribution of Mn during low-grade metamorphism.
Chlorite analysis
The individual chlorite grains of 33 samples were analysed on polished thin sections with a JEOL 8200 electron microprobe at the University of Lausanne, equipped with five automated wavelength-dispersive spectrometers (LIF, PET, TAP, LDE1 and LDE2) and operated at an acceleration voltage of 15 kV, a beam current of 15 nA and a beam diameter of 2 µm. The element abundances were determined relative to the standards forsterite (Mg), wollastonite (Si, Ca), fayalite (Fe), orthoclase (K), MnTiO3 (Mn, Ti) and jadeite (Na). Peak counting times were between 10 and 20 s and between 15 and 20 s for the background. Biased microprobe data due to sub-micrometre-scale contamination (interlayering) were anticipated by using the arbitrary division Σ[CaO,Na2O,K2O] ≤1 wt.% (e.g. Bourdelle et al., Reference Bourdelle, Parra, Beyssac, Chopin and Vidal2013) and oxide totals of 85–89% for the processed chlorite data. All analysed Fe (Fetot) was considered as Fe2+ in the chlorite formula. The formulae were calculated based on 28 oxygens and assuming an ideal anion framework of O20(OH)16. Chlorites may be described by the general formula: R 2+12−x-6yR 3+x+4y□y (Si8−xR 3+x)O20)(OH)16, where □ represents vacancies, R 2+ represents octahedral bivalent cations such as Mg2+, Fe2+, Mn2+ and Ni2+ and R 3+ represents trivalent and quadrivalent cations such as Al3+, Fe3+, Cr3+ and Ti4+ (Wiewióra & Weiss, Reference Wiewióra and Weiss1990). The tetrahedral sheet hosts Si4+, Al3+ and rarely Ti4+. According to Hålenius (Reference Hålenius1984), Mn3+ occupies the M4 site, located in the interlayer brucite sheet.
The numbers of analysed chlorites per sample are given in Table 1. The measuring strategy is confined to representative chlorite grains within each thin section including detrital, authigenic and recrystallized chlorite grains. The statistical analysis and interpretation of chlorites is based on the MnO wt.%, not differentiating between the various oxidation stages. We prefer to use MnO wt.% over Mn [atoms per formula unit, apfu] in order to be independent of the errors that might be introduced by calculating the chlorite formula.
Statistical analysis
The statistical analysis was performed with the statistic programming language R (version 3.4.0; R Core Team, 2017) using the packages ‘compositions’ (van den Boogaart & Tolosana-Delgado, Reference van den Boogaart and Tolosana-Delgado2008), ‘data.table’ (Dowle & Srinivasan, Reference Dowle and Srinivasan2017), ‘ggplot2’ (Wickham, Reference Wickham2009) and ‘ratios’ (Pospiech & Fahlbusch, Reference Pospiech and Fahlbusch2017).
To determine dependencies between geochemical data – which are expressed as concentrations – and other variables (e.g. temperature, metamorphic degree, stratigraphic formation and lithology), the concentration data or wt.% were transformed into log-ratios of concentration data. This log-ratio approach overcomes the constraints of concentrations and avoids the spurious correlations and statistical biases typical of concentration data (Aitchison, Reference Aitchison1986; Egozcue & Pawlowsky-Glahn, Reference Egozcue and Pawlowsky-Glahn2005; Buccianti et al., Reference Buccianti, Mateu-Figueras and Glahn2006; Pawlowsky-Glahn & Egozcue, Reference Pawlowsky-Glahn, Egozcue, Buccianti, Mateu-Figueras and Pawlowsky-Glahn2006; Filzmoser et al., Reference Filzmoser, Hron and Reimann2009; Buccianti & Grunsky, Reference Buccianti and Grunsky2014). Two methods of log-ratios were used for displaying the results: (1) balanced log-ratios (Egozcue & Pawlowsky-Glahn, Reference Egozcue and Pawlowsky-Glahn2005; Parent et al., Reference Parent, Parent, Egozcue, Rozane, Hernandes, Lapointe, Hébert-Gentile, Naess, Marchand, Lafond, Mattos, Barlow and Natale2013); and (2) centred log-ratios (clr; Aitchison, Reference Aitchison1986).
Balanced log-ratios give the log-ratio contrast between the geometric mean of one group of elements against the geometric mean of a second, non-overlapping group of elements of one sample. With  $g\lpar x \rpar = \root D \of {x_1 \cdot x_2 \cdots x_D} $ as the geometric mean of D elements, the distance of the geometric mean of element group r with D r elements and the element group s with D s elements is calculated by:
 $$ \ln\left( {\displaystyle{{g\left( r \right)} \over {g\left( s \right)}}} \right) = \ln\left( {\displaystyle{{\root {D_r} \of {r_1 \cdot r_2 \ldots \cdot r_{D_r}} } \over {\root {D_s} \of {s_1 \cdot s_2 \ldots \cdot s_{D_s}} }}} \right)$$
The balanced log-ratio is then given by (Egozcue & Pawlowsky-Glahn, Reference Egozcue and Pawlowsky-Glahn2005):
 $$ \left[ {r_1, \ldots ,r_{D_r} \vert s_{1, \ldots ,}s_{D_s}} \right] = \sqrt {\displaystyle{{D_r \cdot D_s} \over {D_r + D_s}}} \cdot \ln\left( {\displaystyle{{g\left( r \right)} \over {g\left( s \right)}}} \right) $$
These balanced log-ratios have the advantage of possessing Euclidean geometry, which is the basis for all multivariate analysis (Pawlowsky-Glahn & Egozcue, Reference Pawlowsky-Glahn, Egozcue, Buccianti, Mateu-Figueras and Pawlowsky-Glahn2006). Calculating with balanced log-ratios avoids, on the one hand, the biases and spurious correlations that might occur if working only with single-element concentration data. On the other hand, the balanced ratio includes more than two elements (e.g. more than simply log[Mn/Fe]), emphasizing that results are based not only on two elements, but also on two groups of elements.
For example, to analyse the difference of MnO concentration from the concentration of the elements SiO2, Al2O3, FeO and MgO between samples, the log-ratio contrast may be calculated as the balanced log-ratio:
 $$\eqalign{&\left[ {MnO|SiO_2,Al_2O_3,FeO,MgO} \right] \cr & \,\,\,\,\,\,\,\,= \sqrt {\displaystyle{4 \over 5}} \cdot \ln \left( {\displaystyle{{MnO} \over {\root 4 \of {SiO_2\cdot Al_2O_3\cdot FeO\cdot MgO} }}} \right)} $$
Centred log-ratios are used for calculating biplots. A clr is calculated by normalizing each element of a sample by the geometric mean of all elements:
 $$\lsqb {x_i^{clr}} \rsqb _{i = 1, \ldots, D} = \left[ {\ln\left( {\displaystyle{{x_i} \over {g\lpar x \rpar }}} \right)} \right]_{i = 1, \ldots, D} $$
Biplots are used to visualize variability and co-dependence between element variables of a dataset (Aitchison & Greenacre, Reference Aitchison and Greenacre2002; Greenacre, Reference Greenacre2010, Reference Greenacre2013).
The biplot (Gabriel, Reference Gabriel1971) used in this study is based on a principal component analysis (PCA) of clr-transformed element concentrations and is therefore a so-called ‘log-ratio biplot’ (Aitchison & Greenacre, Reference Aitchison and Greenacre2002). The PCA projects the clr data via an orthogonal linear transformation into a new coordinate system such that the first coordinate (Comp. 1) contains the data with the greatest variance, the second coordinate (Comp. 2) the second greatest variance and so on. Two components of the PCA (i.e. Comp. 1 and Comp. 2) are displayed in a scatter plot, called a biplot (Gabriel, Reference Gabriel1971), where samples are plotted as dots and the PCA scores as labels. In biplots based on clr-transformed data, the (clr-)scores are seldom interpretable and one should focus instead on the links between element labels, which represent the log-ratio between the respective elements. The length of a link will be proportional to the variance of the log-ratio of the two variables involved. Two orthogonal links will indicate uncorrelated data and parallel links will indicate good correlation between the log-ratios of the several pairs of elements affected (Aitchison & Greenacre, Reference Aitchison and Greenacre2002; Greenacre, Reference Greenacre2010, Reference Greenacre2013). The value of the totally explained variance proportion is a measure of how well the total variability of the data is captured by the variability they exhibit in the Comp. 2 vs. Comp. 1 scatter plot: the closer to 1, the better.
RESULTS
Petrographic observations
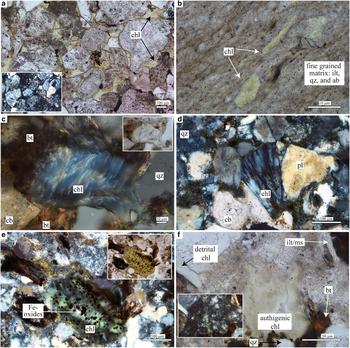
The metapelites and metasandstones show a very homogeneous mineralogical composition, as determined by XRD, optical microscopy and SEM, consisting of plagioclase (mainly albite) + illite/muscovite + chlorite + quartz ± titanite ± biotite ± apatite ± epidote ± calcite ± pyrite and ± rutile (Süssenberger et al., Reference Süssenberger, Schmidt, Wemmer, Baumgartner and Grobéty2017). Biotite is generally detrital, but may be authigenic in contact metamorphic samples (09PR23, 09PR44, 15-10 and 15-12). Some diagenetic to anchizonal samples contain mixed-layer illite–smectite and chlorite–smectite. Chlorite (mainly clinochlore or chamosite and occasionally pennantite) is the most prominent clay mineral after illite. Representative chlorites from metapelites and metasandstones are shown in Figs 4 and 5. Finely dispersed organic matter is present in various proportions.
Photomicrographs showing representative chlorites from various lithologies. (a) Interstitial chlorite in lithic metasandstone. The coarse-grained constituents consist of quartz, albite and carbonate. Plane polarized light (PPL), sample 14-10. Inset in the lower-left corner shows the same image under crossed polars (XPL). (b) Chlorite aligned along the schistosity of metapelite. The fine-grained matrix consists of albite, quartz and illite. PPL, sample 14-13. (c) Deformed chlorite grain with abnormal birefringence colours is surrounded by carbonate, biotite and quartz. XPL, sample 14-18. The inset in the upper-right corner shows the same image in PPL. (d) Authigenic chlorite growing in the pore space of a metasandstone accompanied by altered carbonate and plagioclase. XPL, sample 14-45. (e) Newly grown chlorite replacing detrital biotite. XPL, sample 14-10. The inset in the upper-right corner shows the same image in PPL. (f) Different chlorite generations: elongated detrital grain on the left and authigenic chlorite in the centre. PPL, sample 14-13. Inset in the lower-left corner shows the same image in XPL. Ab = albite; bt = biotite; cb = carbonate; chl = chlorite; ilt = illite; pl = plagioclase; qz = quartz.

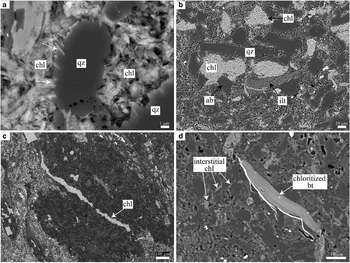
SEM images of Upper Cretaceous metapelites and metasandstones. (a) Chlorite overgrowth on a quartz grain. Dissolution and replacement of quartz by chlorite is indicated by white arrows, sample 14-38. (b) Distribution of authigenic chlorite in the matrix along with quartz, albite and illite, sample 14-73. (c) Hydrothermal chlorite vein, sample 15-30. (d) Large chloritized biotite in fine-grained matrix consisting mainly of illite, chlorite, quartz and albite. Authigenic chlorite occurs in interstitial pores, sample 14-73. Ab = albite; bt = biotite; chl = chlorite; ilt = illite; qz = quartz.

Different chlorite generations might be observed: (1) authigenic chlorite occurring in porous interspaces (Figs 4a, 4c, 4d, 5a, 5d); (2) authigenic chlorite that is finely dispersed or arranged in patches in the matrix (Figs 5a, 5b); (3) hydrothermal chlorite forming veins (Fig. 5c); (4) oriented chlorite growing on foliation planes, suggesting a synkinematic origin (Fig. 4b); and (5) recrystallized chlorite replacing detrital biotite (Figs 4e, 4f, 5d). Detrital chlorites are recognized by their elongated crystal shape, which differs conspicuously in appearance from diffuse chlorite patches occurring in the matrix (Figs. 5a, 5d), as well as by diagenetic bending and recrystallized rims (Fig. 4c).
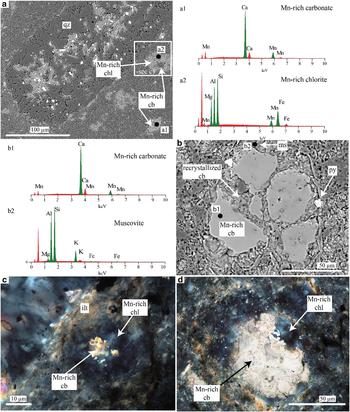
High Mn concentrations are associated with Mn-rich carbonate (Fig. 6). Chlorite is often associated with progressively dissolving carbonate (Figs 6a, 6c, 6d). Recrystallization and dissolution of Mn-rich carbonate may be observed at its rims (Fig. 6b). The Mn-rich carbonate was probably formed during sedimentation/early diagenesis and partially released Mn during later recrystallization into the matrix (Fig. 6b), where it became accessible to chlorite (Fig. 6a,c,d). Muscovite, which also occurs in contact with Mn-rich carbonate, is free of Mn (Fig. 6b2).
SEM images, EDS spectra and optical microscopy images of the metapelitic Zapata sample 15-3. (a) Mn-rich carbonate and Mn-rich chlorite in the matrix. EDS spectra of point a1 indicate an Mn-rich carbonate composition and of point a2, an Mn-rich chlorite composition. (b) Agglomeration of Mn-rich carbonate that is recrystallized at its rims. EDS spectra of point b1 indicate an Mn-rich carbonate and of point b2, an Mn-free muscovite. (c) Optical microscopy image under crossed polars (XPL) from the inset indicated in (a): fine-grained, Mn-rich chlorite growing around dissolving Mn-rich carbonate. The Mn is released from the carbonate and is subsequently incorporated into chlorite. (d) Mn-rich carbonate surrounded by fine-grained, Mn-rich chlorite. cb = carbonate; chl = chlorite; ilt = illite; ms = muscovite; py = pyrite; qz = quartz.

Whole-rock chemistry
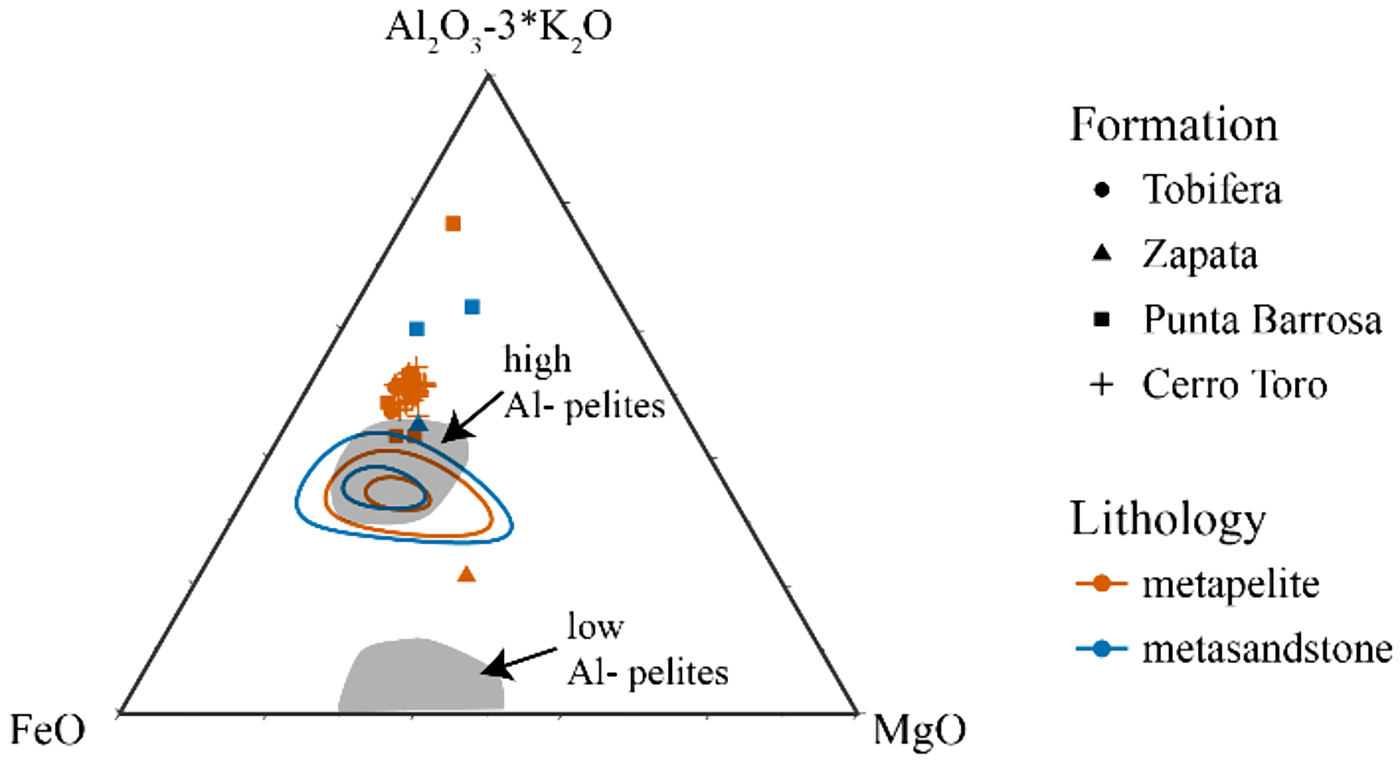
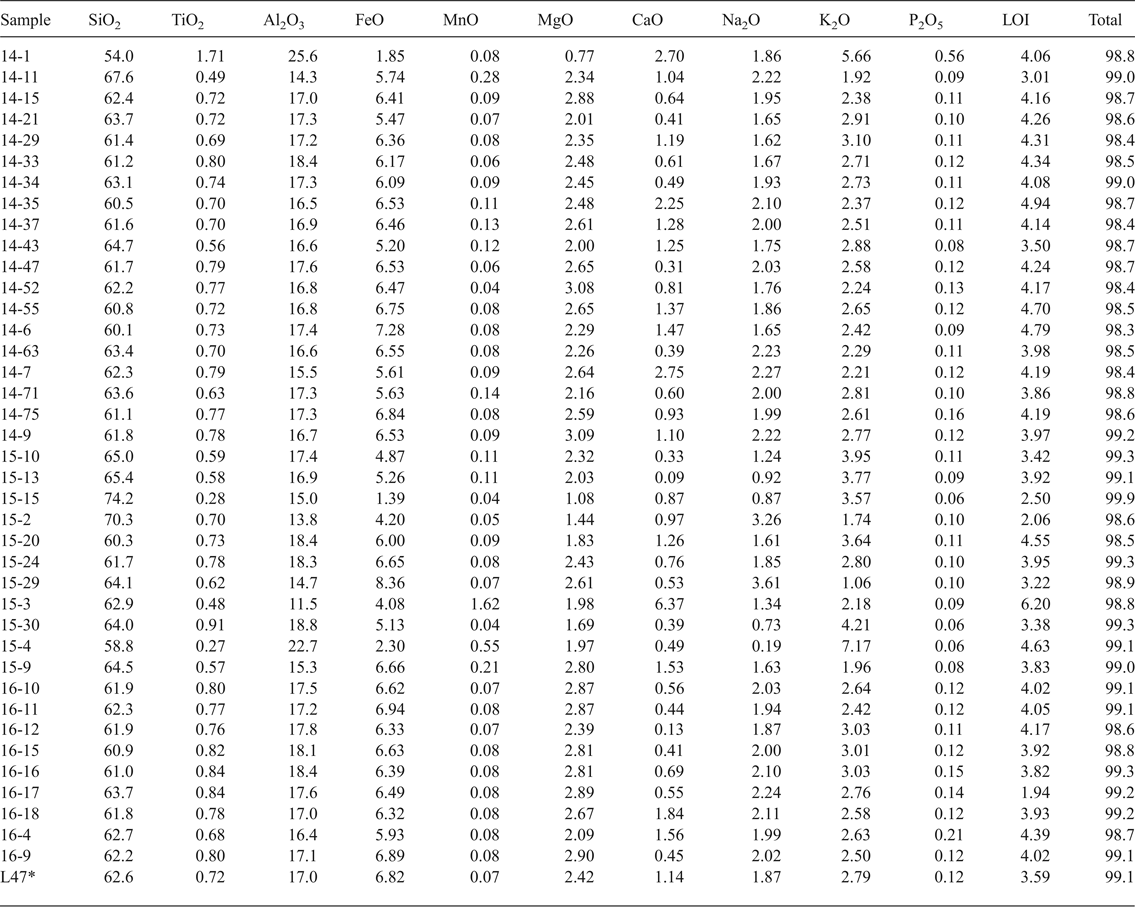
The chemical compositions of all analysed whole-rock samples are given in Table 2, Table S3 and Fig. 7. According to their major oxide compositions, the majority of the samples are classified as high-Al pelites (Fig. 7). The highest MnO contents are recorded for samples of the Zapata Formation (up to 1.6 wt.%) (Table 2). The Punta Barrosa Formation has mean MnO values of 0.11 wt.%, the Cerro Toro Formation 0.08 wt.% and the Tobífera Formation 0.05 wt.% (Table S3).
AFM diagram assuming the presence of H2O, quartz, plagioclase and muscovite in the rock (modified after Thompson & Thompson, Reference Thompson and Thompson1976). Bulk-rock samples (points) may be classified as high-Al pelites. The individual chlorite analyses are plotted within the elliptical fields: the large ellipses denote the 0.99 confidence regions and the small ellipses, the 0.5 confidence regions.

X-ray fluorescence whole-rock chemistry for the analysed samples. All data are given in wt.%. *Sample from Tobler (Reference Tobler2012).

Elevated MnO concentrations are associated with Mn-bearing carbonates as revealed by semi-quantitative Mn analysis (Figs 6a, 6b). The Mn-carbonates are considered as primary Mn-bearing phases formed during sedimentation and/or early diagenesis.
Chlorite characterization
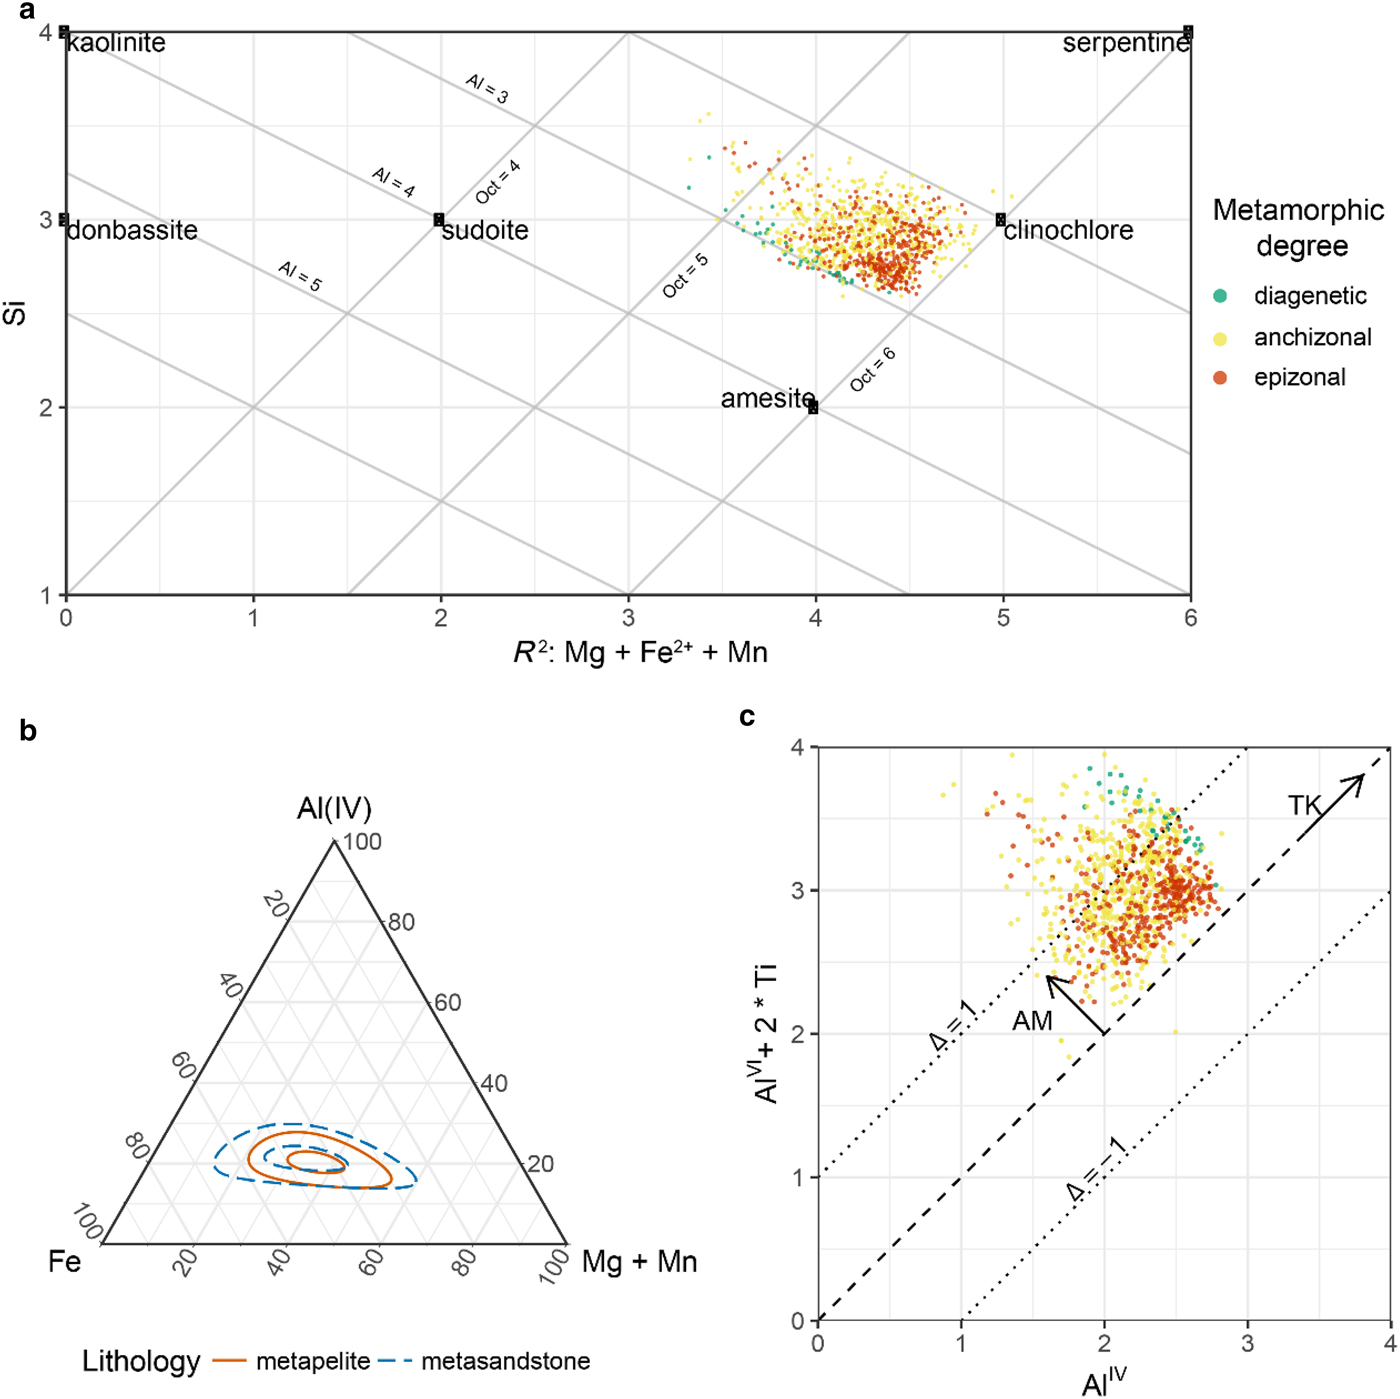
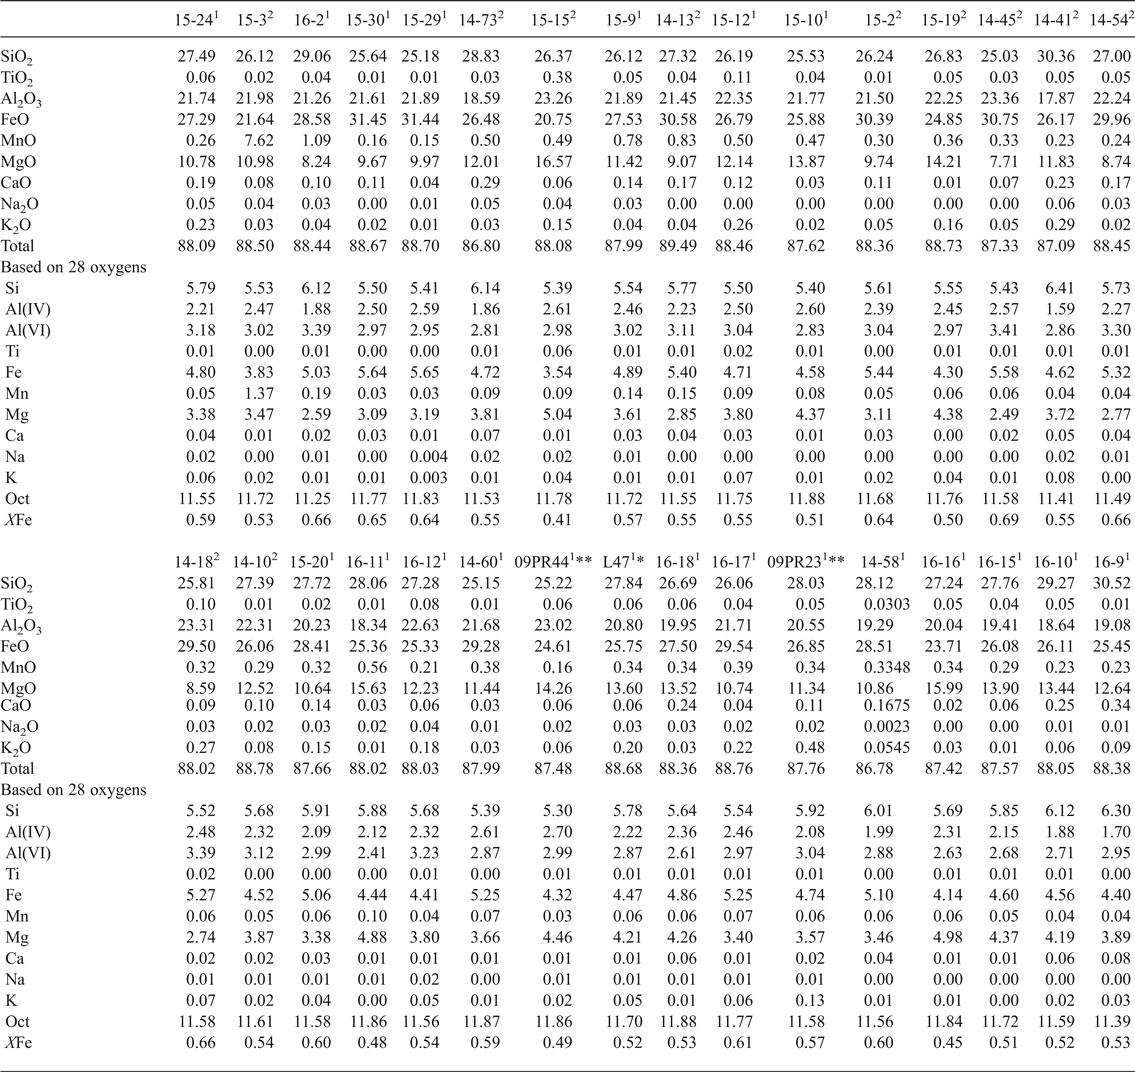
Representative chlorite analyses for each sample are given in Table 3. The mean chlorite composition per sample is given in Table S2. The majority of the chlorites may be considered as low-grade, anchizonal metamorphic chlorites with an intermediate composition between those of chamosite and clinochlore (Fig. 8).
Chlorite characterization. (a) Chemical projections for 2:1 and 1:1 minerals as proposed by Wiewióra and Weiss (Reference Wiewióra and Weiss1990). R 2+ is represented by the octahedral divalent cations Mg2+, Fe2+ and Mn2+. Chlorite formulae were calculated on the basis of 14 O atoms. (b) AlIV–Fetot–Mg + Mn ternary diagram showing the chemical composition of chlorites from metapelites and metasandstones. The large ellipses denote the 0.99 confidence regions and the small ellipses denote the 0.5 confidence regions. (c) The AlVI + 2*Ti vs. AlIV plot provides information about the extent of Tschermak (TK) and di-trioctahedral (AM) substitution in chlorites.

Representative microprobe chlorite analyses. Oxides are given in wt.%. The number of cations is based on 28 oxygens. Sample1 = metapelite; Sample2 = metasandstone. *Data from Tobler (Reference Tobler2012). **Data from Bodner (Reference Bodner2013).

The octahedral occupancies vary between 4.89 and 5.99 (mean 5.75) per half unit cell (14 oxygen atoms; Fig. 8a). Di-trioctahedral chlorites occur as minor components in mainly diagenetic to anchizonal samples. Chlorites of higher metamorphic degree generally plot closer to the trioctahedral endmember line between amesite and serpentine (Fig. 8a). The number of Si atoms ranges between 2.60 and 3.56 (mean 2.87) per half unit cell. XFe varies between 0.29 and 0.87 (mean 0.57). Chlorites formed in metasandstones tend to be slightly more chamositic compared to chlorites originating from metapelites (Fig. 8b). The chlorites demonstrate significant di-trioctahedral substitution and Tschermak substitution (Fig. 8c). A slight trend towards increasing Tschermak substitution is observed with increasing metamorphic degree, whereas the extent of di-trioctahedral substitution seems to decrease with metamorphic grade (Fig. 8c). The Mn end-member pennantite occurs in minor quantities (sample 15-3). Generally, the MnO composition varies between 0.07 and 7.62 wt.% (mean 0.48 wt.%) (Table S2). The similar ionic radii of Fe2+ (0.78 Å) and Mn2+ (0.80 Å) account for the likewise substitution for Mg2+ (0.72 Å) (ionic radii from Shannon, Reference Shannon1976).
Stratigraphic discrimination
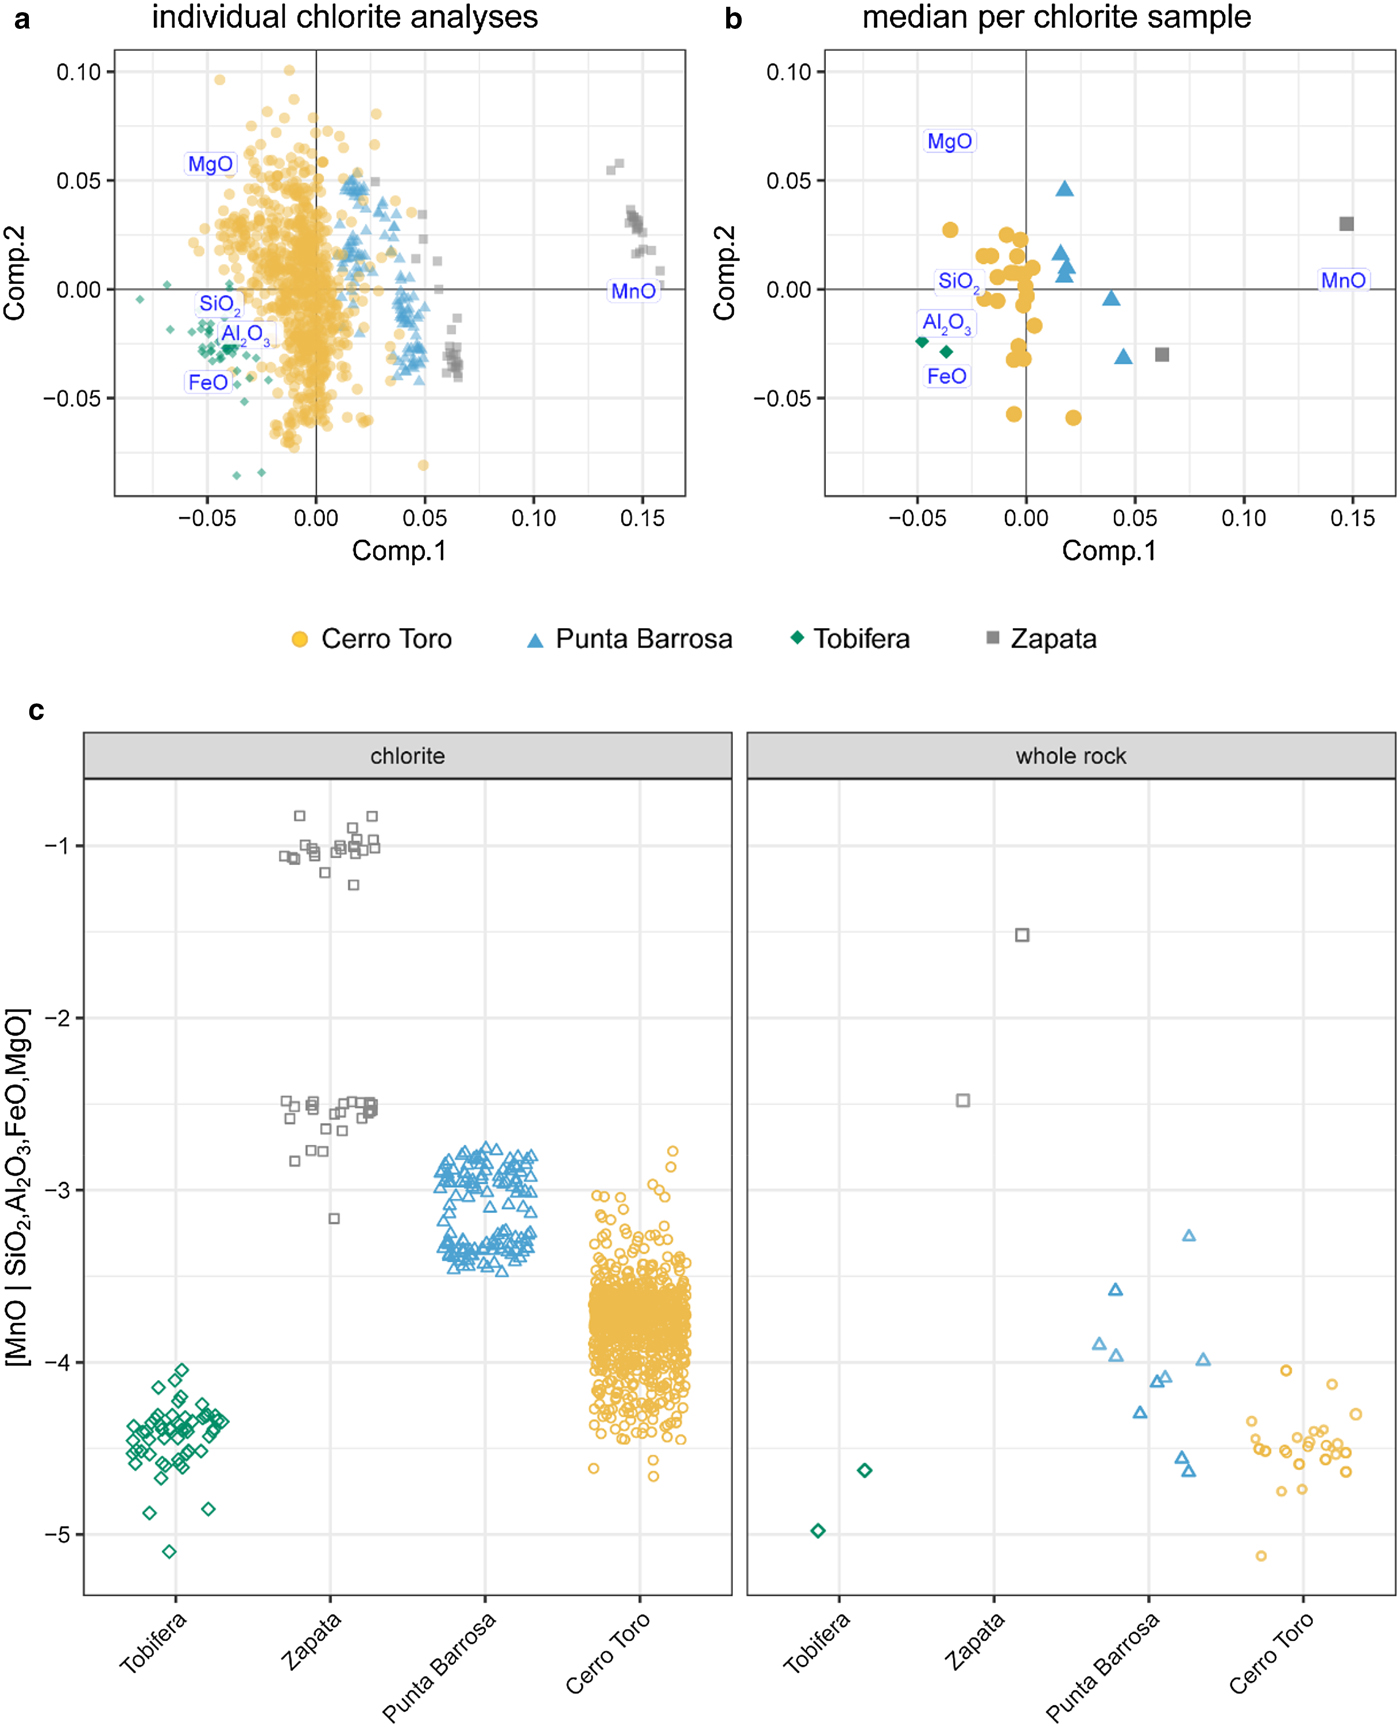
The elemental compositions of all chlorite and whole-rock analyses were tested for correlations of element ratios with lithology, stratigraphic formation, metamorphic degree and type. A clear discrimination of the stratigraphic formations of Tobífera, Zapata, Punta Barrosa and Cerro Toro is observed by employing log-ratios between MnO and any other major oxide of chlorite (i.e. SiO2, Al2O3, FeO and MgO) (Fig. 9). However, the MnO concentration in chlorite is not correlated to the concentrations of SiO2, Al2O3, FeO and MgO (Fig. 9a,b). The stratigraphic discrimination is best expressed as log(MnO/FeO) or log(MnO/Al2O3) (Fig. 9a), but can also be expressed by the balanced log-ratio of MnO to SiO2, Al2O3, FeO and MgO (i.e. [MnO|SiO2,Al2O3,FeO,MgO]; Fig. 9c). The values of [MnO|SiO2,Al2O3,FeO,MgO] give the log contrast between the MnO concentration and the concentrations of the other four element oxides and allow statistical analysis without the risk of spurious effects. A very good discrimination between the stratigraphic units can also be achieved if the balanced ratio [MnO|SiO2,Al2O3,FeO,MgO] is simplified to a two-oxide log-ratio (e.g. the log[MnO/FeO] ratio). However, picking a single oxide ratio such as the MnO/FeO risks potentially over-interpreting the role of the denominator element oxide and may also be biased by the oxidation state of Fe, for example. Recent work has shown that diagenetic chlorite may contain significant amounts of Fe3+, which affects the 2R 3+ = 3R 2+ exchange, the calculation of the structural formulae and, ultimately, the Mn content [apfu] in chlorite (e.g. Vidal et al., Reference Vidal, Parra and Vieillard2005, Reference Vidal, de Andrade, Lewin, Munoz, Parra and Pascarelli2006; Inoue et al., Reference Inoue, Meunier, Patrier-Mas, Rigault, Beaufort and Vieillard2009; Lanari et al., Reference Lanari, Wagner and Vidal2014; Trincal & Lanari, Reference Trincal and Lanari2016).
(a) Biplot of centred log-ratio (clr)-transformed element concentration data for all chlorite grains. The first coordinate (Comp. 1) contains the data with the greatest variance, while the second coordinate (Comp. 2) shows the second greatest variance. (b) Biplot of clr-transformed element concentration data for the median values per chlorite sample. The clr was calculated with the oxides SiO2, Al2O3, FeO, MgO and MnO. The ratio of MnO to any other element oxide (SiO2, Al2O3, FeO and MgO) discriminates between stratigraphic formations. The explained variance of the biplot is 0.97. (c) Comparison between the [MnO|SiO2,Al2O3,FeO,MgO] values of chlorite (left) and whole rock (right).

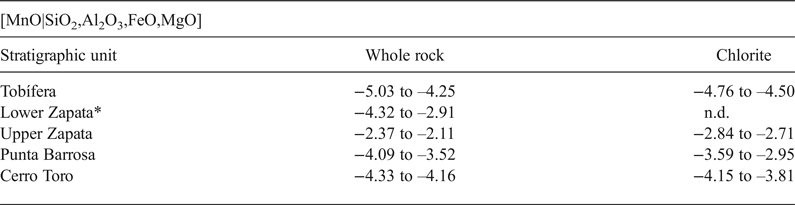
Chlorites of the Zapata Formation show the largest [MnO|SiO2,Al2O3,FeO,MgO] values, followed by chlorites of the Punta Barrosa and then Cerro Toro, with the Tobífera Formation having the lowest [MnO|SiO2,Al2O3,FeO,MgO] value (Fig. 9c; Table 4).
Limits of balanced log-ratios [MnO|SiO2,Al2O3,FeO,MgO]chlorite and [MnO|SiO2,Al2O3,FeO,MgO]whole rock for stratigraphic formations in the Magallanes Basin. n.d. = not determined. *Data from Fildani & Hessler (Reference Fildani and Hessler2005).

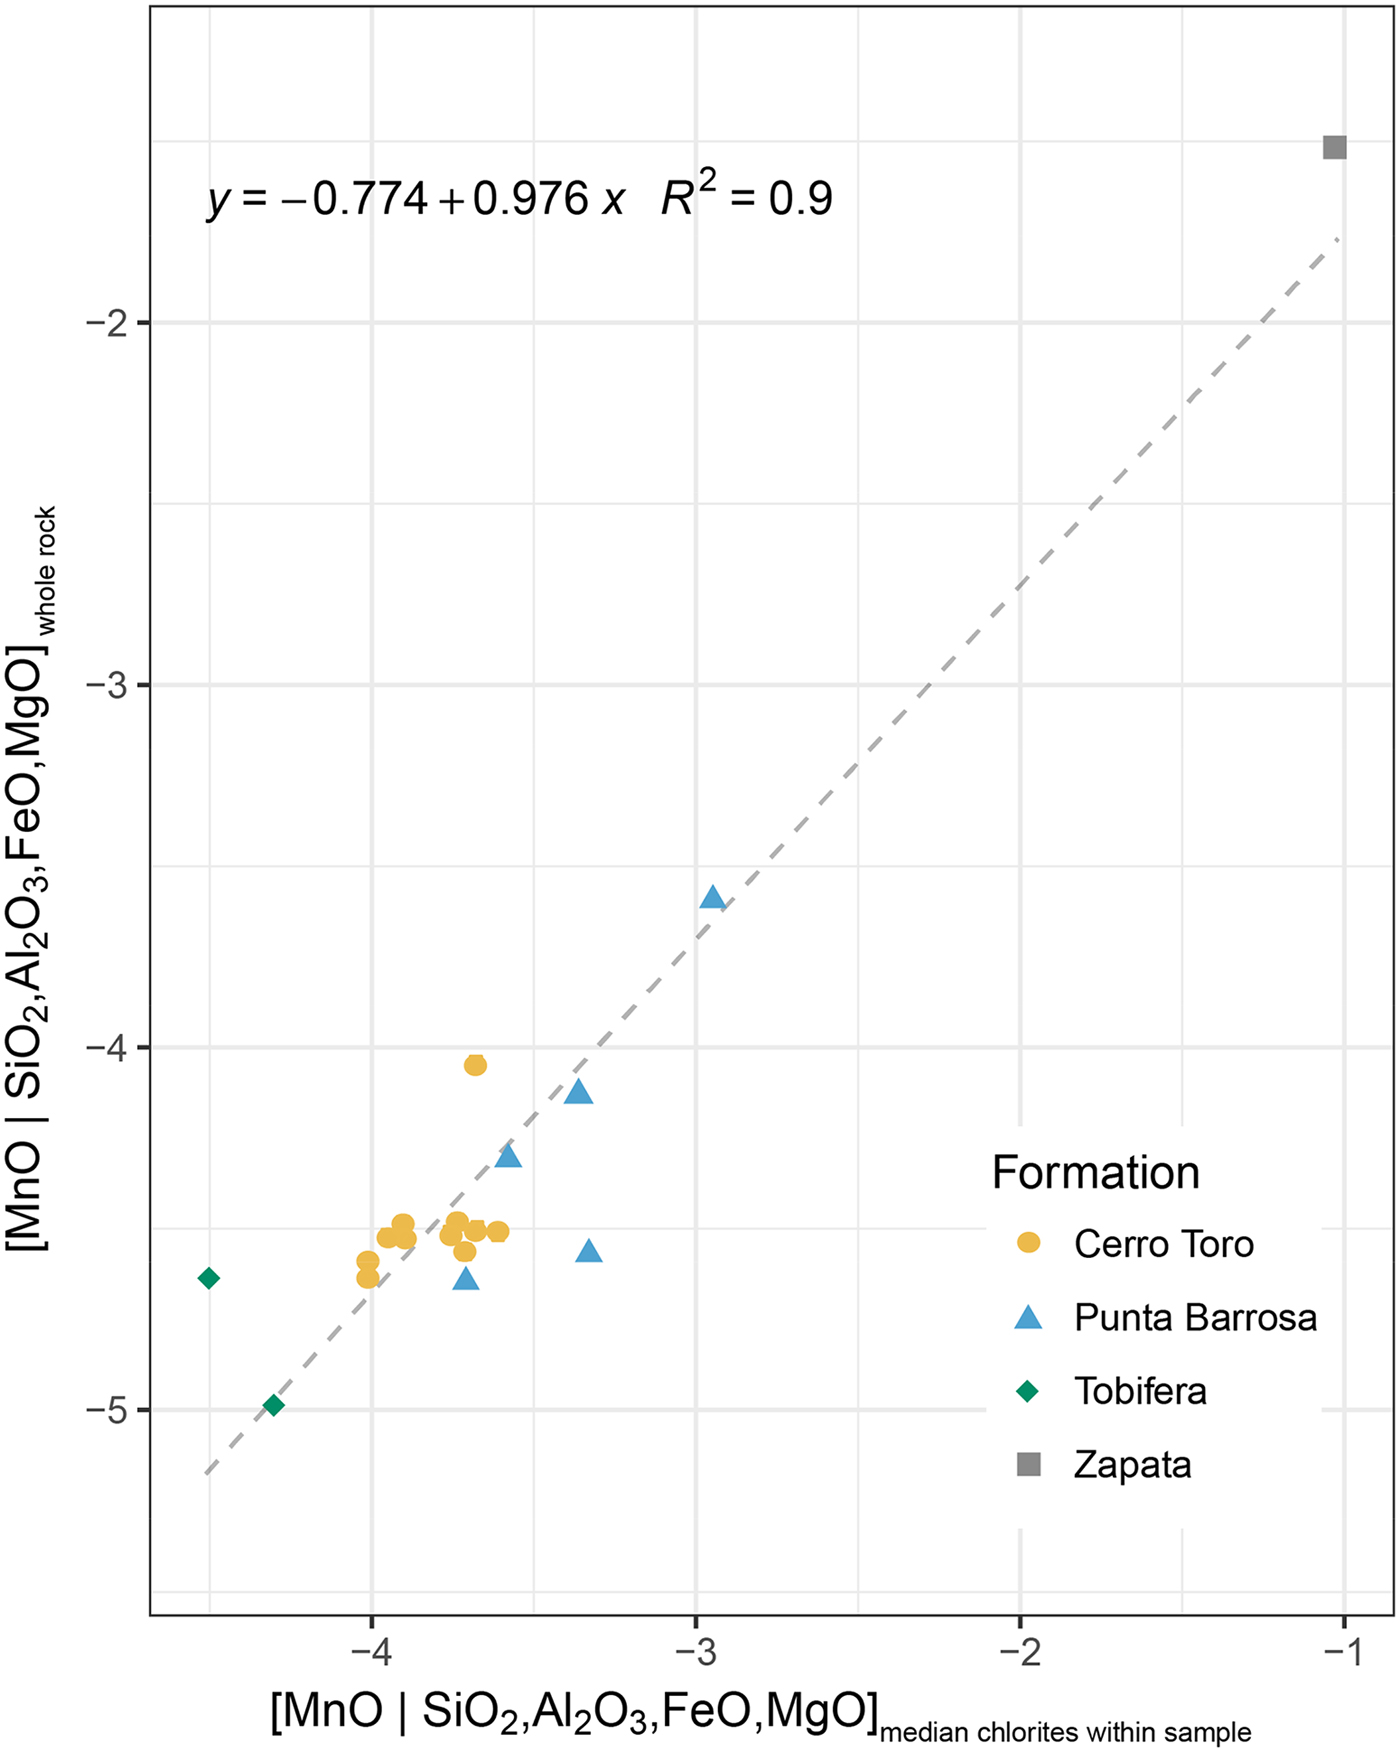
The correlation between averaged [MnO|SiO2,Al2O3,FeO,MgO] values of all chlorites within one sample vs. the [MnO|SiO2,Al2O3,FeO,MgO] value of the respective whole-rock sample is shown in Fig. 10. The good correlation between the averaged [MnO|SiO2,Al2O3,FeO,MgO]chlorite values and the respective [MnO|SiO2,Al2O3,FeO,MgO]whole rock values suggests that: (1) the MnO concentration in chlorites is dominated by the overall MnO availability in the whole rock; and (2) the discrimination of stratigraphic units may be obtained both with the MnO chlorite composition and with the MnO whole-rock composition (Fig. 10).
Scatter plot of median [MnO|SiO2,Al2O3,FeO,MgO] values of all chlorites within one sample vs. the [MnO|SiO2,Al2O3,FeO,MgO] value of the corresponding whole-rock sample.

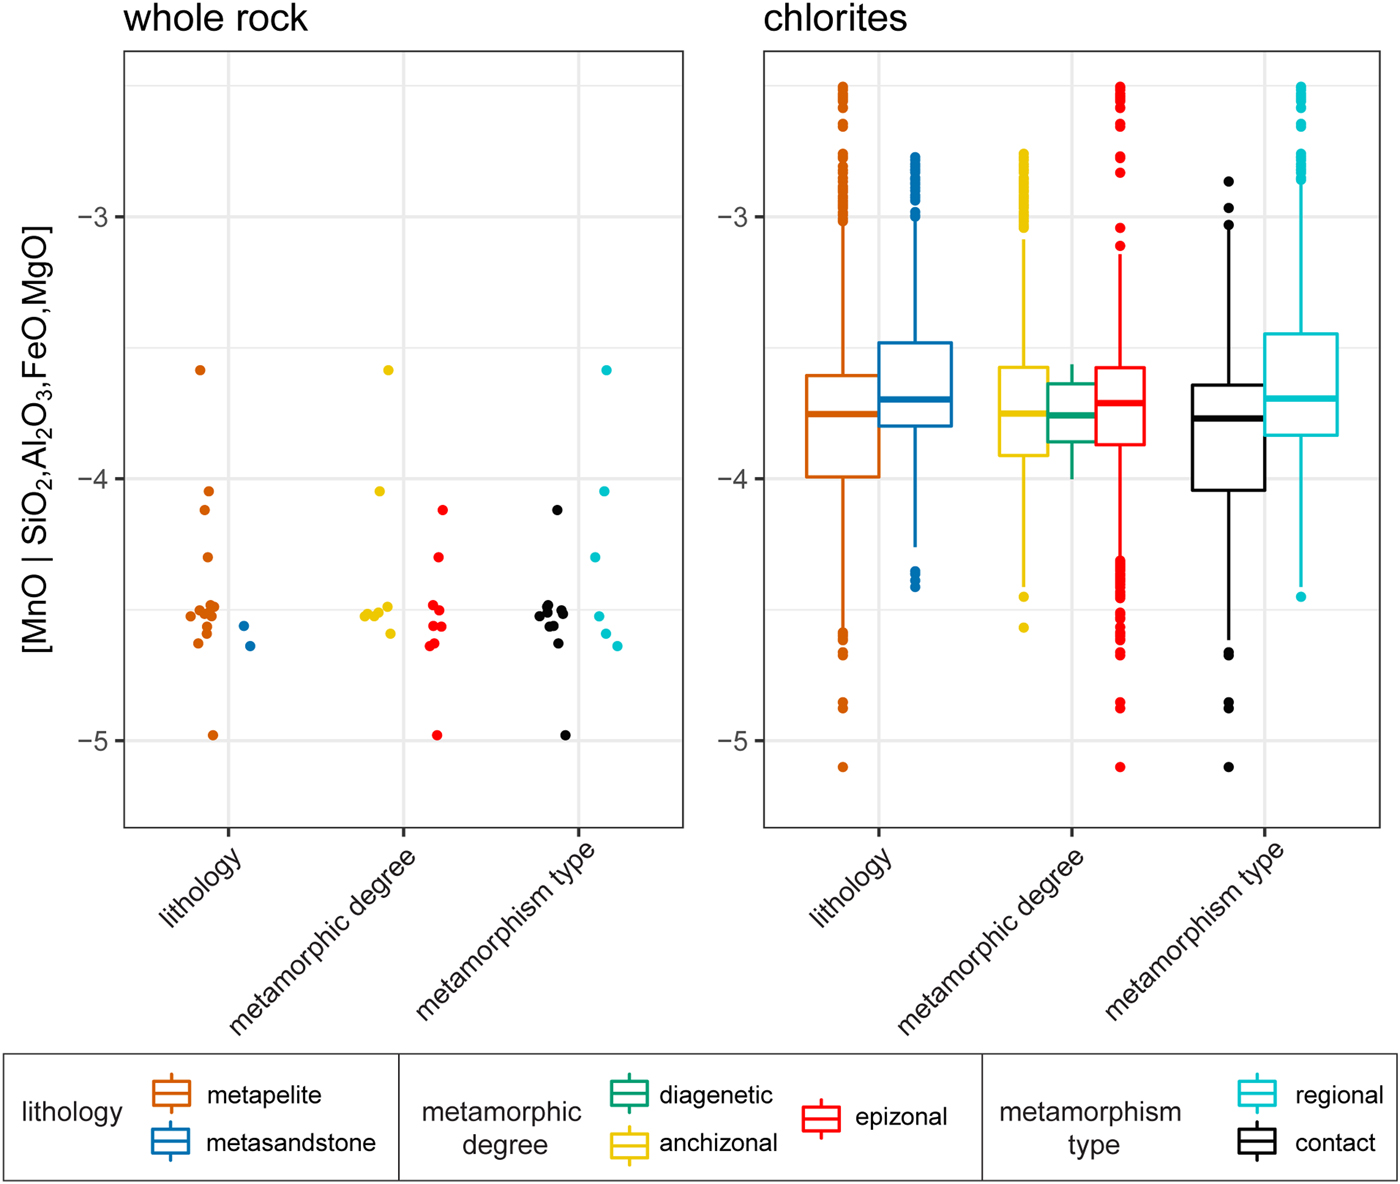
The [MnO|SiO2,Al2O3,FeO,MgO] values for whole-rock and chlorite samples do not discriminate between different categories (lithology, metamorphic degree and metamorphism type), indicating that parameters such as the degree (diagenetic, anchizonal, epizonal) and type of metamorphism (contact, regional), as well as the lithology (metapelite, metasandstone), have no significant impact on the MnO content in the samples (Fig. 11). In other words, the MnO composition of whole rock and chlorite seems to be solely the result of the depositional environment and is indicative and characteristic of the stratigraphic formation. The more negative values for [MnO|SiO2,Al2O3,FeO,MgO]whole rock relative to [MnO|SiO2,Al2O3,FeO,MgO]chlorite may be explained by higher SiO2 and Al2O3 concentrations in the whole-rock compared to the chlorite chemistry.
[MnO|SiO2,Al2O3,FeO,MgO] values of whole-rock and chlorite analyses vs. metamorphic degree (diagenetic, anchizonal, epizonal), type of metamorphism (contact, regional) and lithology (metapelite, metasandstone). The [MnO|SiO2,Al2O3,FeO,MgO] values for whole-rock and chlorite samples overlap within different categories, indicating that the MnO concentration is independent of the lithology, metamorphic degree and type of metamorphism. Due to fewer data points for whole-rock analysis, the boxplot can only be applied for chlorite samples. The median of each sample is indicated by the horizontal line in the boxplot, the lower hinge of the boxplot indicates the 25% quantile and the upper hinge indicates the 75% quantile.

DISCUSSION
The [MnO|SiO2,Al2O3,FeO,MgO] ratios in chlorite and whole rock
The [MnO|SiO2,Al2O3,FeO,MgO] ratios of chlorite and whole-rock composition are characteristic of stratigraphic formations in the Torres del Paine area and indicate that the MnO concentration is closely related to the depositional environment of a stratigraphic formation (Figs 9, 10; Table 4). This is supported by the good correlation between [MnO|SiO2,Al2O3,FeO,MgO]whole rock and [MnO|SiO2,Al2O3,FeO,MgO]chlorite (Fig. 10), suggesting that the extent of Mn uptake into chlorite is driven by the overall availability of Mn in the host rock. A host rock-controlled chlorite chemistry is known for elements such as Fe and Mg (e.g. Cathelineau & Nieva, Reference Cathelineau and Nieva1985; Kranidiotis & MacLean, Reference Kranidiotis and MacLean1987; Bevins et al., Reference Bevins, Robinson and Rowbotham1991; Xie et al., Reference Xie, Byerly and Ferrell1997; Vidal et al., Reference Vidal, Parra and Trotet2001; Bourdelle et al., Reference Bourdelle, Parra, Beyssac, Chopin and Vidal2013; Lanari et al., Reference Lanari, Wagner and Vidal2014; Bourdelle & Cathelineau, Reference Bourdelle and Cathelineau2015), but so far has not been proven for Mn. Furthermore, the analysed chlorites show homogeneous [MnO|SiO2,Al2O3,FeO,MgO] values within a sample, indicating that the majority of the investigated chlorites are probably of authigenic, early-diagenetic origin. Mn incorporation into chlorite probably occurs during early diagenesis and remains trapped up to epizonal metamorphic conditions and during recrystallization.
Detrital chlorite grains seem to equilibrate during recrystallization with the local whole-rock MnO composition, wiping out their original chemistry. Interestingly, no difference could be detected between the [MnO|SiO2,Al2O3,FeO,MgO] value in metapelites and metasandstones within the same stratigraphic formation (Fig. 11), suggesting that the elemental ratio was established at an early stage of deposition and was not affected later, despite differing physical rock properties such as grain size, porosity and enhanced fluid circulation. This finding seems to contradict previous work that reported grain size-controlled Mn contents in marine sediments, with higher Mn concentrations occurring in fine-grained sediments (Middelburg et al., Reference Middelburg, de Lange and van der Weijden1987). Chlorite and whole-rock analyses from the same stratigraphic units record statistically similar [MnO|SiO2,Al2O3,FeO,MgO] values even over regionally widely distributed locations (Fig. 1). This implies that fractionation mechanisms operated uniformly over a vast region (~100 km) and that the Mn enrichment did not result from local hydrothermal processes related to irregular Mn pore-water profiles (e.g. Gieskes, Reference Gieskes1981; Middelburg et al., Reference Middelburg, de Lange and van der Weijden1987).
Scope of application of the [MnO|SiO2,Al2O3,FeO,MgO] ratios
This study opens up the possibility of chemo-stratigraphic mapping in areas where lithologies are intrinsically difficult to differentiate by optical means and have been affected by low-grade metamorphism and deformation. The [MnO|SiO2,Al2O3,FeO,MgO] ratio in chlorite and whole-rock analyses may be used as a robust proxy to decipher the various depositional conditions at the seafloor and in bottom sediments such as water depth and oxygen level. The discrimination potential of the [MnO|SiO2,Al2O3,FeO,MgO] ratio is applicable to chlorites in metapelites and metasandstones of diagenetic to epizonal conditions. Metabasites and chlorites therein should not be employed, as their [MnO|SiO2,Al2O3,FeO,MgO] ratio does not reflect the depositional environment and their mineral assemblage is likely to host more minerals competing in Mn uptake. Within the low-grade metapelitic mineral assemblage studied here, chlorite may be considered as the main consumer of Mn and hence is only limited by the whole-rock availability of Mn. Other minerals such as muscovite do not participate in Mn uptake (Fig. 6b2). This assumption is supported by the good correlation between [MnO|SiO2,Al2O3,FeO,MgO]rock and [MnO|SiO2,Al2O3,FeO,MgO]chlorite, indicating a host rock-driven chlorite composition (Fig. 10). Metapelites and metasandstones have comparable [MnO|SiO2,Al2O3,FeO,MgO] ratios, indicating that physical rock properties are not influencing the Mn content (Fig. 11). In low-grade metamorphic rocks, MnO seems to be constant as a function of temperature and chlorite composition (i.e. does not correlate with FeO, MgO, SiO2 and Al2O3) (Figs 9a, 11). In higher-grade metamorphic rocks, Mn tends to preferentially partition into garnet (e.g. Guidotti et al., Reference Guidotti, Cheney and Henry1988) or cordierite with respect to chlorite. Under these metamorphic conditions (>370°C), the [MnO|SiO2,Al2O3,FeO,MgO] ratio in chlorites is no longer applicable for characterizing stratigraphic formations. Therefore, we propose restricting the discrimination potential of the [MnO|SiO2,Al2O3,FeO,MgO] ratio to sedimentary lithologies with maximum temperatures of greenschist-facies conditions or higher in the absence of garnet or other Mn-bearing minerals. Overall, the minimum Mn content in the whole-rock as well as in the chlorite sample is constrained by the detection limit of the analytical technique used.
The [MnO|SiO2,Al2O3,FeO,MgO] ratio as a tracer of depositional environments
In seawater, Mn occurs in the oxidation states of Mn2+, Mn3+ and Mn4+. Its precipitation and accumulation are directly linked to the redox conditions at the sediment–water interface at the time of deposition (e.g. Hem, Reference Hem1972; Calvert & Pedersen, Reference Calvert, Pedersen, Hillaire-Marcel and De Vernal2007). Thus, the Mn concentration is a well-known tool in both lake and marine sediments for tracing changes in redox conditions and providing insights into the depositional environment (e.g. Froelich et al., Reference Froelich, Klinkhammer, Bender, Luedtke, Heath, Cullen, Dauphin, Hammond, Hartman and Maynard1979; Pufahl & Fralick, Reference Pufahl and Fralick2004).
Mn2+ is normally derived from terrestrial sources and occurs as a soluble species. Because it is thermodynamically unstable in the presence of oxygen, it is oxidized via sluggish reactions to insoluble hydrated Mn3+ and Mn4+ oxyhydroxides (Bricker, Reference Bricker1965; Spencer & Brewer, Reference Spencer and Brewer1971; Calvert & Pedersen, Reference Calvert and Pedersen1996). Mn-oxyhydroxides are transported via the water column into the subsurface reducing environment of the bottom sediments, where Mn4+ is reduced to Mn2+ and is dissolved into the pore waters (Bricker, Reference Bricker1965; Spencer & Brewer, Reference Spencer and Brewer1971; Calvert & Pedersen, Reference Calvert and Pedersen1996). Dissolved Mn2+ will again diffuse upward from the sediment with reducing conditions into the overlying oxic zone, where it will re-precipitate as solid Mn phases, such as Mn-carbonate. Therefore, the occurrence of Mn-carbonate in marine sediments indicates oxygenated bottom seawater conditions, because increasing Mn concentrations can only be achieved where Mn-oxyhydroxides accumulate, probably at near-shore environments (Calvert & Pedersen, Reference Calvert and Pedersen1996). The amount of organic matter plays a pivotal role in the preservation or dissolution of Mn-oxides. Organic-rich sediments are particularly likely to establish reducing conditions as a result of O2 consumption during the degradation and remineralization of organic matter (Froelich et al., Reference Froelich, Klinkhammer, Bender, Luedtke, Heath, Cullen, Dauphin, Hammond, Hartman and Maynard1979). In stratified water columns, Mn precipitation (Mn3+ or Mn4+ oxyhydroxides) occurs in oxygen-rich layers, with dissolution occurring during the transition to anoxic environments. Mn precipitation in pelagic sediments is favoured by low levels of organic matter and terrestrial fluxes, which ensure oxygen-rich conditions even at bottom sediment levels (e.g. Krishnaswami, Reference Krishnaswami1976; Froelich et al., Reference Froelich, Klinkhammer, Bender, Luedtke, Heath, Cullen, Dauphin, Hammond, Hartman and Maynard1979; Suess, Reference Suess1980). In environments where oxic and anoxic conditions are juxtaposed, Mn phases may be constantly recycled.
In summary, the presence of Mn-carbonate in marine sediments indicates sedimentation under oxygenated conditions. The enrichment of Mn is achieved through the recycling of buried and dissolved Mn-oxyhydroxides that get adsorbed onto calcite surfaces and may precipitate as MnCO3.
Relationship between the [MnO|SiO2,Al2O3,FeO,MgO] ratio and depositional environment
The [MnO|SiO2,Al2O3,FeO,MgO] ratio is the most effective discriminant between the Upper Jurassic and Upper Cretaceous stratigraphic formations in the Magallanes foreland basin for both whole-rock and chlorite compositional data (Figs 9, 12; Table 4). The differing [MnO|SiO2,Al2O3,FeO,MgO] ratios reflect changes in the depositional environment, which will be discussed below.
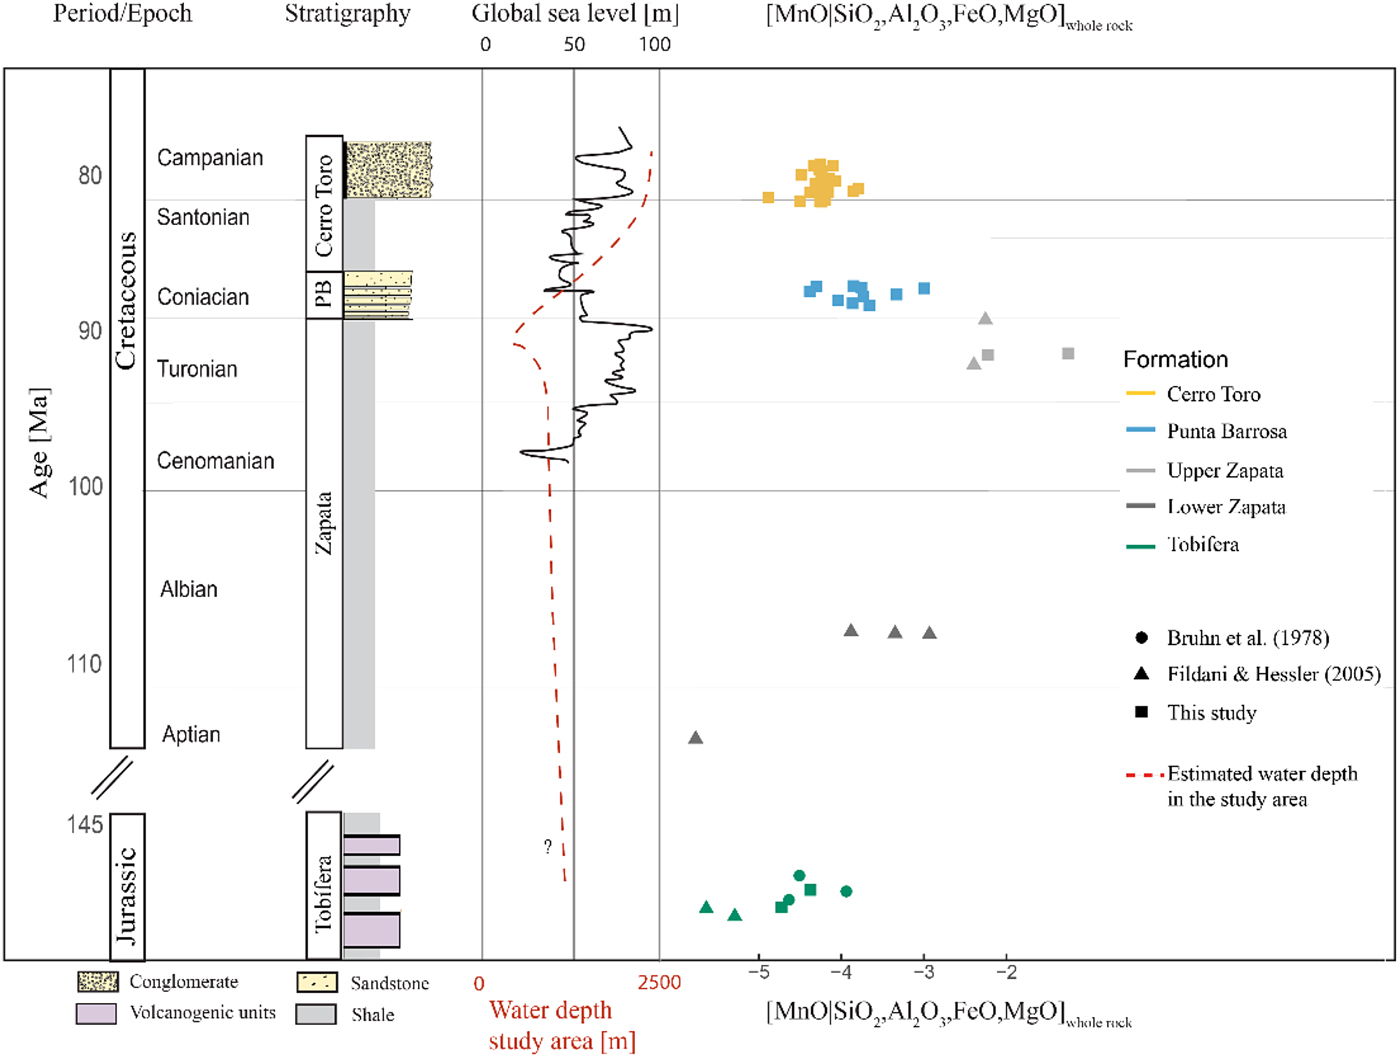
The stratigraphically lowermost Tobífera Formation consists of an inhomogeneous succession of rhyolitic ignimbrite and tuff, turbidites, dark shale and rare pillow basalt layers (e.g. Wilson, Reference Wilson1991; Fildani & Hessler, Reference Fildani and Hessler2005) (Fig. 2), making it difficult to generalize geochemical signatures. Low [MnO|SiO2,Al2O3,FeO,MgO] values that vary significantly are observed (Figs 9, 12; Table 4). Geochemical whole-rock data further south (52°S) (Bruhn et al., Reference Bruhn, Stern and de Wit1978; Fildani & Hessler, Reference Fildani and Hessler2005) fall within a similar range (Fig. 12), indicating that depositional conditions were comparable. The low [MnO|SiO2,Al2O3,FeO,MgO] values observed for the Tobífera Formation (Figs 9b, 12) should, primarily, be interpreted as the result of reducing/anaerobic conditions due to the setting in an active rift system. This is corroborated by pyritic mudstones intercalated with the tuffaceous units (Wilson, Reference Wilson1991). The large variance of the [MnO|SiO2,Al2O3,FeO,MgO] value may be caused by multiple magmatic intercalations within the succession. The transitional contact between the Tobífera and Zapata formations (e.g. Wilson, Reference Wilson1991) is also recorded by the geochemical data. Even though the Zapata Formation seems to be macroscopically homogeneous (i.e. in terms of bedding characteristics), our data and data from Fildani and Hessler (Reference Fildani and Hessler2005) indicate an increase in the Mn concentration from the lower Zapata Formation exposed in the Seno Ultima Esperanza and Peninsula Taraba (51'30°S–52°S) towards the upper Zapata Formation exposed in the northwards adjacent study area.
Balanced [MnO|SiO2,Al2O3,FeO,MgO] log-ratio of whole-rock samples for various stratigraphic formations. Decreasing negative values indicate greater water depths. The water depth curve for the study area is modelled according to the [MnO|SiO2,Al2O3,FeO,MgO] ratios. Global sea-level data are adapted from Miller et al. (Reference Miller, Kominz, Browning, Wright, Mountain, Katz, Sugarman, Cramer, Christie-Blick and Pekar2005). Stratigraphic columns are modified from Daniels et al. (Reference Daniels, Auchter, Hubbard, Romans, Matthews and Stright2017) and Schwartz et al. (Reference Schwartz, Fosdick and Graham2017). PB = Punta Barrosa Formation.

Further evidence for an inhomogeneous depositional environment within the Zapata Formation is given by geochemical data, which show that the lower Zapata Formation is distinctly richer in felsic components than the upper Zapata Formation (Fildani & Hessler, Reference Fildani and Hessler2005). Changing depositional conditions, as indicated by gradually increasing Mn concentrations, are not unusual, as the Zapata Formation was deposited throughout the Late Cretaceous, a period of ~40 m.y. (e.g. Cortés, Reference Cortés1964). Elevated MnO concentrations as observed for samples of the upper Zapata Formation (e.g. sample 15-3) originate from Mn-rich carbonate (Fig. 6). The Mn-rich carbonate was probably formed during sedimentation/early diagenesis and partially released its Mn during later recrystallization into the matrix (Fig. 6b), where it became accessible for chlorite uptake (Fig. 6a,c,d). This hypothesis is in agreement with results from Higashi et al. (Reference Higashi, Miki and Komarneni2007), who synthesized hydrothermally Mn-rich smectite by using MnCO3. Mn-rich carbonate indicates the deposition under oxygenated bottom waters and within subsurface anoxic layers typical of the shallower water depths in near-shore environments (Calvert & Pedersen, Reference Calvert and Pedersen1996). The redistribution of Mn from Mn-rich carbonate to chlorite is probably a process that occurs at an early stage of thermal evolution. The assumed water depth of ~2500 m (Wilson, Reference Wilson1991; Fildani & Hessler, Reference Fildani and Hessler2005) should be considered as a maximum water depth and is reasonable for the lower Zapata Formation exposed in the Seno Ultima Esperanza and Peninsula Taraba. The higher [MnO|SiO2,Al2O3,FeO,MgO] value as recorded for the upper Zapata Formation located in the study area probably reflects significantly shallower water depths. This supports the assumption of Cecioni (Reference Cecioni1957), Cortés (Reference Cortés1964) and Stinnesbeck et al. (Reference Stinnesbeck, Frey, Rivas, Perez, Cartes, Soto and Lobos2014) of shallower water depths and a periodically more proximal depositional setting for the Zapata Formation. A decreasing water depth from the lower Zapata towards the upper Zapata Formation is also supported by Phanerozoic global sea-level records (Miller et al., Reference Miller, Kominz, Browning, Wright, Mountain, Katz, Sugarman, Cramer, Christie-Blick and Pekar2005; Kominz et al., Reference Kominz, Browning, Miller, Sugarman, Mizintseva and Scotese2008; Daniels et al., Reference Daniels, Auchter, Hubbard, Romans, Matthews and Stright2017) (Fig. 12). The dramatically decreasing water depth at the end of the upper Zapata Formation can be explained by the closure of the Rocas Verdes Basin and the onset of fold-and-thrust belt formation (e.g. Fildani et al., Reference Fildani, Cope, Graham and Wooden2003; Fosdick et al., Reference Fosdick, Romans, Fildani, Bernhardt, Calderon and Graham2011; Süssenberger et al., Reference Süssenberger, Schmidt, Wemmer, Baumgartner and Grobéty2017). The decreasing [MnO|SiO2,Al2O3,FeO,MgO] values from the upper Zapata Formation towards the Punta Barrosa and Cerro Toro Formations reflect the gradual transition towards deeper water levels and higher carbonaceous matter fluxes, resulting in an anoxic depositional environment. The increase in water depth coincides with the formation of a foredeep depositional environment due to thrust loading and flexural subsidence in the Magallanes Basin (Natland et al., Reference Natland, Gonzalez, Canon and Ernst1974; Dalziel, Reference Dalziel1981; Wilson, Reference Wilson1991; Fildani & Hessler, Reference Fildani and Hessler2005). It is suggested that the proposed water depth of 1000–2000 m for the Punta Barrosa Formation (Natland et al., Reference Natland, Gonzalez, Canon and Ernst1974) be moved towards the shallower estimate. No differences in the [MnO|SiO2,Al2O3,FeO,MgO] value were recorded between the southern Seno Ultima Esperanza District and the northern adjacent study area, suggesting that the water depth and depositional environment remained constant throughout the depositional period of the Punta Barrosa Formation. Fildani and Hessler (Reference Fildani and Hessler2005) observed significant geochemical differences between the Zapata and overlying Punta Barrosa Formations. Shales from the Zapata Formation yield lower overall ΣREE abundances, indicating a greater input of mafic components compared to the Punta Barrosa Formation. The Cerro Toro Formation displays small [MnO|SiO2,Al2O3,FeO,MgO] values, which are in good agreement with the minimum water depth of 2500 m representing the apex of deep-water sedimentation in the Magallanes Basin (Natland et al., Reference Natland, Gonzalez, Canon and Ernst1974; Fildani & Hessler, Reference Fildani and Hessler2005) (Figs 9b, 12; Table 4). The low Mn concentrations of the Punta Barrosa and Cerro Toro Formations are probably not only due to increasing water depths, but also due to higher fluxes of carbonaceous matter that established anoxic conditions at the water–sediment interface. This interpretation is confirmed by the pyrites that frequently occur in these formations (e.g. Butler & Rickard, Reference Butler and Rickard2000; Süssenberger et al., Reference Süssenberger, Schmidt, Wemmer, Baumgartner and Grobéty2017).
CONCLUSIONS
The application of statistical methods to log-ratio-transformed data of 1042 chlorite compositions and 40 whole-rock samples of diagenetic to upper greenschist facies conditions reveals the [MnO|SiO2,Al2O3,FeO,MgO] ratio as a powerful means to effectively discriminate between Cretaceous stratigraphic formations in the Magallanes Basin. The [MnO|SiO2,Al2O3,FeO,MgO] ratios of chlorite and of the whole-rock analyses can be used as robust proxies to decipher the various depositional conditions at the seafloor and in bottom sediments, such as water depth and oxygen level. Chlorites and whole-rock compositions from the same stratigraphic unit show statistically similar [MnO|SiO2,Al2O3,FeO,MgO] ratios even over regionally distributed locations, implying that the fractionation mechanism operated uniformly over a vast region. The highest [MnO|SiO2,Al2O3,FeO,MgO] values are recorded in the Zapata Formation. The Punta Barrosa, Cerro Toro and Tobífera Formations show slightly lower [MnO|SiO2,Al2O3,FeO,MgO] values. The high [MnO|SiO2,Al2O3,FeO,MgO] values at the transition between Zapata and Punta Barrosa Formations record an oxygenated, shallow-marine environment that may be linked to the closure of the Rocas Verdes Basin and the onset of fold-and-thrust belt formation. The dramatic drop in seawater level at the end of the Turonian is in agreement with the global seawater curve. The decreasing [MnO|SiO2,Al2O3,FeO,MgO] value from the upper Zapata Formation to the Cerro Toro Formation records gradually increasing water depths during the Upper Cretaceous. The deep-marine depositional environment developed in response to thrust loading and flexural subsidence, creating a foredeep in the Magallanes Basin. The MnO content in chlorite is only controlled by the host-rock chemistry and is dependent on the interplay between oxygenated bottom seawater and anoxic conditions in the sediments. The chlorite MnO content remained unchanged under low-grade metamorphic conditions. We propose to restrict the discrimination potential of the [MnO|SiO2,Al2O3,FeO,MgO] ratio to marine sedimentary lithologies having attained maximum temperatures between diagenetic and greenschist-facies conditions or higher in the absence of garnet or other Mn-bearing minerals.
ACKNOWLEDGMENTS
This project (200021-149232) was granted to Susanne Schmidt by the Swiss National Science Foundation and is part of the PhD thesis of Annette Süssenberger. The authors thank Eva Hartung for microprobe support, Agathe Martignier for SEM support and Fabio Capponi for XRF analysis at the University of Geneva. They are also thankful to Sam Carmalt (University of Geneva) for reviewing the language in the manuscript. Lukas Baumgartner (University of Lausanne) is thanked for providing three contact metamorphic samples (L47, 09PR23, 09PR44). Andrea Fildani is thanked for providing GPS coordinates and sample information for the samples mentioned by Fildani & Hessler (Reference Fildani and Hessler2005). Hans Ruppert (University of Göttingen), Raimon Tolosana-Delgado (Helmholtz Zentrum for Resource Technology, Freiberg) and Klaus Wemmer (University of Göttingen) are thanked for comments and discussions that helped to improve the manuscript. The authors thank George Christidis and Sayako Inoue for the editorial handling, as well as Vincent Trincal and two anonymous reviewers for constructive comments and suggestions that helped to improve the manuscript.
SUPPLEMENTARY INFORMATION
The supplementary material for this article can be found at https://doi.org/10.1180/clm.2018.26