Introduction
Driving cessation and driver licensing legislation
Driving is an important means of transportation for older people and driving cessation is likely to decrease both mobility and safety of the former drivers, since alternative travel options are often insufficient, unattractive and less safe (Organisation for Economic Co-operation and Development 2001). Previous research has shown that driving cessation is associated with a decrease in activities outside the home (Harrison and Ragland Reference Harrison and Ragland2003; Marottoli et al. Reference Marottoli, Mendes de Leon, Glass, Williams, Cooney and Berkman2000; Rosenbloom Reference Rosenbloom2001) as well as a decrease in experienced mobility options (Peel, Westmoreland and Steinberg Reference Peel, Westmoreland and Steinberg2002; Taylor and Tripodes Reference Taylor and Tripodes2001). In addition, previous studies have found driving cessation to be associated with negative health outcomes, such as increasing depressive symptoms (Fonda, Wallace and Herzog Reference Fonda, Wallace and Herzog2001; Marottoli et al. Reference Marottoli, Mendes de Leon, Glass, Williams, Cooney, Berkman and Tinetti1997; Ragland, Satariano and McLeod Reference Ragland, Satariano and MacLeod2005), decreased life satisfaction (Harrison and Ragland Reference Harrison and Ragland2003), and declines in physical and social functioning (Edwards et al. Reference Edwards, Lunsman, Perkind, Rebok and Roth2009; Mezuk and Rebok Reference Mezuk and Rebok2008).
It has been proposed that driving cessation, unless caused by an accident or sudden change in functionality, is a gradual process where driver's self-regulation plays an important role (e.g. Dellinger et al. Reference Dellinger, Sehgal, Sleet and Barrett-Connor2001; Hakamies-Blomqvist and Wahlström Reference Hakamies-Blomqvist and Wahlström1998). That is, drivers gradually reduce and limit their driving before giving up completely. This allows the individual to adapt to changes in mobility options and to find alternatives, if available, to car driving. This is further supported by recent findings showing that older people who pre-plan their driving cessation show a relatively higher quality of life (Musselwhite and Shergold Reference Musselwhite and Shergold2013) and get their mobility needs fulfilled post driving cessation (Musselwhite Reference Musselwhite2010).
However, licence renewal policies with age-based mandatory screening that are used in many countries have been claimed to interfere with this gradual and voluntary process, making many older people stop driving, often somewhat prematurely (Hakamies-Blomqvist and Wahlström Reference Hakamies-Blomqvist and Wahlström1998; Langford and Koppel Reference Langford and Koppel2006). It has been shown that especially older women are vulnerable to renewal policies and often choose not to renew their licence, although they are still fit to drive (Hakamies-Blomqvist and Wahlström Reference Hakamies-Blomqvist and Wahlström1998; Siren, Hakamies-Blomqvist and Lindeman Reference Siren, Hakamies-Blomqvist and Lindeman2004; Siren, Haustein and Meng Reference Siren, Haustein and Meng2012; Wilkins, Stutts and Schatz Reference Wilkins, Stutts and Schatz1999). An abrupt driving cessation might result in loss of control over managing one's personal mobility and adapting to the changes. Previous research has shown that perceived control plays an important role in development of depressive symptoms post driving cessation (Windsor et al. Reference Windsor, Anstey, Butterworth, Luszcz and Andrews2007; see also Musselwhite and Shergold Reference Musselwhite and Shergold2013).
Licence renewal policies with age-based screening are not evidence-based and have thus come under heavy criticism (Desapriya, Ranatunga and Pike Reference Desapriya, Ranatunga and Pike2012; Langford and Koppel Reference Langford and Koppel2006; O'Neill Reference O'Neill2012a, Reference O'Neill2012b). Research has not been able to show that age-based screening would generate any safety benefits – in fact, quite the contrary (e.g. Hakamies-Blomqvist, Johansson and Lundberg Reference Hakamies-Blomqvist, Johansson and Lundberg1996; Siren and Meng Reference Siren, Haustein and Meng2012; Tay Reference Tay2012). In addition, it is believed that age-based screening procedures trigger premature driving cessation and consequently cause restrictions in personal mobility (Langford and Koppel Reference Langford and Koppel2006). It is, however, unclear how great an effect these policies as such may have on older people's mobility and wellbeing. That is, does having a licence renewal policy indeed make older drivers stop driving and, further, create mobility and health consequences? The earlier studies demonstrating seniors' vulnerability to these policies described somewhat older cohorts of seniors (e.g. Hakamies-Blomqvist and Wahlström Reference Hakamies-Blomqvist and Wahlström1998; Mitchell Reference Mitchell2008), and one could expect that the mobility of the new, more car-reliant cohorts may be less affected by the renewal policies (cf. Choi and Mezuk Reference Choi and Mezuk2013).
Background and aim of the present study
There is a considerable heterogeneity of licence renewal policies in Europe (Siren et al. Reference Siren, Haustein, Meng, Bell, Pokriefke, Lang, Fernandez Medina, Gabaude, Marin-Lamellet, MonterdeiBort and Strnadova2013), and the periodicity of renewal, requirement for driver assessments, the age of first assessment and the methods used in the assessment vary greatly. In Denmark, a driving licence is valid for 15 years at a time, until the driver reaches the age of 70. Thereafter, the licence needs to be renewed at the age of 70, 74, 76, 78 and 80. After the age of 80, the licence has to be renewed every year. In order to renew their licence after the age of 70 years, a person has to go through a medical check performed by a physician including a short version of the mini-mental examination (m-MMSE; cf. Folstein, Folstein and McHugh Reference Folstein, Folstein and McHugh1975) and the clock drawing test (cf. Critchley Reference Critchley1953; Shulman, Shedletsky and Silver Reference Shulman, Shedletsky and Silver1986). If the physician is undecided about the applicant's fitness to drive, the applicant undergoes a practical driving test.
The present study examines giving up the driving licence and the consequences that it has on the mobility and wellbeing of Danish seniors whose driving licence expired for the first time at the age of 70. More specifically, we investigate, first, if not renewing the licence is a transition point that abruptly affects mobility, and second, which changes in mobility patterns, unfulfilled mobility needs, and physical and psychological wellbeing can be observed over a two-year period in older drivers who either gave up or renewed their licence.
Materials and methods
The procedure
Data for this study were collected by interviewing a sample of older Danish persons at baseline in 2009 (N=1,792) and at follow-up in 2012 (N=863). The baseline interviews were conducted from November to December in 2009, and the follow-up interviews from January to February in 2012. The data were collected by means of standardised computer-assisted telephone interviews carried out by Ipsos Marketing (at the time Synovate Denmark A/S). The study was approved by the Danish Data Protection Agency (J.nr. 2009-54-0751) and the National Board of Health (J.nr. 7-505-29-1257/2) as regards processing personal data of the respondents.
For the first survey, a random sample of citizens who turned 70 between November 2009 and February 2010 (belonging to cohorts 1939 and 1940) was drawn from the Danish civil registration system. Because the group not intending to renew their licence in 2009 was small, in the second survey they were contacted first in order to achieve the necessary number of participants needed for comparing those who did renew their licence and those who did not. The rest of the sample at follow-up was collected randomly among those who participated in 2009. Both times the target population received a letter announcing the survey.
Altogether, 1,792 interviews were conducted in 2009 and 863 in 2012. After correcting for telephone/address errors, people who were unable to be interviewed due to language barriers or illness, and people who were not contacted because the number of intended interviews had already been achieved, the overall response rate was 70 per cent (15% refusals, 15% not reached) in 2009 and 77 per cent in 2012 (20% refusals, 4% not reached).
Measures
The standardised interviews were based on an ad hoc questionnaire. The interviews took an average of 25 minutes to complete. In the following section, the parts of the questionnaire which are analysed in the present article are described in detail.
Background information
This included gender, education, family status (married/living with a partner, single, widowed) and personal income. In addition, the participants were asked if they intended to renew their driving licence when turning 70 years old.
Health and wellbeing
Participants were asked to rate their overall health on a four-point rating scale (excellent, good, fair or poor). As an objective measure of health status, the participants were presented with a list of 20 symptoms and illnesses and asked to indicate whether they suffered from these as confirmed by a physician. This list was derived from previous studies with a similar setting and subjects (e.g. Siren, Hakamies-Blomqvist and Lindeman Reference Siren, Hakamies-Blomqvist and Lindeman2004). Because only some of the illnesses and symptoms impair the ability to drive, illnesses and symptoms were further classified into three categories: illnesses impairing driving ability (cataract or glaucoma, stroke or brain infarction, dementia and short-term unconsciousness), illnesses possibly impairing driving ability (chest pain, vertigo, heart defect, diabetes, heart infarction, Parkinson's disease and epilepsy) and illnesses not impairing driving ability (pain in joints, high blood pressure, blood circulation problems in legs or feet, lung diseases, cancer, hyperthyroid or hypothyroid disease, anaemia and vitamin deficit). The categories were based on the work by Janke (Reference Janke1994).
In addition, individual wellbeing was measured by the CES-D depression scale (e.g. Radloff Reference Radloff1977) and the Pearlin mastery scale (Pearlin and Schooler Reference Pearlin and Schooler1978). The CES-D scale is a short self-report scale designed to measure depressive symptomatology in the general population. The Pearlin mastery scale measures the extent to which a person perceives her/himself to be in control of events and ongoing situations. Both scales showed acceptable internal consistencies (Cronbach's alpha) at both survey times (CES-D depression scale: α (2009)=0.67; α (2012)=0.68; Pearlin mastery scale α (2009)=0.79; α (2012)=0.77).
Modal choices and transport patterns
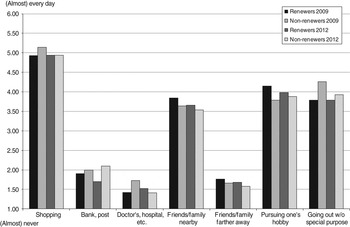
These were assessed by participants' specifications about different everyday activities (see Figure 1 for the list of activities). Individuals were asked about activity frequency (using a six-point scale from [almost] never to [almost] everyday) and the most common mode of transport for each activity (by car as driver; by car as passenger; by public transport; by taxi; by motorbike; cycling; walking; by plane (only for some activities); by other modes of transport). To cover the respondents' unmet travel needs, we used a set of questions that have been used in previous studies to obtain information on unmet/uncovered transport needs (Hjorthol Reference Hjorthol2012), unfulfilled travel needs (Siren and Hakamies-Blomqvist Reference Siren and Hakamies-Blomqvist2004) or unfulfilled activity wishes (Scheiner Reference Scheiner2006). The respondents were asked ‘if there were no barriers, would you leave home more often to pursue the following activities’ (a lot more often; somewhat more often; not more often; see Figure 1 for the list of activities). The interviewer was instructed to elaborate ‘barriers’ as physical impediments, lack of transport or transport costs.
Activity frequency for renewers and non-renewers, 2009 and 2012.

Dependency on others
This was assessed by asking how dependent the participants were on other people for their transportation when leaving home (using a four-point scale: not at all; only a little; to some degree; to a high degree).
Respondents
In this paper, the focus is on respondents who took part in both surveys. This group (N=863) consisted of 456 women (52.8%) and 407 men (47.2%), aged 71 (75.0%) and 72 (25.0%) in 2012. Most of them had a spouse (72.0% were married or co-habitating), while 17.3 per cent were widowed and 10.8 per cent single. Almost all respondents were retired (96.1%). The average personal annual income was approximately €25,600. Regarding education, 27.4 per cent had a basic school education, whereas 26.2 per cent had a (medium or long-cycle) higher education. The sample was representative in terms of gender and percentage of widowed persons. However, the income was somewhat below average, whereas the educational level of the sample was above average. The lower income might be due to a high number of missing values regarding income (32.4%). It is possible that especially people with higher incomes refused to answer this question. The higher education status of the sample is probably due to a higher willingness to participate among people with higher education.
People who took part in both surveys did not differ significantly from people who only took part in the first survey with regard to all background variables described earlier. They also did not differ significantly with regard to their health status.
Of the 771 respondents who reported being licensed in the first survey, 80 people (10.4%) did not renew their licence (‘non-renewers’) and 691 (89.6%) did (‘renewers’). The majority of non-renewers (75%, N=60) intended not to renew the licence before they turned 70, 19% (N=15) intended to renew and 6% (N=5) were undecided. Any possible sub-groups of non-renewers were too small to be distinguished, and further, it is unknown whether those who intended to renew but finally did not changed their mind or failed the medical examination. Non-renewers and renewers will be compared according to their demographics, health and wellbeing, dependency on others, travel patterns and unmet mobility needs before and after renewal.
Analysis
To test whether renewers differed significantly from non-renewers with regard to demographics, health-related variables, attitude and behaviour, Pearson's χ2 test, Mann-Whitney U-test and t-tests for independent samples were used as appropriate. To test for differences within the groups of renewers or non-renewers comparing 2009 and 2012 data, McNemar's test, Wilcoxon test and t-tests for related samples were used. Finally, a simultaneous linear regression analysis was conducted to test whether not renewing the licence had a significant impact on unmet mobility needs, when socio-demographic and health variables were controlled for.
Results
Demographics of renewers and non-renewers
There was a significant gender difference with regard to renewing the licence or not, χ2 (1, 771)=29.49, p<0.001. While 62 out of the 80 non-renewers were women (77.5%), the gender distribution among renewers was more balanced (45.4% women). Further, it was more likely for people who lived together with a partner to renew the licence (92.6% renewed) than for those who were single (75.7%) or widowed (82.9%), χ2 (2, 771)=26.17, p<0.001. The percentage of people who renewed the licence was further higher outside the city of Copenhagen (90.3%) than within (70.4%), χ2 (1, 771)=11.15, p<0.001, probably because of the higher car dependency outside the capital and the better infrastructural alternatives within. By contrast, there was no significant difference between people with different forms of education with regard to the likelihood of renewing the licence or not, χ2 (6, 769)=7.67, p>0.10. Finally, people who renewed the licence had a higher average income, t(652)=2.89, p<0.05, which was, however, partly due to the lower average income of women who were less likely to renew the licence than men. In the sub-samples of men/women the income differences were not significant.
Health, wellbeing and dependency on others
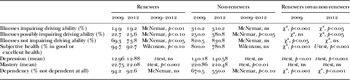
With regard to all health-related variables – except for mastery – non-renewers differed from renewers by having poorer health both in 2009 and 2012. As Table 1 shows, most of the differences are statistically significant. With regard to mastery, the groups did not differ significantly from each other but showed a similar significant decline from 2009 to 2012. Also in the other health variables there was a decline from 2009 to 2012 in both groups, but not all of these differences are statistically significant (see Table 1). Overall, the differences in health and wellbeing seem to be a cause rather than an effect of driving cessation. One exception is dependency on others for transport, which tendentiously declines in the group of non-renewers (p=0.52). Regarding this variable we find the greatest difference between renewers and non-renewers at both survey times, with a much higher percentage of non-renewers being dependent on others already before, but especially after not renewing the licence. It is, however, unclear to what extent the respondents experienced being dependent on others as something negative. Mastery and dependency on others were only weakly, although significantly, correlated (baseline: r=0.11, p<0.001; follow-up: r=0.12, p<0.001), indicating that the respondents to a large degree did not experience dependency on others as loss of control.
Health and dependency variables for renewers and non-renewers, 2009 and 2012

Significance levels: Because of the small sample size (especially in the group of non-renewers), results at the significance level of 10 per cent are also reported. ns: not significant.
Travel patterns
For each everyday activity, the respondents indicated how often they conducted these. As Figure 1 illustrates, neither the differences between renewers and non-renewers nor the changes over time within the groups are very pronounced. Yet some statistically significant differences can be observed.
In 2009, non-renewers went shopping more often than renewers, U=23,700.5, p<0.05, travelled more often in relation to health care, U=23,672.5, p<0.01, and went out more often without a special purpose, U=23,838.5, p<0.05. In 2012, the non-renewers travelled less often in relation to running errands to the bank, post office and so on, U=21,681.5, p<0.001. For renewers, the frequencies in relation to running errands to the bank, post office and so on (Wilcoxon: Z=−4.21, p<0.001), pursuing one's hobbies (Z=−2.57, p<0.01), and visiting friends nearby (Z=−3.71, p<0.001) and farther away (Z=−2.18, p<0.05) declined significantly from 2009 to 2012. We found comparable decreases in activities for the group of non-renewers, but these did not reach the level of significance, probably due to the smaller sample size. In the case of travelling in relation to health care, the renewers' frequency increased (coming from a lower level; Z=−22.18, p<0.001), whereas non-renewers' frequency slightly decreased (Z=−2.36, p<0.05).
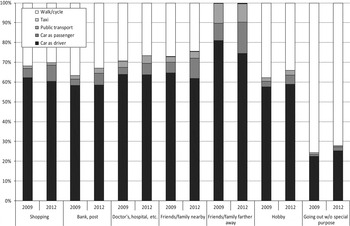
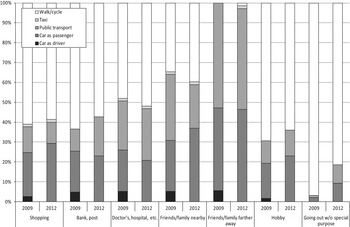
The groups differed significantly in their use of transport modes both in 2009 and 2012. The renewers drove a car more often as the main transport mode, while non-renewers only rarely did so but travelled in the car as a passenger, used public transport, walked or cycled, as Figures 2 and 3 illustrate. The differences between the groups in terms of modal choice are even more pronounced in 2012. The differences between the groups were significant for all activities (p<0.001).
Main transport modes for renewers, 2009 and 2012.

Main transport modes for non-renewers, 2009 and 2012.

The changes in mode choice from 2009 to 2012 were rather small within the groups. The only clear pattern is an increase in car use as passengers in both groups. This change is more marked in the group that is not licensed to drive anymore. However, also for renewers the difference in mode choice (‘car as driver’ versus ‘car passenger’ versus ‘other modes’) between 2009 and 2012 became significant in four out of seven purposes. With regard to going to the post office or bank, people used the car more often as a passenger in 2012, especially at the expense of walking (McNemar test: χ2 (3, 371)=14.67, p<0.01), with regard to family/friends farther away at the expense of driving (χ2 (3, 609)=17.96, p<0.001), and with regard to shopping (χ2 (3, 674)=10.60, p<0.05) and visiting family and friends nearby (χ2 (3, 667)=14.90, p<0.01) at the expense of both walking and driving (see also Figure 3).
Unmet mobility needs
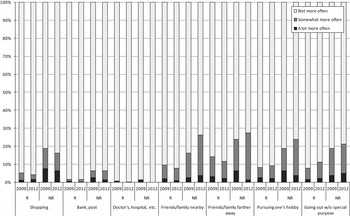
Non-renewers reported more unmet mobility needs both in 2009 and 2012, especially in relation to leisure activities (see Figure 4). However, in 2012 differences between renewers and non-renewers were a bit more pronounced. It is especially unmet needs in leisure activities that increase for non-renewers: visiting friends and family, pursuing hobbies and going out without a special purpose, although the change from 2009 to 2012 is statistically significant only with regard to visiting friends and relatives close by (Wilcoxon: Z=−2.07, p<0.05).
Unmet travel needs for renewers (R) and non-renewers (NR), 2009 and 2012.

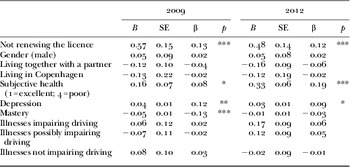
A set of regression analyses was conducted in order to examine if not renewing the licence significantly increased unmet mobility needs (see Table 2). The results confirm that not renewing the licence is related to a higher degree of unmet mobility needs, even if demographic and health variables are controlled for. Both in 2009 and 2012, the strongest predictors of unmet mobility needs are physical and mental wellbeing along with the renewal status. This also confirms that the non-renewers were likely to have already ceased driving in 2009. The main difference between 2009 and 2012 is the role of mastery as a significant predictor for unfulfilled mobility needs. A possible explanation is that holding a licence but not using it (or not being able to use it due to lack of resources or driving confidence, for example) may contribute to a feeling of lacking mastery in one's life (the scale included statements like ‘I have no control over things in my life’).
Linear regression analysis predicting unmet travel needs in 2009 and 2012 (sum score over all activities)

Notes: SE: standard error. R 2 (2009)=0.08; adjusted R 2 (2009)=0.07; R 2 (2012)=0.11; adjusted R 2 (2012)=0.10.
Significance levels: * p<0.05, ** p<0.01, *** p<0.001.
Discussion
The aim of the present study was to investigate the changes in mobility patterns, unfulfilled mobility needs, and physical and psychological wellbeing over a two-year period in older drivers who either gave up or renewed their driving licence. There were four main findings.
First, those not renewing their driving licence had poorer health already at the baseline and the decreases in health during the observation period were similar for both groups. However, compared to the renewers in the same period, the non-renewers did become more dependent on others in their out-of-home activities after giving up their licence. Second, when it comes to travel frequency, neither the differences between renewers and non-renewers nor the changes over time within the groups were very pronounced. The trip frequency in general declined somewhat for both groups. Third, the groups differed significantly in their use of transport modes, both in 2009 and 2012. The renewers drove a car more often as the main transport mode, while non-renewers travelled in the car as a passenger, used public transport, walked or cycled. Both groups increased their share of travelling as a passenger during the two-year period but, overall, the differences between the groups in terms of modal choice became even more pronounced in 2012. Finally, non-renewers reported more unmet mobility needs both in 2009 and 2012, especially in relation to leisure activities. This difference became slightly more pronounced during the observation period. The unmet mobility needs were significantly associated with non-renewal even when controlling for a number of co-variables.
The differences in health found between the groups seem to be rather a cause than an effect of giving up their driving licence. Previous research has documented health consequences from driving cessation (Edwards et al. Reference Edwards, Lunsman, Perkind, Rebok and Roth2009; Fonda, Wallace and Herzog Reference Fonda, Wallace and Herzog2001; Marottoli et al. Reference Marottoli, Mendes de Leon, Glass, Williams, Cooney, Berkman and Tinetti1997; Mezuk and Rebok Reference Mezuk and Rebok2008; Ragland, Satariano and McLeod Reference Ragland, Satariano and MacLeod2005), but the observation periods in these studies tend to be longer, and the focus has been on the actual driving cessation, not the administrative driving cessation – that is, handing in their licence. Given that the present results indicate that many non-renewers had already ceased driving at baseline, the differences found in health may reflect consequences of driving cessation that happened earlier.
Travel frequency did not appear to be affected by renewal/non-renewal of their driving licence, and the two groups did not differ notably in their trip frequency, even at baseline. This is somewhat surprising, as previous research has indicated declines in out-of-home activities after driving cessation (Harrison and Ragland Reference Harrison and Ragland2003; Marottoli et al. Reference Marottoli, Mendes de Leon, Glass, Williams, Cooney and Berkman2000; Rosenbloom Reference Rosenbloom2001). Perhaps in a Danish context, the frequency of out-of-home activities is not as dependent on car access as in other contexts, such as in the United States. However, we found a clear difference in terms of unfulfilled mobility needs, especially as regards leisure activities, indicating a difference in the experienced mobility. Leisure activities tend to require more complex and individualised travel compared to work or shopping trips (Scheiner Reference Scheiner2010), which makes these activities more dependent on car availability. The higher level of unfulfilled mobility needs among the non-renewers probably also reflects general disadvantage of this group compared to renewers, including poorer health and functionality. In line with this, public transport-related problems and health restrictions have been found among the most often reported reasons for unmet travel needs (Kasper and Scheiner Reference Kasper, Scheiner and Williams2005). However, when controlling for health and other background variables, the renewal status still remained as a significant predictor of unfulfilled mobility needs.
The present study indicates that the licence renewal policy as such has only a small effect on the drivers that have to renew their licence for the first time at the age of 70. The current cohorts turning 70 years old are not likely to give up their licence abruptly. Only a small proportion chooses not to renew the licence when it expires, and these licence holders have already ceased driving. The present study could not provide conclusive evidence on the health impacts from driving cessation and it remains unclear to what extent driving cessation affects or is affected by health. We found that depression and some illnesses increased for non-renewers, but the causation is not clear. Nevertheless, this study could demonstrate that giving up the driving licence (and the self-regulatory driving behaviour that often seems to occur prior to licence surrender) are strongly related to unfulfilled mobility needs. This indicates that efforts to prevent premature driving cessation may be beneficial for society.
The present study had the advantage of a longitudinal design and a large and representative sample. However, the sample of non-renewers was small, especially the number of male non-renewers. This made it in some cases difficult to test the significance of the differences found between renewers and non-renewers and it was not possible to control for gender, family status and residential area, variables which were found to be related to renewing the licence or not. All in all, when interpreting the results, it has to be borne in mind that three-quarters of non-renewers are women. For a small proportion of non-renewers (15%) it is unclear whether they intentionally did not renew their licence or whether they wanted to renew it but were rejected. It can be expected that those who remained in control of giving up driving faced fewer problems related to quality of life than those who were forced to give up (Musselwhite and Shergold Reference Musselwhite and Shergold2013; Windsor et al. Reference Windsor, Anstey, Butterworth, Luszcz and Andrews2007). Another limitation of the study was that the follow-up period was not very long, making it more difficult to capture the possible changes in health and wellbeing post driving cessation. Finally, the study addressed only older drivers aged 69 years at baseline. Thus, the results are not generalisable to all older Danish drivers, but only to the youngest cohorts of seniors. While the present study indicates that the younger seniors are not vulnerable to the driver licensing policies, this may be different in the older cohorts as well as later on when these younger cohorts reach older ages and have to renew their licence again.
Age-based screening practices can be seen as ageist policies that signal that society finds car driving by senior citizens a questionable, even suspect, activity. At the same time, the senior population is increasingly active and car-reliant, wishing to continue driving into advanced ages. The present study indicates that younger seniors' mobility is not likely to be affected by the strict renewal policies, as the majority will continue driving despite the renewal procedure. While driving cessation was associated with mobility problems, those persons not renewing their licences had already restricted their driving or stopped driving entirely before reaching the renewal age. The economic and safety returns of the age-based driver screening policies have been shown to be poor (Langford et al. Reference Langford, Fitzharris, Koppel and Newstead2004; Siren and Meng Reference Siren and Meng2012) and some studies indicate that having such policies in place may actually decrease safety (Hakamies-Blomqvist, Johansson and Lundberg Reference Hakamies-Blomqvist, Johansson and Lundberg1996; Siren and Meng Reference Siren and Meng2012; Tay Reference Tay2012). At the same time, the economic and safety benefits of independent mobility in old age are indisputable (e.g. Hakamies-Blomqvist Reference Hakamies-Blomqvist2003), making prevention of premature driving cessation and the consequent mobility loss justified. Having restrictive, ageist policies in place that moreover fail as societal investments may, however, work against society's goal of preventing unwarranted mobility loss in old age.
Acknowledgements
The work was part of the project ‘Drivers and limits for transport – possible contributors for climate change’ and supported by the Danish Council for Strategic Research.