Introduction
Variation in the biochemical phosphorus (P) fraction in plants is related with the form in which plant species allocate P in dry matter and the P availability in the soil. Plants growing in soils with low P availability, as in natural grasslands, are expected to allocate P into the metabolically active fractions of the cytosol and chloroplasts (Noack et al. Reference Noack, McLaughlin, Smernik, McBeath and Armstrong2014a). A higher proportion of P in nucleic acids (PDNA and PRNA) is normally found in meristems and leaves (Noack et al. Reference Noack, McLaughlin, Smernik, McBeath and Armstrong2014a). In contrast, under high available soil P conditions such as fertilized conditions, plants tend to have high P concentrations in tissues, mainly as inorganic soluble P (PIS) in the vacuoles. This fraction is considered the non-metabolic fraction and often represents more than 85% of total P in plant tissues (Bieleski & Ferguson Reference Bieleski, Ferguson, Lauchli and Bieleski1983, Noack et al. Reference Noack, Smernik, McBeath, Armstrong and McLaughlin2014b). Phosphorus in the ester fraction (composed of a molecule of carboxylic acid and an alcohol), such as P in nucleic acids and phospholipids (PLIP), which constitute the metabolic and structural P forms, is not water-soluble and is located in the cytosol and biomembranes (Bieleski & Ferguson Reference Bieleski, Ferguson, Lauchli and Bieleski1983, Hidaka & Kitayama Reference Hidaka and Kitayama2011, Veneklaas et al. Reference Veneklaas, Lambers, Bragg, Finnegan, Lovelock, Plaxton, Price, Scheible, Shane, White and Raven2012).
Phosphorus availability in natural grasslands is generally low, 1.0–7.5 mg kg−1 (Rheinheimer et al. Reference Rheinheimer, Martinazzo, Gatiboni, Kaminski and Da Silva2008, Tiecher et al. Reference Tiecher, Oliveira, Rheinheimer, Quadros, Gatiboni, Brunetto and Kaminski2014) and this leads to low forage production (Oliveira et al. Reference Oliveira, Marques, De Quadros, Farias, Piccin, Brunetto and Nicoloso2018). To understand the dry matter production in these grasslands, Cruz et al. (Reference Cruz, De Quadros, Theau, Frizzo, Jouany, Duru and Carvalho2010) grouped some of these grasses according to their plant functional types (PFTs). This characterization was based on leaf attributes, leaf dry matter content (LDMC, leaf dry matter/leaf fresh matter) and specific leaf area (SLA; leaf area/leaf dry matter). At one extreme, PFT-A is a group of grasses with resource-capture characteristics, characterized by rapid tissue cycling (higher SLA and lower LDMC).
At the other extreme, PFT-D is a group of grasses characterized by the formation of dense tussocks (high LDMC and low SLA), with slow cycling of tissues. Between these two extremes, there are PFT-B and PFT-C, which are adapted to intermediate conditions between those of groups A and D. Paspalum and Andropogon are representative genera of PFT-B and PFT-C, respectively.
Our hypothesis is that resource-capturing grass species with rapid tissue cycling have a high P uptake rate and accumulate P in leaf tissue in easily remobilized forms. On the other hand, resource-conserving species with slow cycling of tissues may have a low P uptake rate and allocate P to leaf tissue in more structural forms, such as PLIP. In addition, the use of P fertilization in these grasses alters the biochemical fractions of P, and the response of the plant varies according to its resource-acquisition characteristics.
For this purpose, we used the chemical fractionation method proposed by Miyachi & Tamiya (Reference Miyachi and Tamiya1961) to estimate the P forms in leaves of four main grasses, Axonopus affinis (PFT-A), Paspalum notatum (PFT-B), Andropogon lateralis (PFT-C) and Aristida laevis (PFT-D), with contrasting growth characteristics grown in pots with an Ultisol from natural grasslands of South America, at two levels of plant-available P in order to characterize and better understand the mechanisms of the different PFTs regarding P usage and storage as a function of different relative growth rates.
Materials and methods
Soil collection and treatments
The study was carried out in a greenhouse at the Department of Soil Science of the Federal University of Santa Maria (UFSM), Santa Maria (29°43’S, 53°42’W), state of Rio Grande do Sul, Southern Brazil. Four species of native subtropical grasses, the most representative and frequent from each plant functional type (Cruz et al. Reference Cruz, De Quadros, Theau, Frizzo, Jouany, Duru and Carvalho2010) with wide distribution in the natural grasslands from South America (Pallarés et al. Reference Pallarés, Berretta, Maraschin, Suttie, Reynolds and Batello2005) were selected: Axonopus affinis (PFT-A), Paspalum notatum (PFT-B), Andropogon lateralis (PFT-C) and Aristida laevis (PFT-D).
In January 2012, soil samples of an Ultisol from a natural grassland with no history of fertilization were collected at 0−0.20 m depth. The soil was air-dried and sieved through a 4-mm mesh and then conditioned in 5-kg pots. Water was immediately added to the pots to achieve 70% of the field capacity. In April 2012, the grass species were collected from the same location and transplanted to pots with a density of five tillers per pot. The roots and shoots of these plants were standardized by cutting to a size of 10 cm in length. The main soil physicochemical characteristics of the collected soil were 180 g kg−1 of clay, soil pH-H2O 4.6, 25 g kg−1 of soil organic matter (Walkley & Black Reference Walkley and Black1934), 1.9, 2.8 and 1.4 cmolc kg–1 of exchangeable Al, Ca and Mg, respectively (extracted by KCl 1 mol L−1), 3.0 and 76 mg kg–1 of available P and K, respectively (extracted by Mehlich-1), 9.0 mg kg–1 of available S (extracted by Ca(H2PO4)2), and 6.2 cmolc kg–1 of cation exchange capacity (CEC).
From April to September 2012, grasses were submitted to acclimatization in the greenhouse. In September 2012, grasses were cut 5 cm above the soil surface. Then, grasses were subjected to two treatments: control (without P addition (P0)) and with addition of 50 mg of P kg–1 to soil (P50). This rate represented a concentration of 21–42 mg kg–1 (extracted by Mehlich-1 solution), which is considered an adequate value for soils with a clay content lower than 200 g kg−1. The source of P used was KH2PO4 in the P50 treatment. For P0, K was added as KCl at a rate of 14 mg K kg–1. The soil water content in pots was kept at 70% of the field capacity by weighing the pots daily and adding distilled water when necessary. During the experimental period, weeds were manually controlled to avoid competition with grasses for water and nutrients. The temperature in the greenhouse was maintained at approximately 24°C, and the relative air humidity was 76%. The experimental design was a randomized block with two P treatments (P0 and P50), four grass species, two sampling dates and four replicates, in a total of 64 pots.
Plant and soil sampling
The sampling dates were on day 45 (27 October 2012, first sampling date) and day 76 (28 November 2012, second sampling date) after the standardization of plants (cutting of shoots to 5 cm height) and fertilizer P application. The sampling interval was defined as the thermal sum necessary for the sequential emergence of two leaves (phyllochron), and is expressed in degree-days (DD) (Machado et al. Reference Machado, Rocha, Quadros, Confortin, Dos Santos, Sichonany, Ribeiro and Da Rosa2013). First sampling date was defined by accumulation of 384 DD and allows growth of two leaves. Second sampling date was defined by accumulation of 768 DD, this temperature allows the growth of two more leaves (Machado et al. Reference Machado, Rocha, Quadros, Confortin, Dos Santos, Sichonany, Ribeiro and Da Rosa2013). Degree-days were calculated by averaging between maximum and minimum temperature of the day in the greenhouse. To obtain the temperatures a weather station Hobo U12-001® was used. Flowering did not occur during the experimental period. At each sampling date, the above-ground plant material in each pot was harvested to determine the total dry matter (DM) yield. Shoots (divided into leaves and stems) were dried in an oven with forced air circulation at 65°C until constant weight and weighed. Then, plant samples were ground, sieved with 1-mm mesh, and reserved for further analysis. After plant harvest, total soil was sampled from each pot. The soil was air-dried, sieved with 2 mm mesh and reserved for analysis to determine the available P by Mehlich-1 (HCl 0.05 mol L–1 + H2SO4 0.0125 mol L–1), according to Murphy & Riley (Reference Murphy and Riley1962) (Table 1).
Available soil P concentration (mg kg−1) and dry matter (DM) yield (g pot−1) of shoots (leaves + stems) and leaves of Axonopus affinis (PTF-A), Paspalum notatum (PTF-B), Andropogon lateralis (PTF-C) and Aristida laevis (PTF-D) collected and cultivated in Santa Maria, southern region of Brazil and grown in pots, with and without the addition of P (P0 and P50), at 45 and 76 d after treatments application. Means followed by the same lower-case letter in columns, comparing species within each sampling period and P-treatment, and means followed by the same capital letter in the row, comparing P-treatments for each variable, according to Scott–Knott test at 5%. The comparison of means between sampling periods is indicated by an asterisk. Values without asterisks means no statistically significant difference between sampling periods by Scott–Knott test at 5%

Chemical P fractionation in leaves
Leaf DM was subjected to chemical P fractionation according to the method of Miyachi & Tamiya (Reference Miyachi and Tamiya1961), adapted by Hogue et al. (Reference Hogue, Wilcox and Cantliffe1987), Pereira et al. (Reference Pereira, Cambraia, Da Fonseca Júnior and Ribeiro2008) and Casali et al. (Reference Casali, Kaminski, Piccin, Arbugeri and Doneda2011), as briefly described below. The determined P fractions in the plant material were total soluble P in acid (PTS), inorganic soluble P in acid (PIS), organic soluble P in acid (POS) (by the difference between PTS and PIS), lipid P (PLIP), P associated with RNA (PRNA), P associated with DNA (PDNA), and residual P (PRES).
For this purpose, 0.2 g of leaf material was weighed in triplicate (three laboratory replicates) and added to a round-bottom Falcon tube with a 15 mL capacity. Immediately, 10 mL of HClO4 0.2 mol L−1 was added. The tubes were manually stirred for 5 min and centrifuged for 10 min at 5000 g. The supernatant was filtered with a quantitative filter with 8-μm pores. Then, the tissue received 5 mL of HClO4 0.2 mol L−1, and the centrifugation and filtration processes were repeated. The supernatant was mixed, and the PTS concentration was determined according to the Murphy & Riley (Reference Murphy and Riley1962) method after digestion with H2SO4 and ammonium persulphate ((NH4)2S2O8) in an autoclave at 121°C (USEPA 1971). In the same extract, a direct analysis of the P concentration was performed using the methodology described by Murphy & Riley (Reference Murphy and Riley1962) to obtain the PIS. POS was estimated as the difference between PTS and PIS.
Subsequently, 6 mL of ethanol + ether + chloroform solution (E + E + C) was added to the remaining tissue sample from the first extraction in the proportion 2:2:1. It was kept in a water bath for 1 h at 50°C. Then, the plant extract was centrifuged for 10 min at 5000 g, and the supernatant was stored in a 25 mL Erlenmeyer flask. Immediately, 4 mL of cold ether (4°C) was added to the remaining plant tissue in the Falcon tube, and the centrifugation was repeated. The extract of the second centrifugation was mixed with the first centrifugation in the Erlenmeyer flask. The extract in the Erlenmeyer flask was allowed to stand to facilitate evaporation of the ether for 24 h in a fume hood and for 3 h in an oven with forced air circulation at 27°C. Thereafter, 6 mL of distilled water was added to replenish the evaporated ether extract. From this final extract, 2 mL was used to determine the PLIP after digestion according to USEPA (1971). Following fractionation, the remaining sample of the E + E + C extraction received 6 mL of KOH 0.5 mol L−1 and was stirred for 1 min by hand. This sample remained undisturbed for 17 h at 37°C in an oven with forced air circulation. Thereafter, 1 mL of HCl 3.0 mol L−1 and 1 mL of HClO4 at 70% (v/v) was added, and the tube was centrifuged for 10 min at 5000 g. Thereafter, the supernatant was stored.
Later, 5 mL of HClO4 0.5 mol L−1 was added to the tissue that remained in the Falcon tube and centrifuged once again for 10 min at 5000 g. The extract of this centrifugation was mixed with the previous extract. Then, 2 mL was taken from this final extract and digested according to USEPA (1971) to determine the PRNA. Afterwards, 5.0 mL of HClO40.5 mol L−1 was added to the remaining tissue in the Falcon tube. The tube was shaken by hand for 1 min and then kept in a water bath for 15 min at 100°C. Afterwards, the tube was centrifuged at 5000 g for 10 min, and the supernatant was stored. In 2 mL of the extract, the PDNA was determined after digestion according to USEPA (1971). The residue of the remaining tissue in the D Falcon tube was digested according to USEPA (1971) to obtain the PRES. The quantification of all P fractions was performed according to Murphy & Riley (Reference Murphy and Riley1962).
Estimation of relative growth rate and relative phosphorus uptake rate
Relative growth rate (RGR, g d−1) and relative phosphorus uptake rate (RPUR, mg P d−1) during the sampling period (45–76 d after start) were calculated as the slope of the least squares regression lines of the log-transformed values of DM and P accumulated against time, respectively (Grimoldi et al. Reference Grimoldi, Kavanová, Lattanzi and Schnyder2005).
Statistical analysis
Values for each variable measured were analysed for homoscedasticity. When necessary, a logarithmic transformation was used. Variables were analysed following the three-factor model. When the effects of treatment were significant at P ≤ 0.05, differences between the means were compared by the Scott–Knott test. The variables RGR and RPUR were analysed following the bifactorial model because the RGR and RPUR were calculated using the difference between two periods. When the effects of treatments were significant (P ≤ 0.05), differences between the means were compared by the Scott–Knott test.
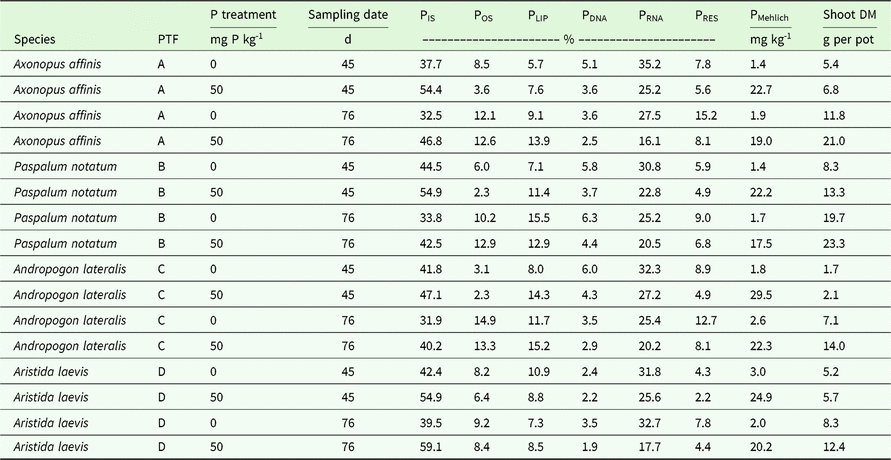
Phosphorus fractions in leaves of four plant species in response to two P treatments at the two sampling dates were compared using a multivariate Principal Component Analysis (PCA) based on the relationship among all variables. Although the groups of plants were known, PCA was performed in order to understand the different patterns of distribution of P forms in tissue during the two sampling periods. The percentage of PTS was not used in this analysis to avoid redundancy in the PCA, as it represents the sum of PIS and POS. The shoot DM yield and the available soil P were used as additional variables (Appendix 1).
Results
Available soil P
The available soil P in the P50 treatment was higher than 22 mg kg–1 on the first sampling date (Table 1), which is an adequate availability for plants in this type of soil, according to CQFS-RS/SC (Reference In Tedesco, Gianello, Anghinoni, Bissani, Camargo and Wiethölter2016). Moreover, this P amount was ∼16 times greater than the P concentration in the P0 treatment. On the second sampling date, the available soil P in P50 was still higher than that in P0, but the amount was slightly reduced compared with the amount on the first date (Table 1).
Dry matter yield and relative phosphorus uptake rate
Forty-five days after fertilizer application, no significant differences in leaf DM yield were detected among grass species (Table 1). Andropogon lateralis (PFT-C) had the lowest shoot DM regardless of the P level. On the second sampling date, some differences were evident, with lower shoot and leaf DM values under the P0 treatment, especially for A. lateralis and A. laevis, which are, respectively, PTF-C and PTF-D plants. At this growth phase, all four grasses showed higher shoot DM yield compared with the first sampling date after P addition (Table 1). Axonopus affinis (PFT-A) and P. notatum (PFT-B) showed the highest shoot DM yield regardless of the sampling period and the soil P level.
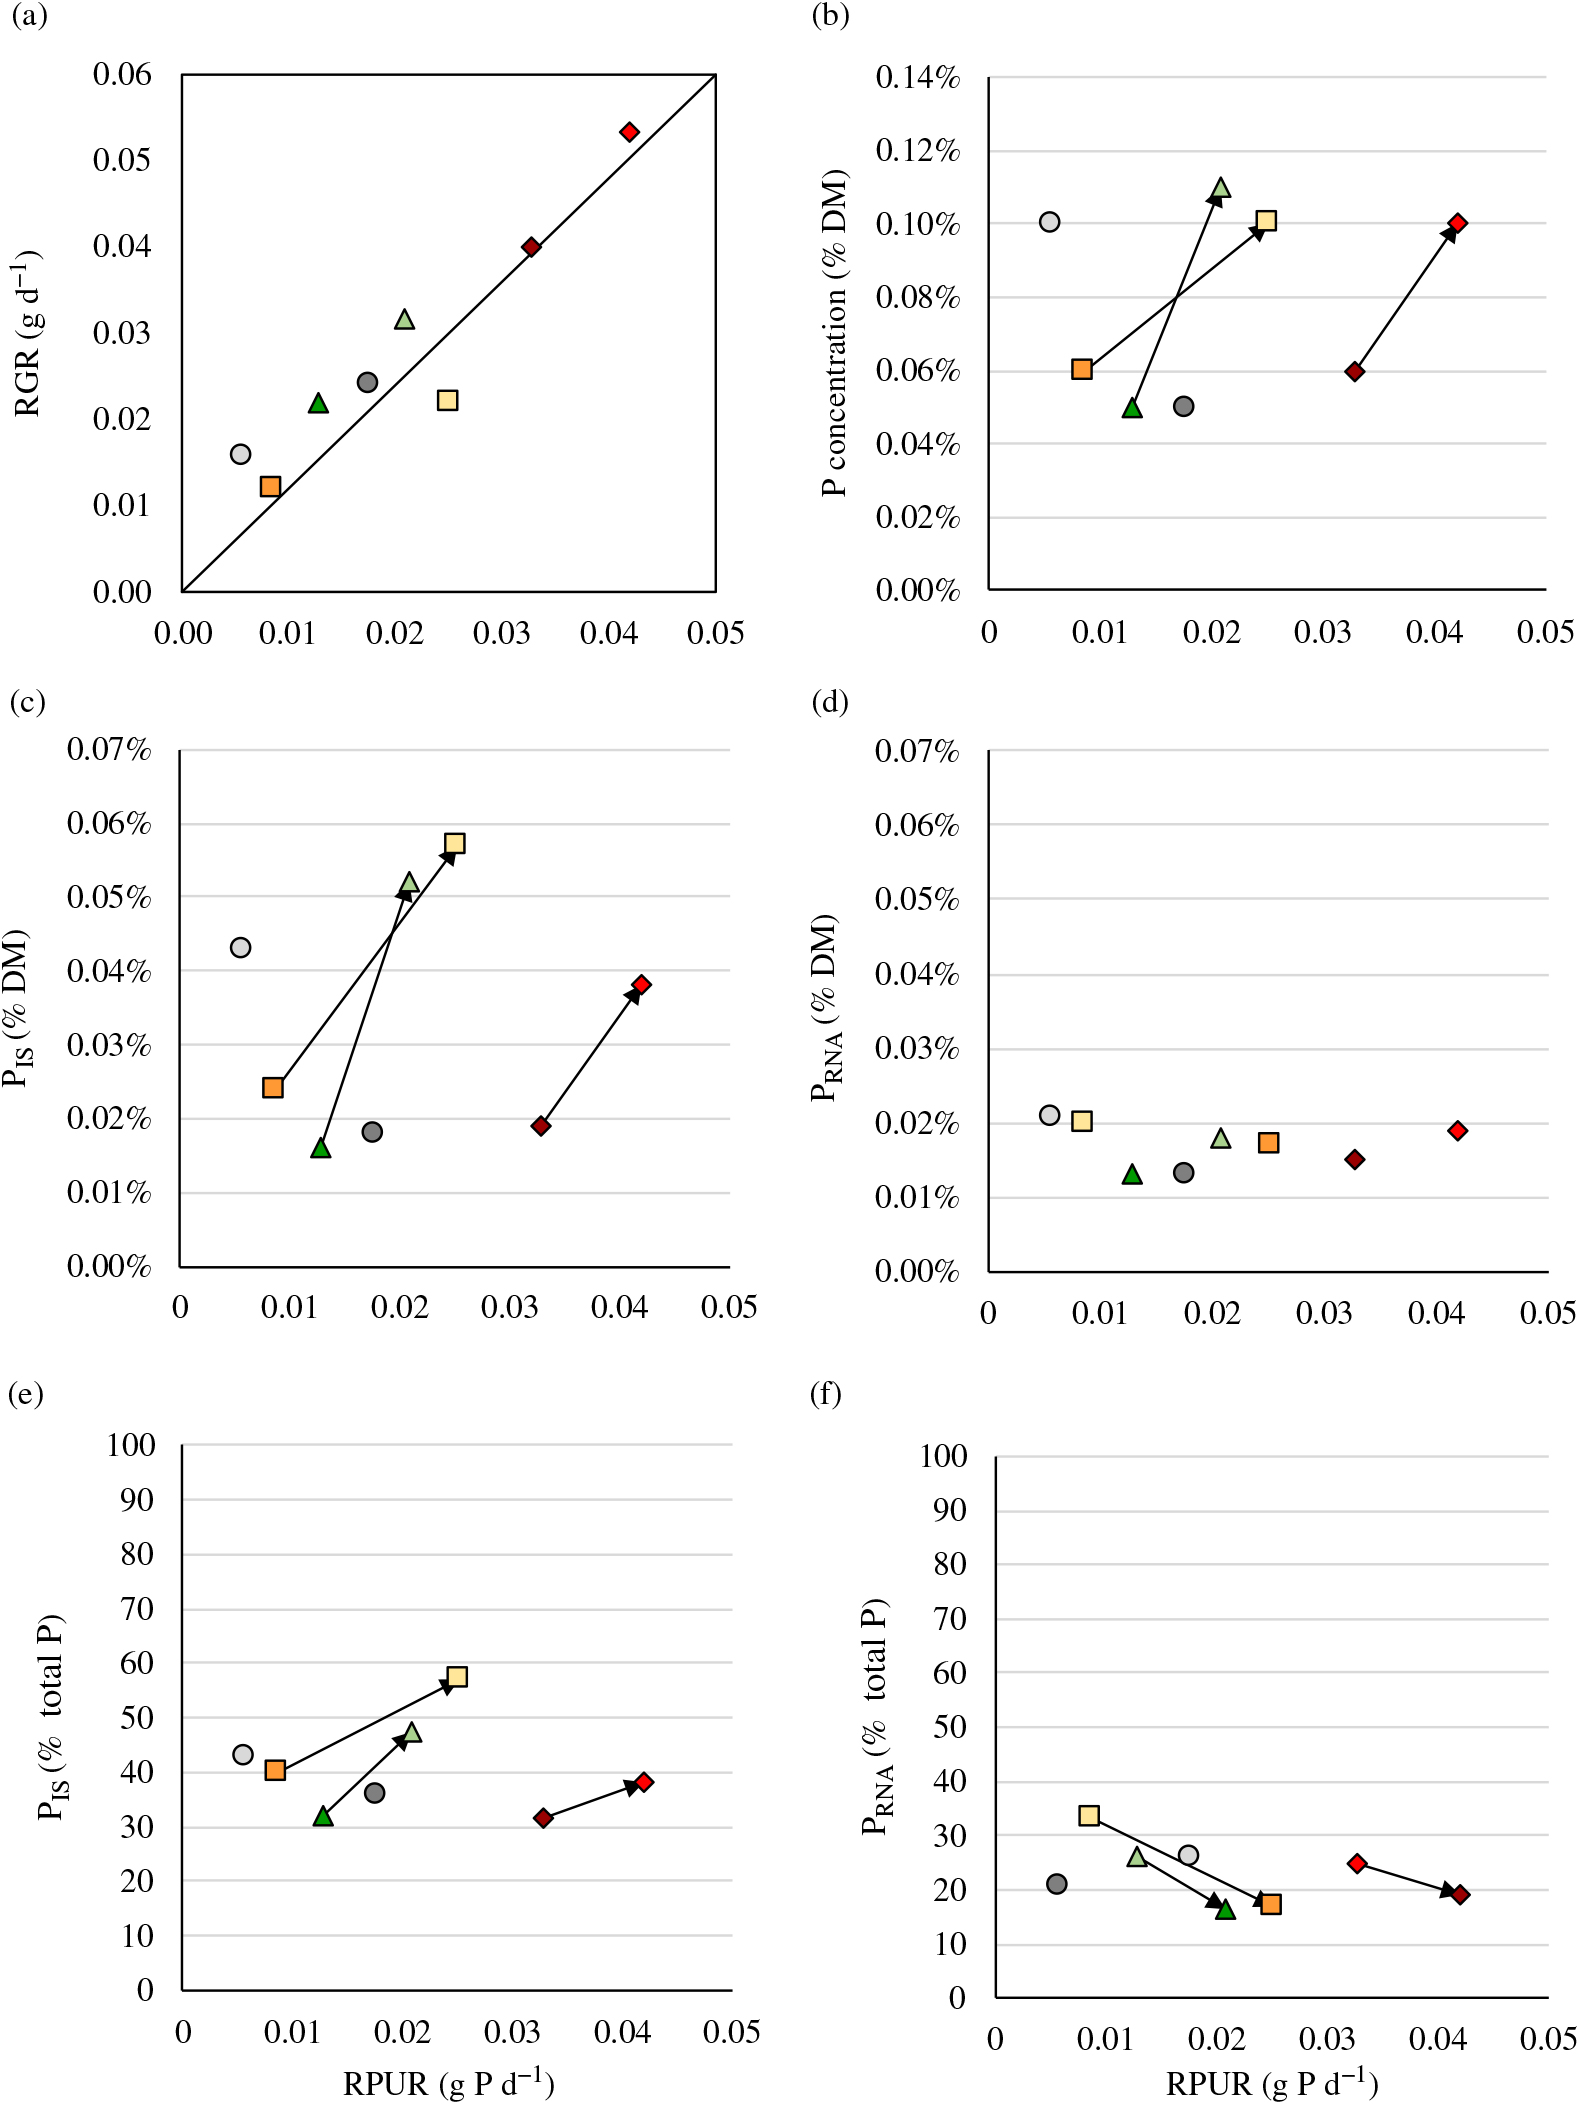
Considering the correlation between the relative phosphorus uptake rate (RPUR) and plant species, most plant species increased their plant relative growth rate (RGR) with P addition, except for P. notatum (Figure 1a). This species showed similar leaf DM after P50 in both sampling periods. In addition, with the exception of P. notatum, all species showed higher RPUR with P addition. Under low P availability (P0) and after P addition (P50), A. lateralis (PFT-C) showed the highest RGR in relation to that of other species (Figure 1a). Andropogon lateralis also showed high RPUR at low P availability (P0) and with P addition (P50).
Relative growth rate (RGR) to relative phosphorus uptake rate (RPUR) (a), total P concentration (b), inorganic soluble P concentration (PIS) (c), P RNA concentration (PRNA) (d), percentage contribution of PIS (e) and the percentage contribution of PRNA (f) in the leaves of Axonopus affinis (triangles), Paspalum notatum (circles), Andropogon lateralis (diamonds) and Aristida laevis (squares) collected and cultivated in Santa Maria, southern region of Brazil and grown in soil with 50 mg of P kg−1 of soil (light symbols) and without P (dark symbols).

Leaf P fractioning
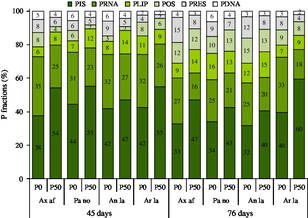
The increase in RPUR in the fertilization condition was associated with an increase in the concentration of P in DM, mainly for A. affinis (Figure 1b). The overall distribution of P fractions in leaves of four grasses under the two P levels and for both sampling periods indicated that the main P fraction was the inorganic soluble form (44% ± 8%), followed by PRNA (26% ± 5%) (Figure 2). PLIP (10% ± 3%), PSO (8% ± 4%), PRES (7% ± 3%) and PDNA (4% ± 2%) did not differ significantly but were significantly lower than PIS (Appendix 2).
Percentage distribution of leaf phosphorus fractions in Axonopus affinis (Axaf; PFT A), Paspalum notatum (Pano; PTF B), Andropogon lateralis (Anla; PTF C) and Aristida laevis (Arla; PTF D) collected and cultivated in Santa Maria, southern region of Brazil and grown in soil with 50 mg of P kg−1 of soil (P50) and without P (P0) at 45 and 76 d after treatment application. Residual P (PRES), P associated with RNA (PRNA), P associated with DNA (PDNA), lipid P (PLIP), organic soluble P (POS) and inorganic soluble P (PIS).

Considering that PIS represents the highest percentage of total P, its behaviour followed the same pattern of response as total P concentration (Figure 1c). The second main fraction (PRNA), however, did not vary in its concentration (Figure 1d). The percentage contributions of PIS and PRNA to total P are represented in Figures 1e and 1f. The contribution of the PIS in the total P increased mainly for A. affinis (PFT-A), P. notatum and A. lateralis (PFT-C) (Figure 1e). This result was accompanied by a reduction in the PRNA contribution to the total P (Figure 1f).
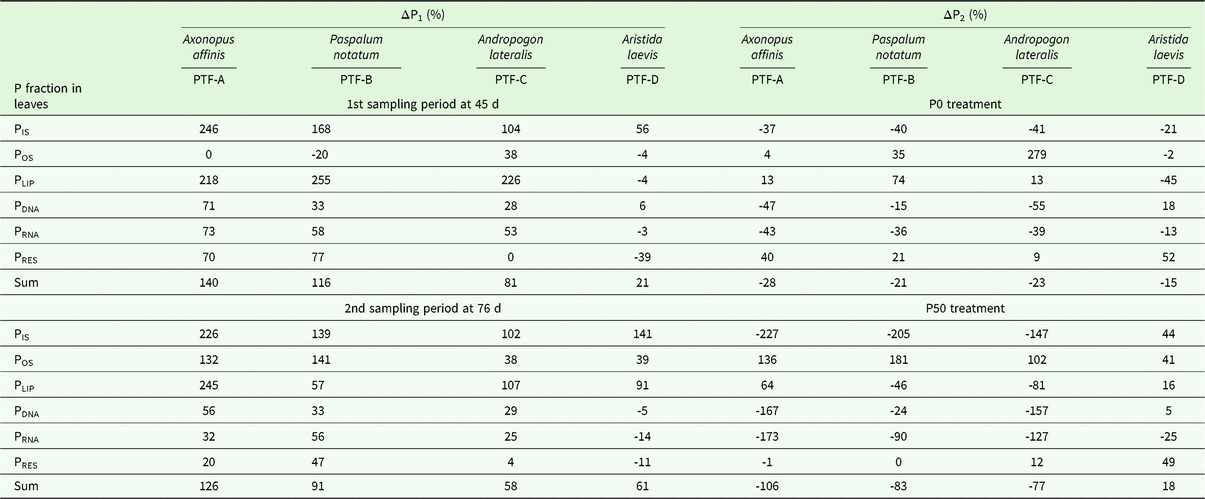
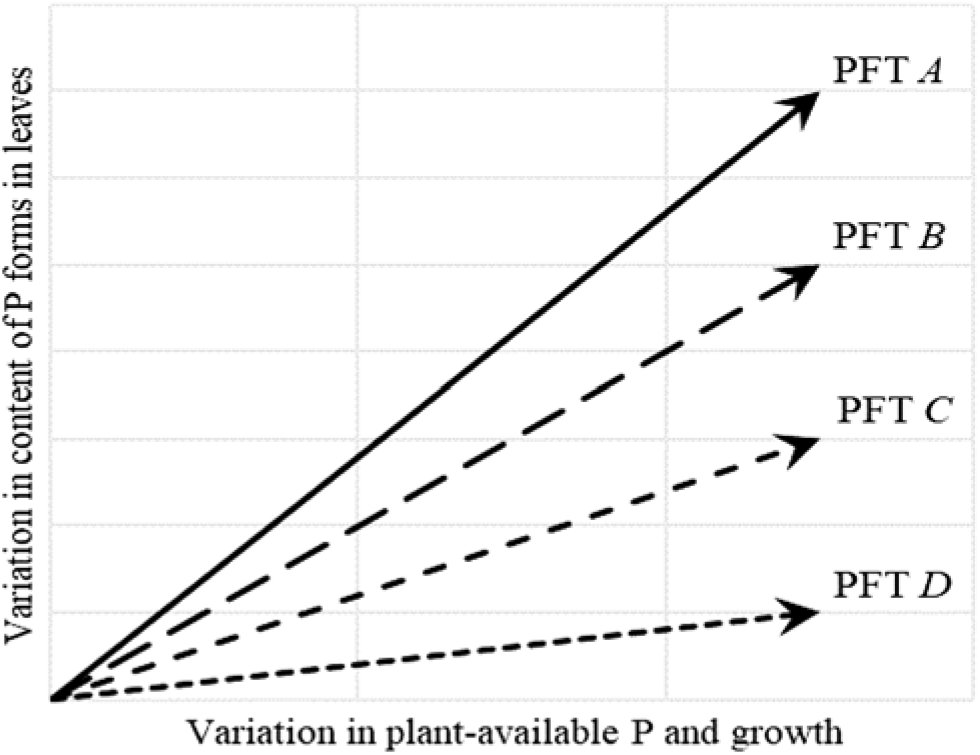
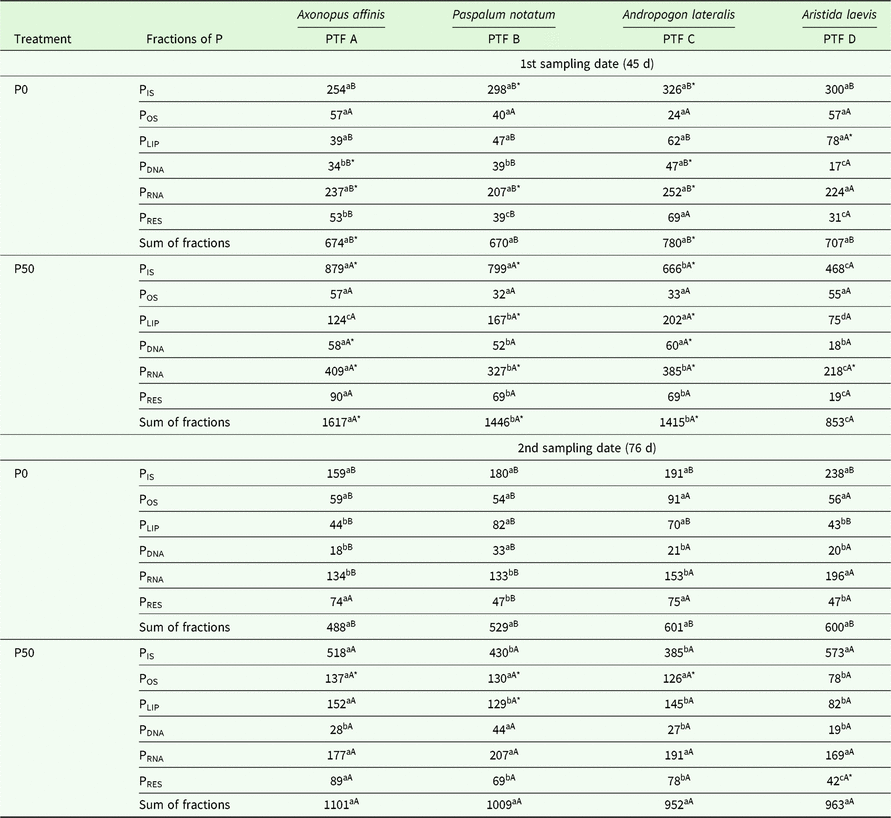
The variation in P concentration for each P fraction as affected by the P rates (ΔP1) and the sampling date (ΔP2) was calculated (Table 2). On both sampling dates, an increase was observed for almost all P fractions and grasses (Table 2). The overall variation of P fraction concentrations in grass leaves for both P levels and sampling dates followed the order A. affinis > P. notatum > A. lateralis > A. laevis (i.e. PFT-A, PFT-B, PFT-C and PFT-D, respectively) (Table 2, Figure 3).
Variation in P fractions (ΔP1, %) in the leaves of four grasses affected by P treatment at 45 and 76 d after its application, and variation in P fractions (ΔP2, %) in leaves of four grasses affected by sampling periods and levels of P (P0 and P50). ΔP1= (P50 − P0) × 100. ΔP2 = (1st sampling period − 2nd sampling period) × 100. Inorganic soluble P (PIS), organic soluble P (POS), lipidic P (PLIP), P associated with RNA (PRNA), P associated with DNA81% (PDNA) and residual P (PRES)


As indicated by ΔP1, the addition of P increased the total P content on the first sampling date, following the order A. affinis (PFT-A; 140%) > P. notatum (PFT-B; 116%) > A. lateralis (PFT-C; 81%) > A. laevis (PFT-D; 21%) (Table 2). As indicated by ΔP2, the PIS, PDNA and PRNA fractions decreased from the first to the second sampling date (Table 2), except for the PIS and PDNA for A. laevis (PFT-D) at P50.
Under low P (P0), the variation in the concentration of P fractions in leaves from 45 d to 76 d was smaller than that under high-P conditions (P50) (Table 3). A noticeable increase of almost three-fold in the content of POS was observed for A. lateralis (PFT-C) under P50 conditions (Table 3). Under the high-P condition, the decrease in PIS, PDNA and PRNA on the second sampling date was more pronounced for A. affinis (PFT-A), A. lateralis (PFT-C) and P. notatum (PFT-B), with a simultaneous increase in POS. On the other hand, A. laevis (PFT-D) increased the concentration of all P fractions under the application of P50, especially at 76 d, except for PDNA, PRNA and PRES.
Phosphorus fractions (mg P kg−1) in the leaves of native subtropical forage grasses collected and cultivated in Santa Maria, southern region of Brazil and grown under two levels of available soil P (0 and 50 mg kg−1), for two periods after treatment application (day 45 and 76). PTF = Plant functional types; PIS = inorganic soluble P; POS = organic soluble P; PLIP = lipid P; PRNA = P associated with RNA; PDNA= P associated with DNA; PRES = residual P. Means followed by the same lower letter in the row, compares means for plant species within each sampling period, and means followed by the same capital letter in the column, compares P-treatment within each plant species and sampling period, according to Scott–Knott test at 5%. The comparison of means between sampling periods is indicated by an asterisk. Values without asterisks are not significantly different between sampling periods by Scott–Knott test at 5%

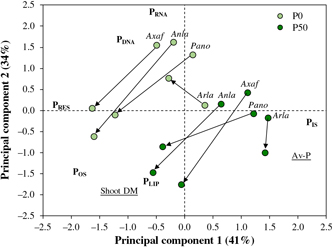
The multivariate PCA was able to synthesize 75% of the total variation in the data in the first two ordination axes (Figure 4). The PCA showed that, except for A. laevis (PFT-D), the grass species showed a similar tendency in the distribution of tissue P fractions from the first to the second sampling date (Figure 4). Simultaneously, with shoot biomass accumulation, the plant species A. affinis (PFT-A), P. notatum (PFT-B) and A. lateralis (PFT-C) decreased the percentage of PIS and increased the percentage of POS in their leaves. Moreover, the PCA highlighted that the POS and PLIP of native grasses were positively related to the shoot DM yield; a similar relationship was observed for PIS in leaves and available soil P (Figure 4). Both indicators (PIS and available P) were negatively related to PRES (Figure 4).
Projection of the distribution of P fractions in the leaves of native subtropical forage grasses grown fertilized with P0 and P50 in the first two principal components. Numbers in parentheses (axes) indicate the percentage of variance explained by each axis. The direction of the arrows indicates the sampling time, from the first to the second sampling period, conducted at 45 and 76 d after P treatment. Axaf = Axonopus affinis (PTF A), Pano = Paspalum notatum (PTF B), Anla = Andropogon lateralis (PTF C) and Arla = Aristida laevis (PTF D). Data used in this Principal Component Analysis are given in Appendix 1.

Discussion
Sufficient P concentrations in the soil indicated that grasses grown without P limitation resulted in higher shoot DM and relative growth rate (RGR). This result was in agreement with Gatiboni et al. (Reference Gatiboni, Kaminski, Pellegrini, Brunetto, Saggin and Flores2000) and Oliveira et al. (Reference Oliveira, Tiecher, Quadros, Trindade, Gatiboni, Brunetto and Santos2014), who reported that P is the nutrient that limits the forage yield in natural grasslands of South America.
Interestingly, although resource-capture species had higher DM production, especially on the second sampling date, they did not present higher RGR and RPUR. This is probably due to their high initial DM production, possibly due to the contribution of stolons produced by P. notatum (Oliveira et al. Reference Oliveira, Marques, De Quadros, Farias, Piccin, Brunetto and Nicoloso2018). This finding deserves further study. Under the present conditions, RGR and RPUR do not reinforce the theory of higher DM production capacity by resource capture species. However, total plant P data (the sum of the fractions) show high absorption capacity and P accumulation by resource capture species, especially after fertilization conditions, leading to higher DM production.
After 45 d, the overall distribution of P fractions in leaves was in agreement with previous studies (Bieleski Reference Bieleski1973, Bieleski & Ferguson Reference Bieleski, Ferguson, Lauchli and Bieleski1983, Casali et al. Reference Casali, Kaminski, Piccin, Arbugeri and Doneda2011, Noack et al. Reference Noack, Smernik, McBeath, Armstrong and McLaughlin2014b), demonstrating that PIS was the main P fraction in leaves and PRNA was the major organic P fraction in plant tissue. The PIS was the larger P fraction in the leaf tissue of all grasses on both sampling dates.
However, the PIS concentration was especially high in all grass species grown in P50 compared with that in P0 due to the high sensitivity of PIS to changes in available soil P concentration. Much of the absorbed P is allocated into the vacuoles as monoester phosphate and inorganic P when plants are grown with high available soil P (Bieleski Reference Bieleski1973). The PIS fraction represents the P present in the cytosol (lower concentration) and the P stored in the vacuole (higher concentration) (Bieleski & Ferguson Reference Bieleski, Ferguson, Lauchli and Bieleski1983). This explains the high PIS concentration in resource-capture species.
After 45 d, the results of P fractionation in the leaves of grass species indicated that resource-capturing species (PFT-A and PFT-B) had the greatest variation in the concentration of P forms after P addition compared with the resource-conservation plant species and followed the order PFT A > B > C > D. This fact confirms that resource-capturing species (PFT-A and PFT-B) are more responsive to P supply, as previously reported. Resource-capturing plant species took P from the soil and stored it mostly as PIS. The highest PRNA concentration for A. affinis (PFT-A) and P. notatum (PFT-B) when grown in the P50 also indicates that this P fraction is sensitive to changes in soil P status (Lambers et al. Reference Lambers, Shane, Cramer, Pearse and Veneklaas2006, Reference Lambers, Finnegan, Laliberte, Pearse, Ryan, Shane and Veneklaas2011).
On the second sampling date, the sum of P fractions in leaf tissue did not differ among grasses for P50, probably due to the dilution of P resulting from the increase in shoot DM yield (Noack et al. Reference Noack, McLaughlin, Smernik, McBeath and Armstrong2014a). Functional plant groups with greater P concentrations tended to produce more DM, but the P concentration may not necessarily be higher because of the dilution effect.
On both sampling dates, the PDNA concentration was considerably lower than the PRNA concentration in all plants. The PDNA fraction is considered to have a higher recalcitrance; therefore, a reduction in PDNA concentration is difficult to observe and is undesirable (Holford Reference Holford1997, Veneklaas et al. Reference Veneklaas, Lambers, Bragg, Finnegan, Lovelock, Plaxton, Price, Scheible, Shane, White and Raven2012). For the mean effect of sampling date, the PRNA fraction was 6.4 times larger than the PDNA fraction, which corresponds to only 4% of the total P.
Following the pattern of the increase in leaf DM, P accumulated mainly in the PLIP fraction. Plants under P deficiency, as in the P0 soil, may replace the phospholipids of the plasma membrane by sulpho- and/or galactolipids (Lambers et al. Reference Lambers, Cawthray, Giavalisco, Kuo, Laliberté, Pearse, Scheible, Stitt, Teste and Turner2012). On the other hand, A. laevis (PFT-D) did not follow the tendency observed for other grasses. This may have occurred because this species has a resource-conservation characteristic and slow RGR. Therefore, the PFT-D plant species showed a smaller increase in DM from the first to the second sampling period than that shown by the other plant species.
Conclusions
The grasses with resource-capturing features, Axonopus affinis and Paspalum notatum, responded to P fertilization, accumulating P in less structural chemical forms, such as PIS. The grasses with resource-conservation features, Andropogon lateralis and Aristida laevis, showed low variation in the concentration of P forms, with the highest P concentration in structural chemical forms, such as PLIP. In addition, plant species with lower leaf dry matter production are associated with greater variation in the concentration of P forms, depending on soil P availability and plant growth.
Author ORCID
Anderson Cesar Ramos Marques 0000-0003-0866-8761
Appendix 1
Shoot dry matter (DM) production, available soil P, and proportion of phosphorus (P) fractions (%) in leaves of native subtropical forage grasses collected and cultivated in Santa Maria, southern region of Brazil and grown with and without P, at two sampling periods (45 and 76 d after P treatment). Data used in the Principal Component Analysis presented in Figure 4. PTF = Plant functional type; PIS = inorganic soluble P; POS = organic soluble P; PLIP = lipid P; PRNA = P associated with RNA; PDNA = P associated with DNA; PRES = residual P

Appendix 2
Overall average distribution of P fractions in leaves of Axonopus affinis (PTF-A), Paspalum notatum (PTF-B), Andropogon lateralis (PTF-C) and Aristida laevis (PTF-D) cultivated in Santa Maria, southern region of Brazil, and grown in soil with two P-levels, in both sampling periods in greenhouse