


1. Introduction
Cargo is predominantly carried via marine transportation, which is the primary means of transportation in international trade. To adapt to rapid developments in international trade, ships have become increasingly large and high-speed; the types of ships are more abundant and the division of labour is clearer and more detailed. The degree of risks and damage because of ship traffic accidents has accordingly increased. To reduce harm to lives, property and the environment caused by marine traffic accidents; to reduce the risks of marine traffic; and to ensure the safe navigation of ships, researchers have proposed various methods for analysing the marine traffic risks.
Currently, research into marine traffic risk can be divided into both microscopic and macroscopic aspects. Macroscopic marine traffic risk is to study the marine ship traffic from the macroscopic scale, and finally to determine the probability of collision accidents in a certain period of time in the study waters. In the field of marine traffic engineering, macroscopic degree of collision risk reflects the macroscopic situation of ship collision accidents in maritime traffic. The microscopic marine traffic risk in the field of ship collision avoidance is the micro degree of collision risk, which is to study the specific situation of the ships involved, such as the navigation waters, visibility, cargo conditions, professional quality of the pilot, and so on.
Research methods for analysing macroscopic collision risk degree can be divided into two categories. The first category is the use of statistics on marine traffic accidents. This type of method is an in-depth analysis of marine traffic accidents. Many researchers have analysed and summarised the primary factors causing ship collisions by classifying the types of ships, types of accidents, and environmental conditions to assess marine traffic risks (Qu et al., Reference Qu, Meng and Suyi2012). However, the frequency of marine traffic accidents is low when analysing the risk of small sea areas or waterways, and hence insufficient for performing sound statistical analyses. Moreover, accident statistics are imprecise, inconsistently reported and not reliably collected, which could give rise to biased conclusions, e.g., due to underreporting (Lappalainen et al., Reference Langard, Morel and Chauvin2011; Hänninen and Kujala, Reference Hänninen and Kujala2014; Sormunen et al., Reference Qu, Meng and Li2016). While accidents provide insights into maritime traffic accident risks, the limited number of accidents present in area-specific databases, combined with almost inevitable data inaccuracies and underreporting, suggests considering additional sources of information to enhance those insights is prudent.
The second category of research methods for macroscopic collision risk degree is analysis of marine traffic risk using non-accident information, which can alleviate some of the limitations of accident-based methods (Du et al., Reference Du, Goerlandt and Kujala2020). This method is based on the in-depth excavation of information at scenes with potential risks and using various indicators that affect marine traffic safety to analyse water area risks. Although there is a lack of common definition of non-accident critical events, they can be understood as dangerous events that are close to being accidents and therefore warrant attention, these can be termed ‘near miss’ (Zhang et al., Reference Zhang and Meng2015, Reference Zhang, Goerlandt, Montewka and Kujala2016; Du et al., Reference Du, Goerlandt and Kujala2020), etc. Note that ‘near miss’ has two different meanings: one is the scene of a potential risk encounter, and the other is a model or algorithm for detecting the scene of potential risk encounters. To clarify our research object, ‘scene of near miss’ is used to express the first meaning. The scenes of near miss occur more frequently than accidents, so the database of near miss occurrences can provide richer information than that of actual accidents for the analysis of marine traffic risk.
Scholars have considered many factors and proposed a variety of conditions for detecting the scenes of near miss. Fukuto and Imazu regarded distance to closest point of approach (DCPA) of 1 nm and time to closest point of approach (TCPA) of 5 min as the conditions for detecting scenes of near miss from the perspective of reducing the frequency of ship collision warnings and reducing the workload of pilots (Fukuto and Imazu, Reference Fukuto and Imazu2013). Langard et al. found that the average DCPA of ships taking collision avoidance actions was 0⋅64 nm, TCPA was 26 min, and the distance between ships was 1⋅81 nm (Langard et al., Reference Kim and Jeong2015). Kim and Jeong defined the invasion of the ship's domain as a detection condition for near miss, to distinguish between encounter and near miss (Kim and Jeong, Reference Kaneko2016). Sang-Lok Yoo proposed that DCPA of 0⋅1 nm, TCPA of 3 min, and ship distance of 0⋅3 nm can be used as detection conditions for near miss, and then developed a charting system based on near miss density (Yoo, Reference Wu, Mehta, Zaloom and Craig2018). To find the critical encounters, Goerlandt et al. defined overlapping of ship domain and ship contour as ‘near miss’, and analysed the risk of collision between ships in open waters in the Gulf of Finland (Goerlandt et al., Reference Goerlandt, Montewka, Lammi and Kujala2012). Zhang et al. argued that DCPA and TCPA could not fully reflect the risks of ship encounters. They built the vessel conflict ranking operator model by using the distance between ships, relative speed and phase. The distances between ships of 1 nm and 6 nm were set as high-risk and low-risk standards, respectively, and then the risks of Finnish waters were analysed (Zhang et al., Reference Zhang and Meng2015, Reference Zhang, Goerlandt, Montewka and Kujala2016).
There is still a lack of common definition of the scene of near miss, and also no model to detect them which have been widely accepted. Scholars use various methods to find high potential risk encounters, however, these ignore the detection of low potential risk encounters. In open waters, the number of traffic accidents is very small, and even the number of high potential risk encounters is also very small, which makes the method of evaluating marine traffic risk using only high potential risk encounters unsatisfactory, and the analysis of marine traffic risk is not comprehensive. Therefore, the conditions for detecting the scenes of near miss and the method for analysing marine traffic risk are still worthy of further study. This study proposes a model for detecting scenes of near miss based on the concept of ‘arena’, and then a macroscopic collision risk model based on near miss is proposed to assess the marine traffic risk in open water. Cargo ships, oil tankers and passenger ships in the Bohai Sea are selected as the research objects, and then the scenes of near miss in the Bohai Sea are detected. Finally, the geographical distribution characteristics of marine traffic risk in Bohai Sea are obtained.
The main contributions of this study can be summarised as follows.
(1) To analyse the marine traffic risks comprehensively, the model based on arena for detecting the scenes of near miss is proposed.
(2) Considering that it is not applicable to evaluate the marine traffic risk of certain waters only by using the data of high potential risk encounters, a macroscopic collision risk model based on near miss is proposed, which can analyse the marine traffic risk comprehensively.
(3) The sampling frequency of automatic identification system (AIS) data affects the results of detection and measurement of scenes of near miss, and can have a negative influence on marine traffic risk analysis. Therefore, a single near miss is defined in this paper, which eliminates the influence of sampling frequency on detection of scenes of near miss. A statistical model for the scenes of near miss based on water grid method is proposed.
(4) The geographical distribution characteristics of marine traffic risk in the Bohai Sea are obtained based on the calculation of macroscopic collision risk, which provides theoretical support for marine safety management.
The rest of the paper is organised as follows. Section 2 explains the methodology, including the algorithm for detecting scenes of near miss based on the arena concept, the macroscopic collision risk model based on near miss, and the statistical model for the scenes of near miss based on the water grid method. Section 3 analyses the results of near miss detection and geographical distribution characteristics of marine traffic risk in the Bohai Sea. Section 4 gives the conclusion.
2. Methods
2.1 AIS data preprocessing
Detection of scenes of near miss is based on an extensive analysis of information obtained from AIS data. The AIS transmits certain information about the navigational status of the ship to other ships in the vicinity and shore-based stations, continuously and automatically (Tixerant et al., Reference Theodoropoulos, Tritsarolis and Theodoridis2018). The application of AIS is meaningful in protecting the marine environment, ensuring the safety of life at sea, improving the safety of navigation, and developing the shipping industry efficiently. The types of AIS data used by this paper are summarised in Table 1.
Types of AIS data used in this paper

The updating speed of AIS data varies with the ship's navigation status, so information on the ship's trajectory may not be received at the same time. The rate of data transmission is seen in Table 2. In the process of AIS data transmission, due to the limitations of equipment, weather, sea conditions and other factors, information is often missing, so a ship's trajectory obtained from AIS data is a discrete space-time sequence. Time synchronisation interpolation is needed to obtain time synchronous and continuous ship trajectory data because it is necessary to have a fixed sampling frequency for detecting the scenes of near miss. The process of time synchronisation interpolation is shown in Figure 1. The blue points represent the original trajectory data of ship A, the yellow points represent the original trajectory data of ship B, the red points represent the new trajectory data of ship A, and the green points represent the new trajectory data of ship B. It can be seen that the original trajectory data of ship A and ship B are not synchronised in time and the interval is not equal. After synchronous interpolation, the trajectory data with fixed sampling frequency is obtained, where t 1 to t 8 are interpolation time points. The original trajectory points of ship A at t 3 and t 8 and the original trajectory points of ship B at t 1 and t 4 should not be interpolated, because they are all at the interpolation time points. The interpolation calculation of ship position data is as follows:


where ${\lambda _1}$ is the longitude at t 1; $\textrm{\; }{\varphi _1}$
 is the latitude at t 1; ${\lambda _2}$
 is the longitude at t 2; ${\varphi _2}$
 is the latitude at t 1; $\varphi$
 is the latitude at t; $\lambda$
 is the longitude at t.
Synchronous interpolation process

Sample rate of variable data from AIS (Norris, Reference Lewisson2007)

To ensure the correctness of the interpolation, it is also necessary to segment the ship's trajectory. If the time interval between two adjacent points in a ship's trajectory data is too large, the track should be segmented between the two points. If the amount of sub-trajectory data after segmentation is too small, it should be deleted because it cannot provide important information (Theodoropoulos et al., Reference Szlapczynski and Szlapczynska2020).
2.2 Model for detecting the scenes of near miss based on arena
Scholars have considered using DCPA and TCPA to detect the scenes of near miss, but these do not fully reflect the severity level of encounters (Zhang et al., Reference Zhang and Meng2015). The distance between the two ships is also an important factor to detect scenes of near miss, but there are no conclusions about the relationship between the scene of near miss and the distance between the two ships. Therefore, the relationship between the distance and scene of near miss is further analysed according to the Convention on the International Regulations for Preventing Collisions at Sea (COLREGS). Generally, the process of collision accident between ships can be divided into four stages, shown in Figure 2.
Four stages of a ship collision accident

The first stage is where there is no risk of collision as the ships are a long distance apart. At this stage, because of the long distance, it is considered that there is no collision-related risk at this time. From a quantitative perspective, the distance between the two ships (D1) should be at least 6 nm. The second stage is when collision danger occurs, i.e., two ships approach each other and meet the requirements of Rule 7, ‘Collision danger’ of COLREGS (IMO, Reference Szlapczynski and Szlapczynska1972). Note that the collision risk is not defined by COLREGS, and there are no corresponding provisions for the applicable distance between two ships in the event of collision danger. However, from the legal minimum visible distance of the semaphore, the distance between the two ships (D2) at this stage can be between 3 and 6 nm. The third stage is an urgent situation. In terms of maritime practice, it is generally believed that an urgent situation is when two ships approach each other. Safe distance is the distance from the ship's centre to the border of the ship's domain. In the event of an urgent situation, the distance between the two ships (D3) is at least the distance of the ship domain and the turning distance required for ships to take action to avoid a collision. The fourth stage is an imminent danger situation. Determining the extent to which the distance (D4) is close is difficult when two ships are in an imminent danger situation. However, maritime researchers consider that an imminent danger situation is where one ship cannot avoid a collision by itself when the other ship is approaching.
A ship's domain is the area around the ship that should be avoided by other ships for safety reasons. Ship domain is a special form of safe distance, because the distance between the ship and its domain boundary differs according to various bearings. Since Fujii introduced the concept of ship domain, researchers have been making statistical analyses of the distances between ships at the scenes of encounters, and calculating the size of the domain according to expert experience (Szlapczynski and Szlapczynska, Reference Sormunen, Hänninen and Kujala2017; Im and Luong, Reference Im and Luong2019; Zhang and Meng, Reference Yoo2019; Fiskin et al., Reference Fiskin, Nasiboglu and Yardimci2020). The concept of ship domain is widely used in maritime research on near miss detection (Wu et al., Reference Wang, Meng, Xu and Wang2016; Zhang et al., Reference Zhang, Goerlandt, Montewka and Kujala2016; van Westrenen and Ellerbroek, Reference Tixerant, Guyader, Gourmelon and Queffelec2017; Pietrzykowski et al., Reference Norris2018; Zhang et al., Reference Zhang, Floris, Pentti and Yinhai2019).
The size of a ship's domain can vary quite significantly (Wang et al., Reference Wang, Meng, Xu and Wang2009), and the application of different domains to detect near miss affects the detection results. The Fujii ship domain is small, and can only be used to detect the most critical encounters (Goerlandt et al., Reference Goerlandt, Montewka, Lammi and Kujala2012). However, few of the most critical encounters occur in open waters, which makes this method of analysing marine traffic risks inefficient. Therefore, it should be noted that lower potential risk encounters in open waters are also worthy of attention. All the scenes of encounter with potential risk are defined as scenes of near miss in this paper.
In terms of maritime practice, the officer responsible should take appropriate collision avoidance actions to clear other ships. When the officer starts collision avoidance manoeuvres to avoid other ships, it can be assumed that the officer realises the potential risk of collision. Based on the above situation, as a criterion for detecting the scenes of potential risk encounters, this study proposes using the distance between two ships when a ship starts to turn because of the threat from the other ship. To calculate this distance, the expert questionnaire method was adopted in the process of data collection (Davis et al., Reference Davis, Dove and Stockel1980). On the basis of statistical data analysis, a ship domain named an ‘arena’ is obtained, which consists of an off-centre circle.
Both the arena and Fujii ship domain of a ship are shown in Figure 3. The centre of the arena circle is an assumed ship position; the orientation of the real ship is 199° to the assumed ship and a distance of 1⋅7 nm away. The real ship will be involved in a near miss if the other ship sails into the arena. Target ship 1 is within the arena, which means that a near miss occurs between target ship 1 and the real ship. Target ship 2 is not in the arena, which means that no near miss occurs between target ship 2 and the real ship.
Arena and Fujii ship domain

Note that, in a scene of encounter, one ship is usually taken as the research object, which is defined as ‘own ship’, to analyse the relationship between it and other ships. In the model for detecting a near miss, real ship is setected as research object, so ‘own ship’ represents real ship. The model for detecting a near miss is described using Equations (3)–(6), where $\varphi$ is the heading of own ship; $Lo{n_{\textrm{real}}}$
 is the longitude of real own ship; $La{t_{\textrm{real}}}$
 is the latitude of real own ship;$\; Lo{n_{\textrm{assumed}}}$
 is the longitude of assumed own ship; $La{t_{\textrm{assumed}}}$
 is the latitude of assumed own ship; $Lo{n_{\textrm{target}}}$
 is the longitude of target ship; $La{t_{\textrm{target}}}$
 is the latitude of target ship; ${f_{\textrm{Arena}}} \le 0$
 represents own ship involved a near miss, and ${f_{\textrm{Arena}}} > 0$
 represents own ship not involved in a near miss.


2.3 Statistical model for near miss based on water grid method
The water grid method is usually used to study macroscopic collision risk based on geographical distribution (Qu et al., Reference Pietrzykowski, Siemianowicz and Wielgosz2011; Kim and Jeong, Reference Kaneko2016; Wu et al., Reference Wang, Meng, Xu and Wang2016). The advantage of the water grid method is that it organically combines the prediction model built by water traffic survey with the future prediction to form a new closed-loop risk assessment method for a port water traffic environment. To some extent, it avoids the superficial evaluation available by qualitative method, and has the characteristics of grid dynamics. According to the influence of different offshore distances on marine traffic, a certain water area is divided into several kinds of grid squares, whose size depends on the geographical location and size of the research object. The typical grid squares are divided into shoreline grid squares, near shore grid squares, far shore grid squares and open sea grid squares, and the squares become larger with the increase of offshore distance. In open waters, it is more convenient to study the collision risk of ships by dividing a certain water area into several grid squares with the same side length. This study divides the research water area into several grid squares having a side length of 2 nm. Because COLREGS stipulate that DCPA should not be <2 nm for the low visibility case (Fang et al., Reference Fang, Yu, Ke, Shaw and Peng2018), this study stipulates the basis for determining the grid size.
A single near miss is defined in this paper, which is the whole progress from target ship sailing into the arena of own ship to leaving it. However, a ship involved in a near miss often crosses multiple grid squares. If the whole process is recorded as a single near miss, it is difficult to determine to which grid square the scene of the near miss belongs. Moreover, the sampling frequency of AIS data affects the results of detection of scene of near miss, and can have a negative impact on marine traffic risk analysis (Goerlandt et al., Reference Goerlandt, Montewka, Lammi and Kujala2012). To solve the above problems, each gird square is regarded as an independent research object, and ship trajectory data with fixed sampling frequency are used to detect whether each ship is continuously involved in the same scene of near miss in this grid square. If it is, it should be recorded as a single near miss; if not, the number of near misses should be calculated according to the ship trajectory data. A ship trajectory in a single grid square is shown in Figure 4: the red point represents the trajectory point where the ship is involved in a near miss, and the green point represents the trajectory point where the ship is not involved in a near miss. It can be seen that the ship is involved in two scenes of near miss, one is between t 2 and t 3, the other is t 5 to t 7. Therefore, the number of scenes of near miss of this ship in this grid square should be recorded as two.
Ship trajectory in a single grid square

Based on the above, a statistical model for the scenes of near miss based on the water grid method is proposed. As shown in Figure 5, to illustrate the statistical method based on near miss in each grid square of this study, we assume that the red ship is in the centre of grid square #1, and maintains the heading at 45°; the green ship turns to the right; the red ship and the yellow ship are sailing at the same heading and speed during t 1 to t 2, whereas the yellow ship turns to the right after t 2.
Meeting of red ship, green ship and yellow ship
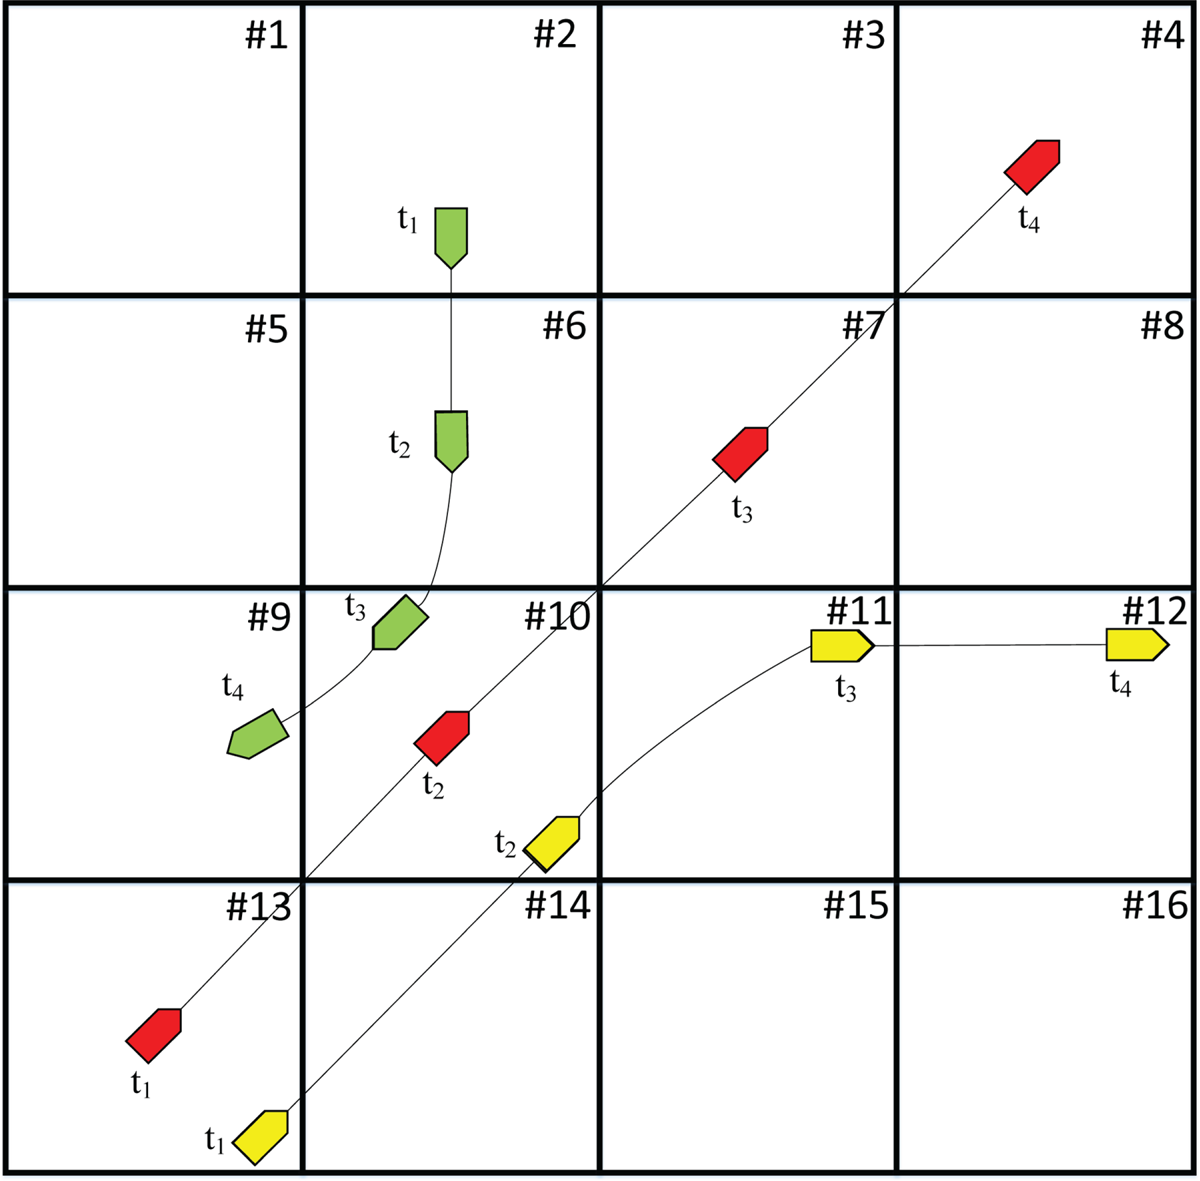
During the period from t 1 to t 4, the green ship sailed through the grid squares #2, #6, #9 and #10; the red ship sailed through the grid squares #4, #7, #10 and #13; and the yellow ship sailed through the grid squares #10, #11, #12, #13 and #14. The numbers of ships sailing through each grid square are shown in Table 3, where M represents the number of ships.
Number of ships sailing through each grid square

In encounter scenes, one ship is usually taken as the research object, which is defined as ‘own ship’, to analyse the relationship between it and other ships. For the ships involved in the same encounter, one ship can be selected as own ship, and the other ships are target ships. The scene in Figure 5 can be divided into three different senses according to different own ships: the red ship is selected as own ship, the green ship is selected as down ship, and the yellow ship is selected as own ship. The three senses are shown as Figures 6–8.
The red ship is selected as own ship

The green ship is selected as own ship

The yellow ship is selected as own ship

In Figure 6, the red ship and the yellow ship are sailing at the same heading and speed during t 1 to t 2, so the yellow ship remains in the red ship's arena until the yellow ship turns right to leave it after t 2. In grid square #13, the yellow ship is sailing in the red ship's arena, so the number of scenes of near miss in which the red ship was involved, is one in grid square #13. In grid square #10, both the yellow ship and the green ship are sailing in the red ship's arena, so near misses occur between the yellow and red ships and between the green and red ships, respectively. Therefore, the number of scenes of near miss in which the red ship was involved is two in grid square #10.
In Figure 7, the red ship entered the green ship's arena at t 2, and then the green ship turned right after t 2. The red ship left the green ship's arena before the green ship entered grid square #10. Therefore, the number of scenes of near miss in which the green ship involved is only one in grid square #6.
In Figure 8, the red ship and the yellow ship are sailing at the same heading and speed during t 1 to t 2, so the red ship remains in the yellow ship's arena until the yellow ship turns right to leave after t 2 in grid square #10. Therefore, the number of scenes of near miss in which the yellow ship was involved in grid square #10, #13, and #14 was one in all cases.
To sum up, the numbers of scenes of near miss in each grid square are shown in Table 4, where N is the number of near misses. Note that a ship should be considered to be in a certain grid square when the ship's position is on the right or upper boundary of this grid square, and the ship should not be considered to be in a certain grid square when the ship's position is on the left or lower boundary of this grid square. The flow chart of the statistical model for the scenes of near miss based on the water grid method is shown in Figure 9.
The flow chart of statistical model for near miss based on water grid method

Number of near misses occurring in each grid square

2.4 Macroscopic collision risk model based on near miss
Compared with the research of microscopic collision risk, the research and application of macroscopic collision risk is still at a very early stage, and the research methods used are mostly focused on statistical analysis. The research on macroscopic collision risk can be divided into the following four categories of macroscopic collision risk based on: collision frequency (Cockroft, Reference Cockroft1981, Reference Cockroft1982), encounter frequency (Goodwin, Reference Goodwin1978; Lewisson, Reference Le, Ding, Dong and Zhang1978; Kaneko, 1972), collision probability (Le et al., Reference Lappalainen, Vepsäläinen, Salmi and Tapaninen2011), or geographical distribution (Qu et al., Reference Pietrzykowski, Siemianowicz and Wielgosz2011; Goerlandt et al., Reference Goerlandt, Montewka, Lammi and Kujala2012; Zhang et al., Reference Zhang and Meng2015, Reference Zhang, Goerlandt, Montewka and Kujala2016; Kim and Jeong, Reference Kaneko2016; Yoo, Reference Wu, Mehta, Zaloom and Craig2018).
Generally, the number of marine traffic accidents and encounters that occur show the risk in certain waters; the larger the number, the higher the risk. However, there are few accidents, so accidents alone cannot fully show the marine traffic risk. On the other hand, long-distance encounters usually mean that there is no potential risk between two ships, so this method cannot accurately evaluate the marine traffic risk. In this study, all the scenes of potential risk encounters are detected, and treated as ‘near miss’.
There is no strong positive correlation between the marine traffic risk and the traffic flow, because waters with large traffic flow and small number of near misses should be considered as low marine traffic risk areas. Therefore, marine traffic risk is associated with traffic flow, the ratio of the number of near misses in the study water to the total number of ships is used as an index to evaluate the marine traffic risk, which represents the average number of near misses of each ship in the study water. The macroscopic collision risk model based on near miss is represented by macroscopic collision risk (MCR) which is concerned with the number of scenes of near miss and traffic flow. MCR is defined as follows:

where N is the number of scenes of near miss; M is the number of ships sailing through the water area.
Assume two groups of data in the same water: one is that the number of scenes of near miss is 10 and the number of ships is 100, and the other is that the number of scenes of near miss is 10 and the number of ships is 1,000. Considering only the number of scenes of near miss, the result of evaluating the marine traffic risk of the two groups should be the same. However, considering the factor of traffic flow, the number of ships in the first group is smaller, so the risk should be greater. Using this model to evaluate the marine traffic risk of the above example, the results are 0⋅1 and 0⋅01 respectively, which are more similar to the real marine traffic risk.
3. Experimental results and discussions
3.1 Data source and preprocessing
The analysed data is the period of one month from 1 January to 31 January 2017 in the Bohai Sea (118°E–119°E, 38⋅15°N–39⋅05°N). At that time, these waters contained a total of 4,497 ships, including cargo ships, fishing ships, oil tankers, tugs, passenger ships and other ships. Raw AIS data consists of millions of data points, with information given in Table 5. Because cooperative operation between merchant ships and engineering ships such as tugboats, water supply ships, and oil supply ships might be mistaken for near miss or collision. Similarly, coastal fishing ships, using trawls, stretch nets and purse nets, and trawlers must cooperate, and the fishermen's overall professionalism is relatively poor. Most fishing crew members have not received professional training or safety awareness training, and the fishing ship configuration is relatively backward, leading to certain special behaviours of coastal fishing ships. This study does not consider fishing ships, tugs, and other engineering ships, as well as ships in the waters of the harbour. Only cargo ships, oil tankers and passenger ships under navigation were selected for this study. After filtering, 2,936 trajectories are obtained, which include the information of 2,500 cargo ships, 415 oil tankers, and 21 passenger ships.
Main types of ships in study waters

In Figure 10, the time span presents the value of the difference between the earliest time point and the latest time point of AIS data of each ship's trajectory. Generally, the longer the time the ship sails, the more data it will send. However, there are some trajectories that have a large time span with small number of trajectory data. As can be seen from Figure 10, there are some trajectories with fewer than 500 data points and time span of more than 2,000,000 s. Such data can be considered unable to provide effective information. Therefore, it is necessary to segment the ship trajectory to ensure the correctness of the interpolation. The trajectory will be separated between the two points if the time interval between those two points is too long. The sub-trajectory data after segmentation will be deleted when it is too little to provide important information. In this paper, the time threshold of trajectory segmentation is set to 5 min according to expert knowledge. If the number of a single sub-trajectory data is less than three, it is considered unable to provide effective information, and then this trajectory should be deleted.
Statistics of the number of raw AIS data of each ship and time span of each ship

Goerlandt et al. believed that, for a given ship, the fixed sampling frequency of about 5 min is enough to roughly estimate the number of near misses (Goerlandt et al., Reference Goerlandt, Montewka, Lammi and Kujala2012). Generally, the higher the sample rate, the more accurate the data on ship motion characteristics. This necessitated the interpolation of raw AIS data according to a fixed sampling frequency of 1 min.
3.2 Results of detection of scenes of near miss in Bohai Sea
The distance of 6 nm between two ships is a factor to be considered for detecting the scenes of encounters in the study water. Three cases of experiment were conducted using AIS data from the Bohai Sea in January 2017. The first case is encounters, detecting the scenes of encounters that occurred between ships whose distance is less than 6 nm. The second case is detecting the scenes of near misses by the model based on the ‘arena’ concept. The third case is termed ‘Fujii ship domain invaded’, which detects the scenes of other target ships sailing into the own ship's Fujii ship domain, using the algorithm proposed by Goerlandt et al. (Reference Goerlandt, Montewka, Lammi and Kujala2012). Similar to the terms of a single near miss, a single encounter is defined as the whole progress of traffic state from the time of target ship sailing into the circle with a radius of 6 nm from own ship to the time of target ship leaving that circle, and a single ‘Fujii ship domain invaded’ is defined as the whole progress of traffic state from the time of target ship sailing into the Fujii ship domain of own ship to the time of target ship leaving it.
The models and algorithm are accomplished by Python and run on a PC with an Intel CORE i5 CPU and 12GB RAM. After the above steps, three AIS datasets are obtained, which are the datasets of the scenes of encounter, of the scenes of near miss, and of the scenes of Fujii ship domain invaded. The experimental results are shown in Table 6. The number of data of encounters is the largest, at 2,645,342, and the number of data of Fujii ship domain invaded is the smallest, at 2,420. The long-distance encounter could be considered as no traffic risk, and the number of data of encounters is much larger than that of near misses. Therefore, there are large quantities of data of scenes of long-distance encounters in the dataset, which are invalid for the analysis of marine traffic risk. The scenes of Fujii ship domain invaded are the most critical encounters, but the number of data of Fujii ship domain invaded is too small to show the marine traffic risk comprehensively. Consequently, the data of scenes of near miss can effectively support the comprehensive analysis marine traffic risk.
Three AIS datasets

In a scene of encounter between two ships, one ship which is usually taken as the research object is defined as ‘own ship’, and another ship is ‘target ship’. The scene of encounter between ship A and ship B is represented as A-B, where A is own ship and B is target ship. B-A means the encounter occurred between ship B which is own ship and ship A which is target ship. The ‘encounter’ of A-B occurs when the distance between ship A and ship B is less than 6 nm, the scene of near miss of A-B occurs when ship B sails into the arena of ship A, and the scene of Fujii ship domain invaded of A-B occurs when ship B sails into the Fujii ship domain of ship A. In this paper, the scenes of encounter, near miss, and Fujii ship domain invaded are divided according to the ship types of own ship and target ship, such as Cargo-Cargo, Tanker-Cargo, Cargo-Tanker, Tanker-Tanker, Cargo-Passenger, Passenger-Cargo, Tanker-Passenger, and Passenger-Tanker. For example, Tanker-Cargo means the scene occurred between two ships wherein own ship type is an oil tanker and target ship type is a cargo ship. The experimental results are shown in Tables 7 and 8, where OS and TS represent own ship and target ship respectively.
Number of the scenes of encounter, near miss, and Fujii ship domain invaded

Ratio of scenes of encounter, near miss, and Fujii ship domain invaded

It can be seen from Table 7 that the numbers of scenes of encounter, near miss, and Fujii ship domain invaded are 86,978, 44,604 and 699 respectively. The scenes of Fujii ship domain invaded provide too little data for analysis, especially the scenes of Cargo-Passenger, Passenger-Cargo, Tanker-Passenger, and Passenger-Tanker, the numbers of which are all less than 10.
From Tables 5, 7 and 8, because in the study waters most of the ships are cargo ships, the numbers of scenes of encounter, near miss, and Fujii ship domain invaded, occurring between two cargo ships, are 66,584, 35,670, and 590, respectively. The ratios are also the largest, at 76⋅55%, 79⋅97%, and 84⋅41%, respectively. The numbers of scenes of Cargo-Passenger, Tanker-Passenger, and Passenger-Tanker are all small and less than 612. Due to the high safety requirements for passenger ships, it is necessary to keep sufficient safety distance to ensure safety whether the passenger ship is own ship or target ship.
The volumes of data in the scenes of encounter and near miss are both so large that they can satisfy the requirements of analysing marine traffic risk. However, the number of the scenes of encounter is almost twice that of the scenes of near miss, and the difference value between them is 42,374. Therefore, there are 42,374 scenes of long-distance encounter considered as no risk encounters in the study area. Therefore, using the data of the scenes of long-distance encounter to analyse the marine traffic risk is inefficient and inaccurate. The data of scenes of near miss have higher research value for the marine traffic risk research.
3.3 Geographical distribution characteristics of marine traffic risk in Bohai Sea
The research water is divided into several grid squares with a length of 2 nm on each side, and 810 grid squares are obtained. The number of ships in each grid square in January 2017 were counted. The experimental results are shown in Figure 11 and the five grid squares with the most ships are shown in Table 9. Some with more than 1,000 were in grid squares #90–#250. There were ships in grid squares #251–#600, all had less than 400. The numbers in grid squares #1–#89 and #601–#810 were also low.
Number of ships in each grid square

The five grid squares with the most ships

The numbers of scenes of encounter, near miss, and Fujii ship domain invaded in each grid square were counted; the results are shown in Figure 12. The five grid squares with the most scenes of encounter, near miss, and Fujii ship domain in each grid square are shown in Tables 10–12, respectively. It can be seen that the numbers of each kind of scene in grid squares #300–#810 are all low and those in grid squares #90–#92 are all large, at more than 40, 3,000 and 9,000 respectively. Moreover, the five grid squares with the most scenes of Fujii ship domain invaded and near miss were the same ones, grid squares #90-#92, that were also the three grid squares with the most encounters. However, the other two grid squares with the most scenes of encounters were grid squares #194 and #195. In grid squares #110–#250, comparing the numbers of the three different scenes, the number of scenes of Fujii ship domain invaded was smaller than that of the other two kinds of scenes, especially encounters. This means that in grid squares #110–#250 the risk of near miss and encounter is higher than the risk of Fujii ship domain invaded.
Number of scenes of encounter, near miss, and Fujii ship domain invaded in each grid square

The five grid squares with the most scenes of Fujii ship domain invaded

The five grid squares with the most scenes of near miss

The five grid squares with the largest number of scenes of encounter

The geographical distribution of the scenes of Fujii ship domain invaded, near miss, and encounter are shown in Figures 13–15, respectively. The darker the colour, the higher the risk. The blue lines describe the southern waterway of Caofeidian. It appears from Figure 13, besides the high-risk grid squares in the waterway outside Tianjin port, that the risks of other grid squares are all low, which cannot show the marine traffic risk comprehensively.
Geographical distribution of scenes of Fujii ship domain invaded

Geographical distribution of scenes of near miss

Geographical distribution of scenes of encounter

Comparing Figures 14 and 15, the geographical distribution of the scenes of near miss and that of the scenes of encounters are similar. The high-risk grid squares are in the waterway outside Tianjin port, and the waterway to the south of Caofeidian port also has some risks. Figure 15 shows that the risk of waterway interchange to the south of Caofeidian port (grid squares #194 and #195) is very high, higher than that in Figure 14. Considering that some scenes of long-distance encounter without risk are detected in Figure 15, there are some scenes of no risk encounter in this waterway interchange. Therefore, the marine traffic risk shown in Figure 14 is inaccurate.
The number of scenes of near miss and the MCR in each grid squares are shown in Figure 16, and the five grid squares with the largest MCR are shown in Table 13. The risks in grid squares #90–#92 are still the highest in study waters, according to the geographical distribution MCR. Compared with the risk based on the number of the scenes of near miss, the risk based on MCR in grid squares #122–#123 is increasing. In grid squares #122 and #123, the number of scenes of near miss are 2,078 and 2,471, respectively, and the number of ships is 559 and 649, respectively. So the MCRs are 3⋅807396 and 3⋅717352, respectively. In grid squares #93–#124, the number of the scenes of near miss are 2,754 and 2,974, respectively, and the number of ships is 830 and 811, respectively. So the MCRs are 3⋅318072 and 3⋅667077, respectively. In gridsquares #122 and #123, the number of scenes of near miss is not the largest, but the number of ships is also small. Therefore, the average number of near misses per ship are large in grid squares #122 and #123, which means the marine traffic risks are high.
Number of near misses and MCR in each grid square

The five grid squares with the largest MCR

The geographical distribution of MCR is shown in Figure 17. Comparing Figures 14 and 17, the geographical distribution of the scenes of near miss and MCR are similar. The high-risk grid squares are in the waterway outside Tianjin port, and the waterway to the south of Caofeidian port also has some risks. Note that the grid squares in the waterway outside Huanghua port also have some risks in Figure 17, which is reliable, because of the large amount of ships and the complicated traffic situation caused by the busy traffic in the waterway outside Huanghua port. However, compared with Tianjin port, the largest port in the north of China, Huanghua port is still small, the traffic is not as busy as at Tianjian port, and the numbers of scenes of Fujii ship domain invaded, near miss, and encounter are all still small. The risks in the waterway outside Huanghua port are not shown by using the number of scenes of Fujii ship domain invaded, near miss, and encounter. The negative influences caused by the huge differences between ship flows on analysis of marine traffic risk may be the main factors. Therefore, compared with the geographical distribution of the scenes of Fujii ship domain invaded, near miss, and encounter, the geographical distribution of MCR shows the marine traffic risks more comprehensively.
Geographical distribution of scenes of MCR

4. Conclusions
Using non-accident information to analyse marine traffic risk can reduce some of the limitations of accident-based methods. There is still a lack of a common definition of near miss, or a widely accepted model used to detect scenes of near miss. To analyse the risks of marine traffic comprehensively, a model based on an arena for detecting scenes of near miss is provided, and then a MCR model based on near miss is proposed. To eliminate the negative impact of the sampling frequency of AIS data, a single near miss is defined as the whole progress of traffic state from the time of target ship sailing into the arena of own ship to the time of target ship leaving the arena of own ship. Finally, the geographical distribution characteristics of marine traffic risk in the Bohai Sea are obtained according to the results of MCR analysis. The marine traffic risk is high in the waterway outside Tianjin port, and the waterway to the south of Caofeidian port and the waterway outside Huanghua port also have some risks.
This model can be further refined by accounting for factors such as hydrometeorological conditions. The methods for studying marine traffic risk from temporal dimension perspective are also worthwhile. This paper provides a MCR model, which can show the marine traffic risk more comprehensively. The research findings can help ships’ officers to detect high potential risk scenes automatically and assistant researchers and marine traffic management agencies to improve the service quality of marine traffic safety guarantee.
Funding
This study is supported by the National Natural Science Foundation of China (Grant No. 41861144014, 41501490) and the Fundamental Research Funds for the Central Universities (Grant No. 3132019365).
Competing interests
None.



