Introduction
In an effort to increase the power of genetic association studies of psychiatric disorders, there is growing interest in the potential of intermediate phenotypes, often called endophenotypes (Almasy & Blangero, Reference Almasy and Blangero2001; Crosbie, Perusse, Barr, & Schachar, Reference Crosbie, Perusse, Barr and Schachar2008; Gottesman & Gould, Reference Gottesman and Gould2003). Endophenotypes are traits which reflect genetically mediated variation in the pathways linking genes to disease phenotypes. They are presumed to be closer to the action of genes than is the disease phenotype. Disease phenotype refers to those symptoms of the disease that are directly observable; endophenotypes are often less directly observable and may require special methods such as neuropsychological testing or imaging for measurement. Endophenotypes could be powerful tools in genetic research if they can identify a subset of disease-causing genes, point to genetically informative subgroups of affected individuals, or delineate genetically vulnerable individuals. Quantitative endophenotypes avoid assumptions about the appropriate threshold for disease diagnosis that are embedded in existing diagnostic algorithms (Lee et al., Reference Lee, Schachar, Chen, Ornstein, Charach, Barr and Ickowicz2008), permit the use of statistically powerful parametric analyses in genetic research, and inform the mechanism by which genetic risk, once identified, is translated into behavior (Merikangas & Risch, Reference Merikangas and Risch2003).
To be genetically informative, a valid endophenotype must distinguish individuals with a disease diagnosis from those without, differentiate those who are at genetic risk for disease such as unaffected relatives of individuals with the disorder from those who are not, and segregate in families with the phenotype. Although any measure could function as an endophenotype, it is advantageous if it is feasible given that genetic research is likely to require the study of a large number of participants often across multiple sites. Finally and critically, the endophenotype should be heritable. It is possible that there are multiple individual endophenotypes for any complex disorder, each one marking a subset of genetic risks and a unique pathway from genetic cause to phenotype. It is also possible that some endophenotypes are genetically related because they reflect common cognitive and neurobiological mechanisms. In these cases, combinations of endophenotypes could prove to be more genetically informative than any single measure in isolation.
Much research has focused on the role of executive functions as potential endophenotypes of neuropsychiatric disorders. Executive functions refer to a range of cognitive control capacities such as planning, performance monitoring, working memory, and response inhibition (Norman & Shallice, Reference Norman and Shallice1986). Executive functions play a crucial role in scheduling and optimizing subsidiary processes that are required to meet changing goals in a flexible manner (Mesulam, Reference Mesulam1998). Executive abilities depend upon partially overlapping and partially distinct neural, neurochemical, and genetic networks (Shallice & Burgess, Reference Shallice and Burgess1996). They play a critical role in normal development (Zelazo, Carter, Reznick, & Frye, Reference Zelazo, Carter, Reznick and Frye1997), in behavior (Logan, Schachar, & Tannock, Reference Logan, Schachar and Tannock1997; Young et al., Reference Young, Friedman, Miyake, Willcutt, Corley, Haberstick and Hewitt2009), and in various psychopathologies (Cannon & Keller, Reference Cannon and Keller2006; Crosbie et al., Reference Crosbie, Perusse, Barr and Schachar2008). Among the most studied of executive control endophenotypes in child psychopathology are response inhibition (the ability to stop a pre-potent response), response latency (the ability to prepare and execute a speeded motor response), and response variability (the ability to respond in a consistent manner) (Sergeant, Reference Sergeant2000). Response inhibition has been parsed into two major components: restraint and cancellation. Restraint comes into play when prepared responses are withheld pending further information such as a possible signal to stop a pending action; cancellation refers to withdrawal of an ongoing response. Restraint is akin to slowing down while driving in a residential neighborhood; cancellation is analogous to slamming on the brakes when someone runs onto the road. Restraint and cancellation are partially distinct, both anatomically (Band & Van Boxtel, Reference Band and Van Boxtel1999; Chambers et al., Reference Chambers, Bellgrove, Gould, English, Garavan, McNaught and Mattingley2007; Chevrier, Noseworthy, & Schachar, Reference Chevrier, Noseworthy and Schachar2007) and behaviorally (Schachar et al., Reference Schachar, Logan, Robaey, Chen, Ickowicz and Barr2007), and may involve frontal-subcortical networks (inferior prefrontal cortex, basal ganglia, and midbrain nuclei). They play a crucial role in movement (Band & Van Boxtel, Reference Band and Van Boxtel1999), normal development (Harnishfeger & Pope, Reference Harnishfeger and Pope1996; Williams, Ponesse, Schachar, Logan, & Tannock, Reference Williams, Ponesse, Schachar, Logan and Tannock1999), various neuropathologies, for example, Parkinson's disease and brain injury (Gauggel, Rieger, & Feghoff, Reference Gauggel, Rieger and Feghoff2004; Seiss & Praamstra, Reference Seiss and Praamstra2004), and several psychiatric disorders (e.g., attention deficit hyperactivity disorder [ADHD], schizophrenia, and obsessive-compulsive disorder [OCD]; Lipszyc & Schachar, Reference Lipszyc and Schachar2010; Crosbie et al., Reference Crosbie, Perusse, Barr and Schachar2008; Rommelse, Arias-Vasquez et al., Reference Rommelse, Arias-Vasquez, Altink, Buschgens, Fliers, Asherson and Franke2008).
Typically, cancellation is measured in the stop signal task (SST) and restraint in the go/no-go task (GNG). In both tasks, participants are asked to respond as quickly as possible on most trials, but to stop their responses if they can on a subset of trials when a stop signal is presented. However, the GNG and SST tasks differ in a critical way. In the GNG, the delay between presentation of the go and the stop signals is zero. Consequently, the GNG demands inhibition during response preparation. Accordingly, in the GNG task, the primary index of the ability to restrain a response is the probability of successful inhibition (or its inverse commission errors). In the SST, the stop signal follows the presentation of the go signal and is adjusted dynamically depending on whether a response is inhibited. As a result, the response will be under way when the stop signal appears. Therefore, the SST demands cancellation of an ongoing response. If a response is successfully inhibited, the delay is increased on the next stop trial, thereby increasing difficulty. If the participant fails to inhibit their response, the delay is shortened making it easier to inhibit on the next trial. Whether or not a response can be stopped is modeled as a function of the outcome of the race between response execution and inhibition processes; whichever process finishes first determines whether or not a response will be stopped. Given the assumptions of the race model (Verbruggen & Logan, Reference Verbruggen and Logan2008b), the latency of the inhibition process (known as stop signal reaction time, SSRT), which is otherwise not directly observable, can be estimated. For the current study, we developed a hybrid of the SST and GNG tasks in which half the stop signals appear after some delay as in the typical SST and half appear after zero delay as in the GNG task.
Family studies (Rommelse, Altink, Martin et al., Reference Rommelse, Altink, Martin, Buschgens, Buitelaar, Sergeant and Oosterlaan2008; Schachar et al., Reference Schachar, Crosbie, Barr, Ornstein, Kennedy, Malone and Pathare2005; Uebel et al., Reference Uebel, Albrecht, Asherson, Borger, Butler, Chen and Banaschewski2010) and a twin study (Friedman et al., Reference Friedman, Miyake, Young, Defries, Corley and Hewitt2008; Young et al., Reference Young, Friedman, Miyake, Willcutt, Corley, Haberstick and Hewitt2009) of cancellation indicate that it is a heritable trait (.48) which shares most of its genetic influence with performance on other measures of inhibition (e.g., antisaccade and Stroop tasks) and with disinhibited behavior. Kuntsi et al. (Reference Kuntsi, Rogers, Swinard, Borger, van der Meere, Rijsdijk and Asherson2006) estimated the heritability of restraint (commission errors) in the GNG task to be between 18 and 45%.
Longer and more variable responses are characteristic of various neuropathologies (Hetherington, Stuss, & Finlayson, Reference Hetherington, Stuss and Finlayson1996) and psychopathologies such as ADHD (Bidwell, Willcutt, Defries, & Pennington, Reference Bidwell, Willcutt, Defries and Pennington2007), autism (Townsend, Harris, & Courchesne, Reference Townsend, Harris and Courchesne1996), anxiety disorder, schizophrenia, and reading disability (Lipszyc & Schachar, Reference Lipszyc and Schachar2010). Twin studies, largely in adults, indicate genetic influences on reaction time and reaction time variability ranging from 30 to 50% (Finkel & McGue, Reference Finkel and McGue1998; Kuntsi et al., Reference Kuntsi, Rogers, Swinard, Borger, van der Meere, Rijsdijk and Asherson2006; Posthuma, Mulder, Boomsma, & de Geus, Reference Posthuma, Mulder, Boomsma and de Geus2002; Simonen, Videman, Battie, & Gibbons, Reference Simonen, Videman, Battie and Gibbons1998). Others have reported essentially no evidence of heritability for response variability (Finkel & McGue, Reference Finkel and McGue1998, Reference Finkel and McGue2007; Groot, de Sonneville, Stins, & Boomsma, Reference Groot, de Sonneville, Stins and Boomsma2004; Sanders et al., Reference Sanders, Joo, Almasy, Wood, Keshavan, Pogue-Geile and Nimgaonkar2006; Stins et al., Reference Stins, de Sonneville, Groot, Polderman, van Baal and Boomsma2005). Heritability of response latency and variability as measured in the stop task has not been reported.
Although supportive of the conclusion that restraint and cancellation are heritable, these studies leave several issues unresolved. The study by Friedman et al. (Reference Friedman, Miyake, Young, Defries, Corley and Hewitt2008) used a non-standard version of the stop task in which words were categorized as animal or non-animal, a variation that could affect performance. Moreover, the average age of participants in this study was 17 years, which is substantially older than is typical of children with most childhood psychiatric disorders such as ADHD. Finally, there has been no study of whether restraint and cancellation share genetic risk and whether response latency or variability measured in these tasks are heritable. Accordingly, the primary goal of this study was to apply behavioral genetic methods to estimate the genetic and environmental influences on inter-individual variability in two variants of response inhibition (restraint and cancellation), response latency and response variability. Given their possible cognitive and anatomical overlap, the study used multivariate methods to estimate the extent to which these executive abilities share genetic and environmental substrates. If executive function abilities have common genetic influences, they could be used individually or combined as endophenotypes in genetic research. The study used a task that incorporated stop signal and GNG trials in a single task to measure restraint and cancellation. We studied a cohort of 100-month-old twins to determine if these executive function measures are heritable in school-age children.
Method
Participants
The Quebec Newborn Twin Study (QNTS) is based on a representative sample of twins born between April 1995 and December 1998 in the Greater Montreal Area, Canada. Names, addresses, and phone numbers of all mothers of newborn twins were collected from the birth records of the Quebec Bureau of Statistics. Participating families were assessed yearly, starting when the children were 6 months old corrected for gestational age. Families were predominantly of European descent (84%), with the remainder of African (3%), Asian (2%), and other (2%) descent. Nine percent did not provide information on ethnicity. Severe neonatal and perinatal complications precluding participation in the 5 month assessment or an inability to communicate in either French or English as assessed during the initial telephone contact were the only exclusion criteria.
The maternal language of the parents was French for 71.9% of mothers and 72.3% of fathers, English for 9.9% of mothers and 8.8% of fathers, and another language for 19.2% of mothers and 18.9% of fathers. The average household income was around CAN $54,000, which is slightly above average for similar households in this geographic area at that time. Fourteen percent of mothers did not complete high school, 28% were high school graduates, 48% had some college education or graduated from college (9% did not provide any information regarding education). Eleven percent of fathers did not complete high school, 34% were high school graduates, and 39% had some college education or graduated from college (information was unavailable for 16% of fathers).
A total of 989 families were asked to join the QNTS; of these, 662 were assessed during the first wave of data collection. The average attrition rate from 6 to 84 months was −.05% per year, ranging between −.16% and +.20%. Only the twins who reached 100 months between April 2004 and October 2005 (n = 139 pairs) were assessed for the present study because of funding availability. Of these, the inhibition scores were available in 234 participants after removing extreme scores distributed in 131 pairs (only one twin was reliably tested in 28 pairs) (49.6% boys and 51.4% girls). Of these, 55 pairs (42%) were monozygotic (MZ) and 76 pairs (58%) were dizygotic (DZ). The mean age was 100.7 months (SD = 1.33). Data for latency and response variability were available for 267 individual twins (115 MZ and 152 DZ).
The families of the subsample of twins assessed at 100 months differed little from the original sample: the parents of the twins that were evaluated at 100 months were more likely to have French or English as their first language (mothers: χ 2 = 16.043, df = 1, p = .000; fathers: χ 2 = 16.609, df = 1, p = .000). Most of the missing data were missing by design. Missing status in participants was associated with one observed socio-demographic characteristic, but there was no reason to think that the missing values on the experimental measures would have been, if known, a non-random sub-sample of all the values for these measures. For this reason, the missing data were considered missing at random (MAR) (McKnight, McKnight, Sidani, & Figueredo, Reference McKnight, McKnight, Sidani and Figueredo2007). To maximize power, all available data were analyzed and the model parameters were estimated with the Full Information Maximum Likelihood (FIML) method. The FIML estimation procedure is implemented directly in the process of fitting a model; it treats missing data by fitting the model to all non-missing data for each observation (McCartney, Burchinal, & Bub, Reference McCartney, Burchinal and Bub2006). There is evidence that FIML results in unbiased parameter and standard error estimates (Graham, Reference Graham2009) and that it has more power than multiple imputation unless a great number of imputations are done (Graham, Olchowski, & Gilreath, Reference Graham, Olchowski and Gilreath2007). The downside of the FIML procedure is that a single N is not representative of the study sample. All the genetic models were estimated using the FIML method.
Hybrid-Stop Task
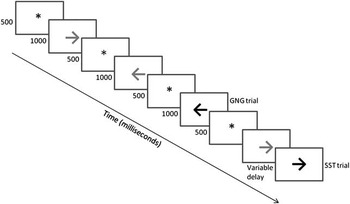
Response inhibition, response speed, and response variability were measured using a version of the SST known as the Hybrid Stop Task (HST) (Figure 1). The HST was designed to measure both restraint as in typical GNG tasks and cancellation as in typical SST in a single paradigm. Like the GNG and SST, the HST involved two types of trials (go and stop trials). Blue and black arrows (4 × 4.5 cm) presented for 500 ms were used as stimuli for the task. In go trials, participants are instructed to respond as quickly and accurately as possible with either a left or a right button press depending on the direction of a black arrow. On 50% of trials and at random, a blue arrow appeared instead of the black arrow instructing participants to stop their response on that trial if they could. There were two kinds of stop trials, no-go (GNG) and stop-signal (SST) trials, indicated by presentation of a blue arrow. In GNG trials, the blue arrow appeared at the same time as and instead of the go arrow thereby creating conditions typical of GNG tasks in which there is no delay between presentation of the go and the stop signal. In other words, the go arrow appeared in blue rather than black indicating that the participant should withhold their response on that trial. The primary index of inhibition in no-go trials was the percent of successfully inhibited trials (the inverse of commission errors) (% inhibition). In SST trials, the blue no-go arrow was presented after some variable stop-signal delay—the go arrow would appear in black and would change to blue after some variable delay creating a situation in which the subject would have initiated the response when the signal to stop was presented. A dynamic tracking algorithm was used to adjust the delay in SST trials. After an initial delay of 250 ms, stop signal delay was dynamically adjusted in 50 ms steps to converge on the delay at which individuals were able to stop 50% of the time. If the subject could successfully withhold their response, the program increased the delay by 50 ms, rendering the next stop trial more difficult. If the subject was unable to successfully inhibit his (her) responses following a stop signal, the program decreased the delay by 50 ms for the next stop trial, making the next stop trial easier. At the delay which allowed for 50% of trials to be stopped, the outcome of the race between the go response process and the stop process is tied on average allowing for an estimate of the latency of the inhibition process known as stop signal reaction time (SSRT) using the formula (SSRT = ū go RT – ū stop signal delay), where mean go reaction time was based on responses in trials when there was no stop signal and stop signal delay was the delay between presentation of go signal and presentation of the stop signal at which the probability of inhibition is .5 (Logan, Reference Logan1994). We excluded several participants with invalid task participation as is typical of stop task studies (e.g., probability of inhibition greater than 80% or less than 20% or error rates over 60%).
Hybrid Stop Signal Task (HST). Each trial began with a fixation dot in the middle of the screen for 500 ms followed by a go stimulus. The go stimulus was a blue arrow pointing either to the left (indicating a left hand response) or to the right (indicating a right hand response). The go stimuli remained on screen for 1000 ms; 50% of trials contained a stop signal (presentation of a black rather than a blue arrow). In no-go trials, the stop signal appeared instead of the go arrow. In stop-signal trials, the stop signal always appeared following some delay after the go signal. The stop signal indicated that the subject should not make the given response on that trial. Delay between go and stop signals was adaptively adjusted in stop signal trials to ensure that half of stop signal trials could not be stopped, despite the appearance of the stop signal. A blank screen occupied the remaining time between trials.

Stimuli were presented on a light gray background of a Dell TM 1800FP color monitor. Participants were instructed to respond with the hand indicated by the direction of the black arrow and to squeeze a strength gauge as quickly as possible in response to an arrow for the go trials (respond with the right hand to a right-pointing arrow and with the left hand to a left-pointing arrow), but to withhold the action for the no-go and stop signal trials (blue arrow). There were 64 trials per block and 5 blocks in total. Among the 320 trials, 50% were go trials (n = 160), 25% were no-go trials (n = 80), and 25% were stop-signal trials (n = 80). Between blocks, 20-s pauses were interspaced. Both the colors of arrows and the stimulus orders were randomized (i.e., for half the children, black indicated go while blue indicated no-go/stop-signal; for the other half, blue indicated go while black indicated no-go/stop signal trials). Presentation of arrow lasted for 500 ms, each trial lasted for 3 s, and the task was 18 min in duration. Soreni et al. (Reference Soreni, Crosbie, Ickowicz and Schachar2009) reported high test–retest reliability of SSRT (intra-class correlation [ICC] = 0.72), go RT (ICC = 0.62), and go RT SD (ICC = 0.74) over three test administrations separated by 1 week each. The study procedure was approved by the Institutions Research Ethics Board.
Analyses
We examined the common genetic and environmental etiology of response inhibition (in GNG and SST trials), go RT, and go RT SD using classic twin modeling estimated by structural equation modeling and decomposed the covariance of correlated measures into genetic and environmental components. This design is based on the comparison of the covariance between MZ and DZ twins for a given measure knowing that the genetic correlation is 1 between MZ twins and .5 on average between DZ twins. Formal analysis of twin data was conducted using the Mx package (Neale, Boker, Xie, & Maes, Reference Neale, Boker, Xie and Maes1999) to partition the variance of measures between additive genetic (A) and environmental sources (Plomin & Kosslyn, Reference Plomin and Kosslyn2001). The environmental variance was further decomposed to estimate the proportion of variance attributable to the common environment (C), which augments the similarity between twins regardless of zygosity, and to the unique environment (E), which makes twins of a pair more different (Turkheimer & Waldron, Reference Turkheimer and Waldron2000). For % inhibition in GNG trials, we applied a reflect-and-log transformation to correct for skewness and another reflect to restore the direction of the scale (Tabachnick & Fidell, Reference Tabachnick and Fidell1996, Reference Tabachnick and Fidell2007). We estimated multivariate models for pairs of variables that were significantly correlated; where there is no phenotypic correlation, genetic and environmental correlation would have to be non-significant as well.
Results
Descriptive Statistics
The means and standard deviations for response inhibition, variability, and latency are reported in Table 1 for all participants by zygosity type. There were no significant mean and variance differences between MZ and DZ twins. There was a significant mean difference in go RT between boys and girls (boys mean = 676.9 ms, girls mean = 720.6 ms, t(232) = −3.50, p = .001). Age was unrelated to the outcomes (the correlations ranged between r = −.05 and r = .06, all non-significant).
Descriptive statistics

Note. MZ = monozygotic twins; DZ = dizygotic twins; ICC = intra-class correlation; Go RT = go reaction time; Go RT SD = standard deviation of go reaction time; SSRT = stop signal reaction time; % inhibition = % successful inhibition; aICC for % inhibition based on transformed variables.
Genetic Modeling
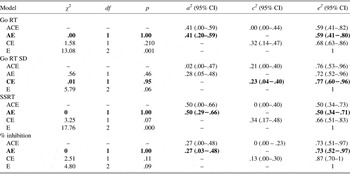
The difference between the intra-class correlations of MZ and DZ twins reported in Table 1 suggests that response inhibition (both % inhibition in GNG and SSRT in SST trials) and go RT were substantially heritable, but that go RT SD was not. The full ACE model (additive genes and common and unique environment model) showed an adequate fit when compared with a saturated model in all cases (SSRT: −2LL ratio = .028, df = 1, p = .64; go RT SD: −2LL ratio = .000, df = 1, p = 1.0; go RT: −2LL ratio = 2.04, df = 1, p = .153; % successful inhibition. We also tested three nested models: the AE model (additive genes and unique environment), CE model (common and unique environment), and the null E model (unique environment only).
The results of the univariate genetic models and nested models for % inhibition, SSRT, go RT SD, and go RT are reported in Table 2. In the case of SSRT, % inhibition and go RT, the common environment component could be removed without deteriorating the fit of the model compared with the full ACE model. The null model was rejected in the case of go RT and SSRT and close to rejection in the case of go RT SD and % inhibition. Although the CE model was not always formally rejected, probably because of low power, it showed more fit deterioration than the AE model when compared with the ACE model. Together, these results show that the AE model was the best and most parsimonious representation of the genetic and environmental etiology of the % inhibition, SSRT, and go RT.
ACE and nested models for stop task outcomes

Note. Best fitting model is shown in bold. ACE = additive genes and common and unique environment model; CI = confidence interval; AE = additive genes and unique environment model; CE = common and unique environment model; E = unique environment only model; Go RT = go reaction time; Go RT SD = standard deviation of go reaction time; SSRT = stop signal reaction time; % inhibition = % successful inhibition.
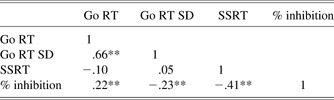
There was a significant correlation between % inhibition in GNG trials and SSRT in SST trials (−.41) (see Table 3). The best fitting bivariate model showed that the correlation between these two forms of inhibition was essentially genetic (Rg = −1); C and E could be omitted from the model without a drop in fit. The correlation between mean go RT and SSRT was −.10 and was too low to allow estimation of a model (all models included 0 in the confidence interval). The phenotypic correlation between go RT and % inhibition in GNG trials was .22 and could entirely be attributed to common genetic substrates (Rg = .58); C and E correlations could be omitted from the model without a drop in model fit.
Phenotypic correlations
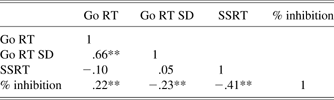
Note. Go RT = go reaction time; Go RT SD = standard deviation of go reaction time; SSRT = stop signal reaction time; % inhibition = % successful inhibition.
**p < .01; N = 234 except for the correlation between % inhibition and SSRT were N = 267.
Given that we found a significant difference of mean between boys and girls for the inhibition measures, we also tested a univariate genetic model with sex as a covariate for this outcome. The results were very similar to the simple ACE model (a 2 = .38, c 2 = .00, e 2 = .62). The sample size was too limited to test for sex-limited models where parameters are left to vary across sexes.
The ICC of go RT SD for MZ and DZ twins showed little family aggregation. Although the AE model was not formally rejected, the CE model showed the smallest deterioration of fit compared with the full ACE model. The null model was very close to rejection with a p of .06. We conclude from these results that, given the low power and small family aggregation, the CE model was the best and most parsimonious representation of the components of the variance in response variability. Go RT SD was correlated with % inhibition (−.23, p < .0001), but not with SSRT (−.01). Given that the etiology of go RT variability was CE and that of % inhibition was AE, the correlation could only be through E, which could reflect correlated error for these two measures.
The correlation between % inhibition and Go RT and Go RT SD were weak at .22 and −.23. With the relatively low power afforded by our sample, an attempt at modeling a three-variable model was inconclusive: we could not distinguish between the C and E effects and correlations.
Discussion
The goal of this study was to determine the extent to which individual differences in several executive functions were influenced by genetic factors. We focused on two components of motor response inhibition (restraint and cancellation),and on response latency and response variability because these indices of executive function are considered to be prime candidates for endophenotypes for several neuropsychiatric disorders. However, data have been lacking on whether or not these traits are influenced by common or specific genetic factors and on whether they are heritable in school-age children. Evidence that these executive functions are heritable is critical to support their utility in the search for the genetic underpinnings of cognition in general and of those psychopathologies such as ADHD, OCD, and schizophrenia that are associated with deficits in these abilities. We also wanted to determine if executive functions share genetic substrates to elucidate the genetics of executive processes.
Using an HST designed to measure response inhibition (restraint and cancellation) as well as response latency and variability in school-age children, we demonstrated that there are substantial genetic influences on inhibition and response latency. Approximately 50% of the variance in cancellation (stop signal reaction time), 40% of the variance in latency of the response, and 27% of the variance in restraint (% successful inhibition) was found to be genetic. By contrast, none of the variance in responses variability was genetic. The balance of the variance in inhibition (cancellation and restraint) and response latency was accounted for by non-shared environmental influences and possibly by error. Response variability was affected by shared environmental influences (23%) and by non-shared environmental risk or error (77%). Restraint as measured in GNG trials and cancellation as measured in the SST trials as well as restraint and response latency largely share their genetic origins. By contrast, we could not fit a model to the correlation between response cancellation (SSRT) and response latency and could not conclude that the two traits shared genetic influence. These results indicate that genetic factors influence some executive functions, in particular response inhibition and latency and, to a lesser extent, restraint. They also shed light on the biology of executive functions, indicating that there are common and separable genetic influences on aspects of executive functions.
The current estimate of heritability of response cancellation in the stop trials (SSRT) is quite consistent with previous results [.48; (Friedman et al., Reference Friedman, Miyake, Young, Defries, Corley and Hewitt2008)], even though samples differed in age (adolescents vs. school-age children) and the studies used different versions of the stop task. The observed correlation between restraint and cancellation (−.41) is consistent with previous cognitive (Verbruggen & Logan, Reference Verbruggen and Logan2008b) and neuroimaging (Rubia et al., Reference Rubia, Russell, Overmeyer, Brammer, Bullmore, Sharma and Taylor2001) research which showed that these two forms of inhibition may share cognitive processes, such as response-strategy adjustments on a trial-by-trial basis, priming of task goals, or the formation of stimulus-stop associations (Verbruggen & Logan, Reference Verbruggen and Logan2008a; Verbruggen, Schneider, & Logan, Reference Verbruggen, Schneider and Logan2008), and neural processes, such as development or function of prefrontal cortices, and fronto-subcortical networks upon which these processes depend (Aron & Poldrack, Reference Aron and Poldrack2005, Reference Aron and Poldrack2006; Aron, Robbins, & Poldrack, Reference Aron, Robbins and Poldrack2004; Chambers et al., Reference Chambers, Bellgrove, Stokes, Henderson, Garavan, Robertson and Mattingley2006, Reference Chambers, Bellgrove, Gould, English, Garavan, McNaught and Mattingley2007; Lenroot et al., Reference Lenroot, Schmitt, Ordaz, Wallace, Neale, Lerch and Giedd2009; Shaw et al., Reference Shaw, Eckstrand, Sharp, Blumenthal, Lerch, Greenstein and Rapoport2007, Reference Shaw, Kabani, Lerch, Eckstrand, Lenroot, Gogtay and Wise2008; van den Wildenberg et al., Reference van den Wildenberg, Burle, Vidal, van der Molen, Ridderinkhof and Hasbroucq2010).
Similarly, we observed a significant correlation between response latency and % response inhibition (.21), which indicates that participants with slower responses can inhibit their responses in GNG trials more easily than those with faster responses. This correlation was essentially explained by genetic influences indicating that restraint inhibition and response latency may also involve common processes. Both processes are active during go phases of tasks like the stop task, that is, while preparing and simultaneously withholding a response.
Previous studies found evidence that response variability is heritable when task pacing was rapid rather than slow, but not all circumstances such (Finkel & McGue, Reference Finkel and McGue1998; Kuntsi et al., Reference Kuntsi, Rogers, Swinard, Borger, van der Meere, Rijsdijk and Asherson2006; Posthuma et al., Reference Posthuma, Mulder, Boomsma and de Geus2002; Stins et al., Reference Stins, de Sonneville, Groot, Polderman, van Baal and Boomsma2005). The current study did not find response variability to be heritable (see also Finkel & McGue, Reference Finkel and McGue2007). The stop task differs in several critical ways from typical reaction time measures: dynamic tracking of the delay between presentation of the go and the stop signals may have constrained variability in go reaction time and influenced heritability. However, stop trials constitute only a minority of total trials in the HST and other stop task variants. Even though increased response variability is characteristic of several psychopathological conditions (Bidwell et al., Reference Bidwell, Willcutt, Defries and Pennington2007; Geurts et al., Reference Geurts, Grasman, Verte, Oosterlaan, Roeyers, van Kammen and Sergeant2008; Johnson et al., Reference Johnson, Kelly, Bellgrove, Barry, Cox, Gill and Robertson2007; Leth-Steensen, Elbaz, & Douglas, Reference Leth-Steensen, Elbaz and Douglas2000; Rommelse, Altink, Oosterlaan, et al., Reference Rommelse, Altink, Oosterlaan, Beem, Buschgens, Buitelaar and Sergeant2008; Vaurio, Simmonds, & Mostofsky, Reference Vaurio, Simmonds and Mostofsky2009), the current results counsel caution in concluding that response variation is heritable and, therefore, suitable as an endophenotype for genetic research. At the very least, the current results suggest that variability may itself be variable across tasks, with some indices of variability being more heritable than others. The matter would be worthy of further research.
Along with previous research (Friedman et al., Reference Friedman, Miyake, Young, Defries, Corley and Hewitt2008), the current evidence indicates that there is both genetic diversity and genetic uniformity among executive functions. At one level, there are genetic influences that affect all executive functions, for example, inhibition and processing speed. At other levels, there are genetic influences on clusters of processes such as inhibition and others that act on single measures such as restraint and on cancellation (Miyake et al., Reference Miyake, Friedman, Emerson, Witzki, Howerter and Wager2000; Young et al., Reference Young, Friedman, Miyake, Willcutt, Corley, Haberstick and Hewitt2009). Friedman et al. (Reference Friedman, Miyake, Young, Defries, Corley and Hewitt2008) estimated the heritability of a latent variable of inhibition derived from performance on the stop task, the Stroop task, and an anti-saccade task and found it to be nearly 100% heritable. As we did not have a third measure of response inhibition, we did not estimate a latent inhibition trait. However, we note that the correlation between restraint and cancellation inhibition observed in the current experiment (−.41) was greater than the correlation among the three inhibition measures in the Friedman et al. (Reference Friedman, Miyake, Young, Defries, Corley and Hewitt2008) study (.31 for SSRT in SST and anti-saccade task; .18 for SST and Stroop task), suggesting that inhibition measures are very likely to contribute to a latent inhibition construct. Processing speed as indexed by response latency appears to relate to more specific executive functions such as inhibition at the highest level of the executive function construct.
There are several potential limitations to this study, including the relatively small sample, single measurement occasion, and the possibility that shared genetic influences on restraint and cancellation were a function of the fact that these indices were derived from a single task. To assess the generality of the HST results, we tested a separate sample of 128 school-aged participants (58 with ADHD; 69 healthy controls) on three measures, that is, the HST, the GNG and the SST tasks, and found very high and significant correlation among all performance indices across tasks. Nevertheless, it would be helpful to confirm the current conclusions in a study which uses separate measures of restraint and cancellation. Low power and absence of phenotypic correlation among several measures precluded testing of genetic models for all four cognitive measures.
In conclusion, the current results add to the evidence about the validity of inhibition as a potential endophenotype by confirming that there are substantial genetic influences on response cancellation and on response restraint (Kuntsi et al., Reference Kuntsi, Rogers, Swinard, Borger, van der Meere, Rijsdijk and Asherson2006; Rommelse, Altink, Martin et al., Reference Rommelse, Altink, Martin, Buschgens, Buitelaar, Sergeant and Oosterlaan2008; Young et al., Reference Young, Friedman, Miyake, Willcutt, Corley, Haberstick and Hewitt2009). These increasingly validated putative endophenotypes could be used for the selection of individuals at the extremes of the trait (“extreme trait” or “selective genotyping”)—a particularly powerful design for detecting genetic association (Huang & Lin, Reference Huang and Lin2007; Van Gestel, Houwing-Duistermaat, Adolfsson, van Duijn, & Van Broeckhoven, Reference Van Gestel, Houwing-Duistermaat, Adolfsson, van Duijn and Van Broeckhoven2000). The approach has been successful in studies of cardiac disease and QT interval (Arking et al., Reference Arking, Pfeufer, Post, Kao, Newton-Cheh, Ikeda and Chakravarti2006), obesity (Herbert et al., Reference Herbert, Gerry, McQueen, Heid, Pfeufer, Illig and Christman2006), and fetal hemoglobin level (Menzel & Thein, Reference Menzel and Thein2009). Genotyping only a subset of extreme trait individuals is also cost-effective compared with genotyping all individuals in a large population sample. There are several other advantages of valid neuropsychological endophenotypes in genetic research. First, there is increased ease of collection of endophenotypes due to the greater availability of general population samples compared with clinically ascertained subjects. Second, neuropsychological measures such as the SST could prove useful in multisite studies given the ease with which they can be standardized in comparison to behavioral measures. And third, neuropsychological task performance can be linked directly to brain function via a range of imaging strategies.
Acknowledgments
This research was funded by grants from Canadian Institutes of Health Research MOP 64277, 44070, 74699, and NET-54016. The authors thank the staff, the twins, and their families for their enthusiastic support of our project. We are grateful to the parents of the twins in the Quebec Newborn Twin Study. We also thank Hélène Paradis and Bei Feng for their assistance in data management and preparation, and Jocelyn Malo for coordinating the data collection. This research was supported by grants awarded from Health Canada, the Social Sciences and Humanities Research Council of Canada (SSHRC), the Canadian Institutes of Health Research, the Canada Research Chair Program, the Fonds québécois de la recherche sur la société et la culture (FQRSC), the Québec Ministry of Health and Social Services, and the Fonds de la recherche en santé du Québec. There are no conflicts of interest to disclose.