
1. Introduction
Internal gravity waves are ubiquitous in the Earth's stratified oceans and atmosphere where they are often of sufficient amplitude to make nonlinear effects important. This manifests itself in different ways. Nonlinear interactions among internal waves cascade energy from large to small scales where energy is lost via wave breaking and mixing occurs. Horizontally propagating internal solitary-like waves (ISWs) in the ocean are commonly observed in coastal seas. They usually arise via the interaction of currents and topographic features. Two common mechanisms of this type are the nonlinear-dispersive evolution of internal waves of tidal frequency, called the internal tide, generated by tide–topography interactions, and the lee-wave generation mechanism, in which they form downstream of topographic features (Jackson, Da Silva & Jeans Reference Jackson, Da Silva and Jeans2012). ISWs are also observed in lakes where they form from the nonlinear-dispersive evolution of wind-driven internal seiches. They are easily generated in the laboratory using a lock–release method or by rapidly bringing a tilted tank to the horizontal (Michallet & Ivey Reference Michallet and Ivey1999; Horn et al. Reference Horn, Redekopp, Imberger and Ivey2000, Reference Horn, Imberger, Ivey and Redekopp2002). ISWs have been studied intensively in the field and in the laboratory and through the use of numerical simulations.
Weakly nonlinear theoretical models have often been used to model ISWs, the most common being the Korteweg–de Vries (KdV) equation which includes first-order nonlinear (quadratic) and dispersive corrections to a non-dispersive linear long-wave equation. Adding higher-order nonlinearity in the form of a cubic nonlinear term results in the Gardner equation
 \begin{equation} \eta_t + c_0\eta_x + \alpha \eta\eta_x + \alpha_1\eta^2\eta_x + \beta\eta_{xxx} = 0,\end{equation}
which is increasingly being used for modelling ISWs in the ocean because many observed waves are of sufficient amplitude to require the inclusion of higher-order nonlinear effects (Grimshaw et al. Reference Grimshaw, Pelinovsky, Talipova and Kurkin2004). Here  $x$ is the horizontal coordinate,
 $t$ is time,
 $c_0$, which we assume is positive, is the linear long-wave speed,
 $\alpha$ is the quadratic nonlinear coefficient,
 $\alpha _1$ is the cubic nonlinear coefficient and
 $\beta$ is the dispersion coefficient. Typically
 $\eta$ is the vertical displacement of an isopycnal although other choices (e.g. the surface current) are possible. When the cubic nonlinear coefficient
 $\alpha _1=0$ the Gardner equation reduces to the KdV equation and if the quadratic coefficient
 $\alpha = 0$ it reduces to the modified KdV (mKdV) equation. All three equations belong to the class of fully integrable nonlinear-dispersive wave equations, have soliton solutions and an inverse scattering transform (IST) (Pelinovsky & Grimshaw Reference Pelinovsky and Grimshaw1997; Slyunyaev Reference Slyunyaev2001). ISWs in the ocean are affected by rotational dispersion which results in the emittance of long trailing inertia-gravity waves which slowly drain energy from the ISWs. These inertia-gravity waves may be large enough to nonlinearly steepen and ultimately form a new packet of ISWs (Shimizu & Nakayama Reference Shimizu and Nakayama2017). ISWs in the ocean are also affected by horizontal variations in water depth, stratification and by background currents. The KdV and Gardner equations can be used to model these effects with additional terms.
The polarity of solitary wave solutions of the KdV equation is determined by the sign of the quadratic coefficient  $\alpha$. If
 $\alpha /c_0>0$, they are waves of elevation (i.e.
 $\eta \geqslant 0$), and if
 $\alpha /c_0<0$, they are waves of depression (
 $\eta \leqslant 0$). There is no limit on the wave amplitude: as the amplitude increases, ISWs narrow and their propagation speed increases.
With the addition of a cubic nonlinear term, the properties of the waves and, indeed, the form of the solutions change. If  $\alpha _1/c_0<0$, solitary waves of the same polarity predicted by the KdV equation exist, but they now have a limiting amplitude of
 $-\alpha /\alpha _1$. If the cubic coefficient has the opposite sign, the situation is quite different. Solitary waves of KdV polarity exist, again with no bounding amplitude, but in addition there is a new branch of solitary waves of opposite polarity. These waves also have no limiting maximum amplitude (in absolute value) but they do have a minimum amplitude of
 $-2\alpha /\alpha _1$. In addition to this second branch of solitary waves, the Gardner equation has a completely new type of solution called a breather (Talipova et al. Reference Talipova, Kurkina, Kurkin, Didenkulova and Pelinovsky2020). This new type of wave has the form of a propagating localized pulsating wave packet. These waves are the subject of this study. A popular theoretical model that has solitary waves of both polarities and breathers is the mKdV equation obtained when the quadratic coefficient
 $\alpha$ is equal to zero. This special case arises in symmetric stratifications under the Boussinesq approximation and these are the stratifications considered here. For the mKdV equation there is no minimum amplitude for solitary waves of either polarity.
There are many theoretical studies of breather solutions of the Gardner equation. Grimshaw, Pelinovsky & Talipova (Reference Grimshaw, Pelinovsky and Talipova1997) showed the existence of breathers when the cubic nonlinear term is positive and Talipova et al. (Reference Talipova, Pelinovsky, Lamb, Grimshaw and Holloway1999) showed that for symmetric three-layer stratifications under the Boussinesq approximation, the cubic coefficient is positive when the upper and lower layer thickness  $h$ satisfies the condition
 \begin{equation} \frac{h}{H} < \frac{9}{26}, \end{equation}
where  $H$ is the total water depth. Clarke et al. (Reference Clarke, Grimshaw, Miller, Pelinovsky and Talipova2000) illustrated the formation of various types of waves, including breathers, via direct numerical simulations of the mKdV equation. ISWs of both polarity and breather solutions interact nonlinearly with other waves but re-emerge with their original identities except for a phase shift (Chow, Grimshaw & Ding Reference Chow, Grimshaw and Ding2005).
Although there are no clear demonstrations of the existence of breathers in the ocean, Talipova et al. (Reference Talipova, Pelinovsky, Lamb, Grimshaw and Holloway1999) showed that there are many regions where the cubic coefficient is potentially positive (the cubic coefficient is not unique if  $\alpha \ne 0$ so there is some ambiguity regarding its value and sign; see Lamb & Yan (Reference Lamb and Yan1996)). Rouvinskaya et al. (Reference Rouvinskaya, Talipova, Kurkina, Soomere and Tyugin2015) suggested the possibility of the occurrence of breathers in the Baltic Sea. There has been some speculation that wave packets in numerical simulations of ISWs in the ocean may be breathers (Vlasenko & Stashchuk Reference Vlasenko and Stashchuk2015).
The Dubreil–Jacotin–Long (DJL) equation has been used to model fully nonlinear- dispersive waves of permanent form (Turkington, Eydeland & Wang Reference Turkington, Eydeland and Wang1991), including ISWs, however a similar equation for fully nonlinear-dispersive breathers does not exist. By fully nonlinear dispersive we mean solutions of the incompressible Euler equations with the Boussinesq approximation, however the latter approximation is not necessary. Unlike the KdV and Gardner equations, the DJL equation cannot be used to model waves that change shape (e.g. nonlinear steepening, wave interactions) nor can the effects of rotation, shoaling or dissipation, which act to change the shape of the wave, be incorporated. The DJL equation predicts that as the energy of an ISW increases a limiting amplitude is approached and the ISWs become broader and horizontally uniform in their centre (Lamb & Wan Reference Lamb and Wan1998). These waves are referred to as flat-crested waves. For a two-layer fluid with a sharp interface between the two layers the limiting amplitude is such that the interface is displaced to the mid-depth when the Boussinesq approximation is made (i.e. in the limit as the density jump across the interface goes to zero). Alternatively, under some conditions waves may form cores or become unstable to Kelvin–Helmholtz instabilities before flat-crested waves are attained (Lamb Reference Lamb2002; Lamb & Wilkie Reference Lamb and Wilkie2004). ISW solutions of the DJL equation of both polarities exist for some stratifications and, as predicted by the Gardner equation, one branch has a minimum amplitude. Numerical simulations have been used to show that ISW solutions of the DJL equation are not solitons: the interaction of two ISWs of the same polarity results in a slight change in their amplitudes and the generation of a train of small-amplitude waves (Lamb Reference Lamb2001). In stark contrast, the interaction of two ISWs of opposite polarity may result in large changes in amplitude and in the generation of multiple other waves (K.G. Lamb, in preparation).
Much less is known about breather interactions in fully nonlinear-dispersive systems. Lamb et al. (Reference Lamb, Polukhina, Talipova, Pelinovsky, Xiao and Kurkin2007) demonstrated the existence of breather-like solutions in a symmetric double pycnocline stratification by using the fully nonlinear incompressible Euler equations under the Boussinesq approximation (it is not clear that there is not weak continual radiation of small-amplitude waves that result in a slow loss of energy from the breather). This was supported by Nakayama & Lamb (Reference Nakayama and Lamb2020). They investigated breathers by using fully nonlinear FDI-3s internal wave equations, in which three non-dimensional parameters were used to study breathers in symmetric three-layer stratifications. These parameters are the non-dimensional thickness of the upper and lower layers (the thin layers) and two non-dimensional breather parameters,  $p$ and
 $q$, essentially corresponding to the wavelength and the amplitude of the breather. Simulations were initialized with theoretical breathers which then underwent an adjustment. They found that a critical depth exists that appears to limit the amplitude of breathers similarly to an internal solitary wave in a two-layer fluid. Moreover, breathers were revealed to propagate with less release of short internal waves when the amplitude is small and the interfaces are close to the critical depth.
The work referenced previously used symmetric three-layer stratifications. Some investigations have considered breathers in asymmetric stratifications. The generation of breathers in asymmetric three-layer stratifications by a shoaling mode-2 wave was studied numerically by Terletska et al. (Reference Terletska, Jung, Talipova, Maderich, Brovchenko and Grimshaw2016). Rouvinskaya et al. (Reference Rouvinskaya, Talipova, Kurkina, Soomere and Tyugin2015) investigated shoaling breathers and compared solutions of the Gardner equation, with an additional shoaling term, with fully nonlinear numerical simulations. Lobovikov et al. (Reference Lobovikov, Kurkina, Kurkin and Kokoulina2019) also undertook numerical simulations to investigate the shoaling of internal wave breathers from a symmetric stratification in deep water to an asymmetric stratification in shallow water and found that two breathers could form in the shallow water if the step was large enough. Energy was also transferred to small-amplitude trailing waves and reflected waves.
The interaction of breathers has been studied in the context of several different theoretical models. Didenkulova & Pelinovsky (Reference Didenkulova and Pelinovsky2020) investigated the interaction of internal wave breathers using the mKdV equation focusing on the effects of the relative phases of the two breathers. Zhang, Zhai & Wang (Reference Zhang, Zhai and Wang2012) showed that an overtaking collision of two breather solutions of the modified nonlinear Schrödinger equation might be elastic, although only one overtaking collision case was investigated. Kuetche (Reference Kuetche2015) also showed the possibility of the elastic collision of two overtaking breathers by using a nonlinear evolution equation to model waves in a barotropic relaxing gas. Wang et al. (Reference Wang, Li, Qi and Zhang2015) investigated the collision between a breather and long-lived rogue waves in optical fibers.
Although there have been many theoretical investigations of breathers there have only been a few numerical studies of breathers based on the full nonlinear governing equations and the authors are not aware of any laboratory investigations. Thus, there remains much to learn about fully nonlinear breathers. This study aims to partially address this shortcoming by investigating the interaction of two breathers in symmetric three-layer stratifications in the context of fully nonlinear numerical simulations, a problem which has not been explored previously.
This paper is organized as follows. In § 2 we review breather solutions of the Gardner equation for a symmetric stratification for which the quadratic nonlinear coefficient is zero. Section 3 describes our numerical approach and results of the numerical simulations are presented in § 4. They are discussed in more depth in § 5 and our findings are summarized in § 6.
2. Theoretical breathers in a symmetric three-layer fluid
In this section we briefly review breather solutions of the Gardner equation as we compare the breathers in our simulations with them. The theoretical breathers are also used to provide appropriate scalings of the nonlinear breathers.
The Gardner equation reduces to the mKdV equation when  $\alpha = 0$ and this is the case for the three-layer symmetric stratifications we consider here. These stratifications have equal upper and lower layer thickness
 $h$ and the same density jump
 $\Delta \rho$ across each interface (figure 1) as we make the Boussinesq approximation. The coefficients of the Gardner equation (1.1) are then
 $$\begin{gather} c_0 ={\pm} \sqrt{g' h }, \end{gather}$$
 $$\begin{gather}\alpha = 0, \end{gather}$$
 $$\begin{gather}\alpha_1 ={-}\frac{3c_0}{4h^2} \left( 13 - \frac{9H}{2h} \right), \end{gather}$$
 $$\begin{gather}\beta = \frac{c_0h}{4} \left( H - \frac{4h}{3} \right), \end{gather}$$
(Grimshaw et al. Reference Grimshaw, Pelinovsky and Talipova1997; Talipova et al. Reference Talipova, Pelinovsky, Lamb, Grimshaw and Holloway1999; Lamb et al. Reference Lamb, Polukhina, Talipova, Pelinovsky, Xiao and Kurkin2007) where  $H$ is the total water depth,
 $g' = ( \Delta \rho / \rho _0 ) g$ is reduced gravity with
 $g$ being the gravitational acceleration.
Schematic diagram of a three-layer fluid for theoretical solutions and FDI-3s. The upper and lower interface displacements are  $\eta _1$ and
 $\eta _2$, and
 $a_1$ and
 $a_2$ are the absolute values of the minimum of the upper-layer displacement and of the maximum of the lower-layer displacement.

We define
 \begin{equation} h_c = \tfrac{9}{26}H \approx 0.34615H \end{equation}
to be the critical thin-layer thickness. For the mKdV equation  $\alpha _1/c_0$ is positive when
 $h< h_c$ and negative when
 $h>h_c$ (Talipova et al. Reference Talipova, Pelinovsky, Lamb, Grimshaw and Holloway1999).
In the following breather solutions, we assume rightward-propagating waves ( $c_0>0$) and use a reference frame moving with the linear long-wave speed
 $c_0$. In this reference frame, breather solutions in the symmetric three-layer fluid have the form
 \begin{equation} \eta ={-}\frac{4qH}{\cosh \theta} \left[ \frac{\cos \varphi - \left( q/p \right) \sin \varphi \tanh \theta} {1 + \left( q/p \right)^2 \sin^2 \varphi \,{\rm sech}^2 \, \theta} \right], \end{equation}
where  $p$ and
 $q$ are the parameters of the breather, essentially corresponding to the wavelength of a breather and the envelope amplitude, and the ‘carrier’
 $\varphi$ and ‘envelope’
 $\theta$ phases are
 $$\begin{gather} \varphi = 2p\frac{x}{L} + 8p( p^2 - 3q^2 )\frac{t}{T} + \varphi_0, \end{gather}$$
 $$\begin{gather}\theta = 2q\frac{x}{L} + 8q( 3p^2 - q^2 )\frac{t}{T} + \theta_0, \end{gather}$$
 $$\begin{gather}L = \frac{1}{H} \sqrt{\frac{6\beta}{\alpha_1}}, \end{gather}$$
 $$\begin{gather}T = \frac{6}{\alpha_1 H^3} \sqrt{\frac{6\beta}{\alpha_1}} \end{gather}$$
(Nakayama & Lamb Reference Nakayama and Lamb2020). The amplitude of the breather is  $4qH$, and the envelope of the breather solution is
 \begin{equation} \eta_e ={-}\frac{4qH}{\cosh \theta}. \end{equation}
Following Nakayama & Lamb (Reference Nakayama and Lamb2020) we define the length of a breather as
 \begin{equation} \lambda_e = \frac{{\rm \pi} L}{2q}, \end{equation}
and the wavelength and period of a breather as
 $$\begin{gather} \lambda_b = \frac{{\rm \pi} L}{p}, \end{gather}$$
 $$\begin{gather}T_b = \frac{\rm \pi}{4p} \left| \frac{T}{3p^2-q^2} \right|. \end{gather}$$
The group velocity of the breather, from (2.8), is
 \begin{equation} V_{gr} ={-}\frac{c_0}{2} \left( \frac{H}{h} \right) ^2 \left( 13-\frac{9H}{2h} \right)(q^2-3p^2). \end{equation}
As  $\alpha _1>0$, i.e.
 $h< h_c$, the group velocity is positive if
 $|q|>\sqrt {3}|p|$ and negative if
 $|q|<\sqrt {3}|p|$ which means that the breather propagates faster/slower than the linear long-wave propagation speed, respectively.
3. FDI-3s and model set-up
For the numerical simulations, we solved the fully nonlinear and strongly dispersive internal wave equations in a three-layer system (FDI-3s) (Nakayama & Kakinuma Reference Nakayama and Kakinuma2010; Nakayama, Kakinuma & Tsuji Reference Nakayama, Kakinuma and Tsuji2019; Nakayama & Lamb Reference Nakayama and Lamb2020; Sakaguchi et al. Reference Sakaguchi, Nakayama, Vu, Komai and Nielsen2020; Nakayama & Tsuji Reference Nakayama and Tsuji2021; Nakayama et al. Reference Nakayama, Tani, Yoshimura and Fujita2022) (see also figure 1 and Appendix A). This model includes full nonlinearity but not full dispersion. See the cited papers for more details. The model is formulated in terms of velocity potentials in each layer which are obtained by solving a Poisson equation using the BI-CGSTAB method under Neumann boundary conditions. We consider solutions which are independent of  $y$, make the rigid lid approximation and apply the model as described in Nakayama & Lamb (Reference Nakayama and Lamb2020). There it was demonstrated that FDI-3s can reproduce breathers successfully by making comparisons with the theoretical solutions. Nakayama et al. (Reference Nakayama, Kakinuma and Tsuji2019) demonstrated the high accuracy of the FDI-2s (FDI equations for a two-layer system) by applying the two-layer shallow-water configuration of Koop & Butler (Reference Koop and Butler1981) and the deformation of internal solitary waves by Horn et al. (Reference Horn, Redekopp, Imberger and Ivey2000, Reference Horn, Imberger, Ivey and Redekopp2002).
A total water depth of  $H=1$ m is used and the grid resolution was 0.1 m and 0.2 m for breathers A and B, respectively. The time step was chosen to give a Courant–Friedrichs–Lewy condition of about 0.0020 based on the linear long-wave speed. The specific density difference across each interface was
 $\Delta \rho / \rho _0 = 0.01$. Initial displacements of the two interfaces were given by (2.6). This analytical solution of the mKdV equation is not a solution of the FDI-3s equations so an adjustment takes place. After this initial adjustment breathers emerged that ultimately interacted as the faster propagating breather overtook the more slowly propagating breather ahead of it. Nakayama & Lamb (Reference Nakayama and Lamb2020) found that when
 $|q|>\sqrt {3}|p|$, in which case theoretical breathers have positive
 $V_{gr}/c_0$, it is possible for the adjusted waves to have negative
 $V_{gr}/c_0$.
Here we consider 12 breathers with negative  $V_{gr}/c_0$ using two different values of
 $h/H$:
 $h/H=0.25$ (cases A
 $n$) and
 $h/H=0.30$ (cases B
 $n$) (table 1). Three values of
 $q$ and two values of
 $p$ are used. Note that the absolute value of
 $V_{gr}$ is larger for
 $p=0.05$ than for
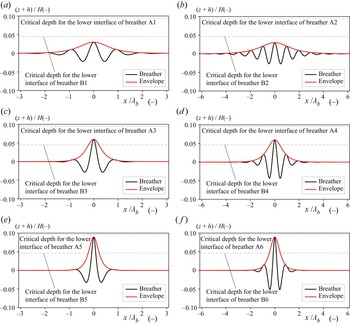
 $p=0.025$. The initial profiles of the lower interface for the 12 breathers are shown in figure 2 as a function of the normalized horizontal coordinate
 $x/\lambda _b$. With this normalization breathers A
 $n$ and B
 $n$ are identical for all
 $n$. In terms of
 $x$ the breathers with
 $p=0.05$ are twice as long as those with
 $p=0.025$.


Properties of analytical breathers used to initialize the simulations. The group velocity is in a reference frame moving with the linear long-wave propagation speed. The last column is the group velocity of the breather in the numerical simulations after the adjustment of the initial wave. Values are for waves propagating to the right with respect to the fluid.

When  $q$ is greater than 0.0115 in the B breathers (
 $h/H=0.30$), the lower interface crosses the critical depth
 $z = -H/2+h_c$. Therefore, we expect that breathers B3 to B6 undergo a rapid decrease in amplitude as they adjust to bring the interface below the critical depth (Nakayama & Lamb Reference Nakayama and Lamb2020). This is illustrated in figure 3 where the adjustments of breathers B2 and B5 are shown. The amplitude of breather B2 has not decreased by
 $t/T_b=2.0$, but the amplitude of breather B5 decreases such that the interface is below the critical depth. Breathers A1–A6 do not initially cross the critical depth.
Lower interfaces showing the adjustment of two initial B breathers ( $h/H = 0.30$): (a) breather B2 with
 $(q, p) = (0.0075, 0.05)$; (b) breather B5 with
 $(q, p) = (0.0225, 0.050)$.

We conducted 18 simulations of overtaking collisions of two breathers (tables 2 and 3). In the simulations the waves propagate leftward so the breather with the largest propagation speed  $(c_0+V_g)/c_0$ is initially to the right of the slower propagating breather. For example, in case A21 breather A1 with a wave speed of
 $(c_0+V_{gr})/c_o=0.928$ was initially to the right of breather A2 with the wave speed of
 $(c_0+V_{gr})/c_o=0.808$ (figure 4).
Initial lower interfaces for case A21. The wave speed of breather A1 is larger than that of breather A2.

Overtaking collisions for the A cases ( $h/H=0.25$).

Overtaking collisions for the B cases ( $h/H=0.30$).

4. Results
Breather solutions of the Gardner and mKdV equations behave like solitons. In particular, they interact with other waves, undergoing a phase shift in the process, while preserving their properties (e.g.  $p$ and
 $q$). By a phase shift, we mean a shift in their location relative to where they would be in the absence of an interaction. Here we show results from two series of simulations to investigate to what extent this is true of fully nonlinear breathers. If breathers in the numerical simulations behave like solitons, the breathers should be unaffected in amplitude and shape after they interact, although there can be a shift in location or phase.
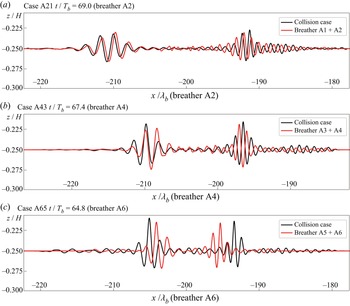
Case A21 is the smallest amplitude case with the interface furthest from the critical depth. Breather A1 propagates faster than breather A2 (figure 4). Figure 5(a) shows the waves after the interaction (black curve). We also conducted simulations with each breather individually. The results of these simulations are shown in red. The differences between the black and red curves indicates the effects of the interaction. In this case, after the interaction breathers A1 and A2 are slightly ahead and behind their locations in the absence of a collision but the shapes of the breathers are similar. The forward/backward shift of the faster/slower breather is similar to how solitons interact. These shifts occur for all the cases we have considered and are in agreement with simulations of breather interactions modelled by the mKdV equation. The agreement for cases A43 and A65 (figure 5b,c), which involve larger breathers, is still good. The most notable difference is larger shifts in their position, particularly for case A65 (figure 5c). Breathers A5 and A6 release large-amplitude short internal waves during their initial adjustment. The relative phases of the two breathers, which can be changed by varying the distance between the two initial breathers, may affect their interaction. An investigation of this is left for future work.
Lower interfaces after the overtaking collisions (black lines) with superimposed interfaces from simulations with each breather on its own (red lines): (a) case A21 ( $x$ and
 $t$ are normalized by breather A2); (b) case A43 (
 $x$ and
 $t$ are normalized by breather A4); (c) case A65 (
 $x$ and
 $t$ are normalized by breather A6).

Nakayama & Lamb (Reference Nakayama and Lamb2020) showed that for a given amplitude breathers in the stratification with  $h/H=0.30$ generally underwent less adjustment than those in the stratification with
 $h/H=0.25$, presumably because the ratio of the initial amplitude to the thin layer depth
 $h$ is relatively smaller for larger
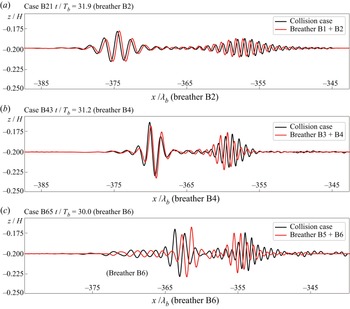
 $h/H$. The exception is when the displaced interface in the breather crossed the critical depth in which case the amplitude of the breather decreased rapidly until the displaced interface did not cross the critical depth. In case B21, which involves the two smallest B breathers, the two breathers are almost unaffected by their interaction (figure 6a) similar to case A21. The lag between breathers in the single and collision cases is smaller in case B21 than A21 suggesting weaker nonlinear effects. In contrast to the breather shapes, the phase shift was associated with the amplitude of the faster wave (figure 7). For example, the phase shift of case A25 was greater than of case A21 whereas breathers A1 and A5 propagated faster than breather A2. Therefore, the normalized phase shifts increase as the amplitude of the faster wave increases. In addition, the phase shifts were slightly smaller in case B than in case A.
Same as figure 5 but for cases (a) B21 ( $x$ and
 $t$ are normalized by breather B2); (b) B43 (
 $x$ and
 $t$ are normalized by breather B4); and (c) B65 (
 $x$ and
 $t$ are normalized by breather B6).

Phase shifts normalized by  $\lambda _b$ of the slower wave: (a) cases A21 to A65; (b) cases B21 to B65.

Breathers B3 to B6 cross the critical depth initially, and their amplitude undergoes a rapid initial adjustment with a decrease in amplitude before they interact with other breathers. The result of the interaction is shown in figures 6(b) and 6(c) for cases B43 and B65. Breathers B3 and B4 are smaller than breathers B5 and B6 (see figure 2) and, hence, undergo a smaller adjustment. Case B65 had a larger initial adjustment because both initial breathers crossed the critical depth. Their interaction results in relatively large position shifts.
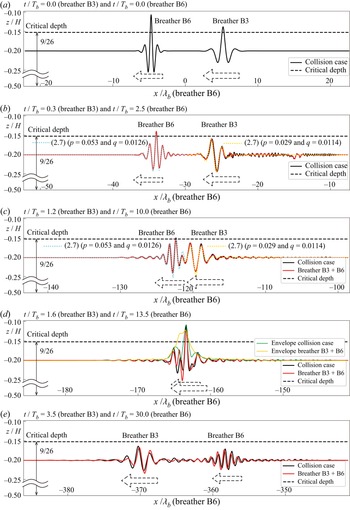
Case B63 is a case involving the interaction of a mid-amplitude breather overtaking a larger breather. Figure 8 shows the initial analytical breathers, the two adjusted breathers well before and immediately before the interaction, the interacting breathers and the final state after the interaction. The black curve shows results for the interaction case and the red curves show results of two separate simulations each with one of the two breathers. Before the interaction, the adjusted breathers were fit to theoretical solutions (2.6) (figure 8b). We found  $p=0.029$ and
 $q=0.0114$ for breather B3 (compared with the initial values of
 $0.025$ and
 $0.015$, respectively) and
 $p=0.053$ and
 $q=0.0126$ for breather B6 (initial values
 $0.05$ and
 $0.0225$) (figure 8c) indicative of significant amplitude decreases accompanied by only a minor change in wavelength. Note that Nakayama & Lamb (Reference Nakayama and Lamb2020) demonstrated that
 $p$ does not change a lot when breathers progress, and this study shows the same tendency. In contrast to the phase shift, the interaction was confirmed not to change the envelope amplitude by comparing the amplitude without overtaking collisions. In addition, the change of the wavelength of the breathers did not significantly change during the interaction, as predicted by the mKdV equation. Breather B3 overtakes breather B6, and the sum of the interface displacement for the single breather simulations fits the interaction simulation shape well (figure 8d). After the interaction, breather B6 is considerably smaller than it was before the interaction in both the interaction and single-breather simulations indicating that this decrease is a result of continued adjustment, not a result of the interaction (figure 8b,e).
Lower interface (black lines) in case B63. (a) Initial conditions. (b) After the initial wave adjustment and before the overtaking collision. (c) The beginning of the interaction. (d) Maximum interaction. (e) After the overtaking collision. Red lines show superimposed interfaces for the lower layer using breathers B3 and B6. Sky blue and yellow lines indicate the theoretical solution (2.6) adjusted to fit with collision case. The horizontal dashed line indicates the critical depth.

We compared the amplitudes of the two breathers before the interactions with the maximum envelope amplitude during the interaction. Intriguingly, the maximum envelope amplitude during the interaction was slightly larger than the maximum amplitude before the interaction in all cases.
The group velocity for breathers is a function of  $q$ when
 $h/H$ and the density difference are fixed, which yields the theoretical group velocity,
 $V_{grT}$, using the amplitude
 $a_H = 4qH$, as
 \begin{equation} V_{grT} ={-}\frac{c_0}{2} \left( \frac{H}{h} \right) ^2 \left( 13-\frac{9H}{2h} \right) \left\{ \left( \frac{a_H}{4 H} \right)^2-3p^2 \right\}. \end{equation}
Here  $a_H$ is the amplitude of the breather estimated from the envelopes obtained using the Hilbert transform. Note that
 $p$ was confirmed not to change in time, and we used the initial setting values of
 $p$ in (4.1) (Nakayama & Lamb Reference Nakayama and Lamb2020). Nakayama & Lamb (Reference Nakayama and Lamb2020) showed that the theory overestimates the group velocity compared with the numerical simulations when
 $h/H=0.25$ and
 $p=0.050$. They applied the initial values of
 $p$ and
 $q$ to compute the theoretical group velocities. However, here we use breather amplitudes in the numerical simulations to estimate the theoretical group velocity. Therefore, this study may provide a more direct comparison of the group velocity with theoretical solutions. In simulations with single breathers (cases A1 to A6 and B1 to B6), the computational group velocity agreed well with the theoretical solutions except for cases A2, A4 and A6 (
 $h/H=0.25$ and
 $p=0.050$; see figure 9a) for which the group velocity in the simulations are much less than the theoretical values. In case B5 of
 $h/H=0.30$, the group velocity was slightly larger than the theoretical solution. However, all other cases fit the theoretical solutions for
 $h/H=0.30$. Thus, for the stratifications considered here the group velocity of the theoretical solutions is better for
 $h/H=0.30$ than for
 $h/H=0.25$, i.e. when the ratio of the breather amplitude to the upper layer thickness is smaller and nonlinearity is weaker.
Comparisons between the theoretical and computational group velocities: (a) no overtaking collision cases; (b) overtaking collision cases. For example, ‘A1’ means breather A1 of case A21, A41 and A61. ‘B6 (B65)’ indicates breather B6 of case B65. These values are from after the collision.

For the collision cases, the group velocity of the breathers after the interaction were plotted against the theoretical solution for the adjusted breather using (4.1) (figure 9b). Each breather has three values (table 3); for example, breather A1 has values from cases A21, A41 and A61. For  $h/H=0.25$, the computational group velocities were smaller than the theoretical solutions when
 $p=0.050$, the same as for the no collision cases. In addition, the group velocity of breather A5 was slightly larger than the theoretical solution, as it was for breather A5 without a collision. Therefore, the overtaking collision may not affect the group velocity when
 $p=0.025$ for cases with
 $h/H=0.25$. For
 $h/H=0.30$, the computed group velocity of breather B5 was larger than the theoretical solutions as in the corresponding no-collision case. When
 $h/H=0.30$ and
 $p=0.050$, all cases agreed well with the theoretical solutions but the group velocity is slightly larger for breather B6 of case B65 (
 $h/H=0.30$ and
 $p=0.025$). This is one of the largest-amplitude cases (
 $q=0.0225$). Interestingly, in all cases the computational group velocities were equal to or larger than the theoretical solutions, excluding when
 $h/H=0.25$ and
 $p=0.050$ (breathers A2, A4 and A6).
We compare the group velocities in the collision cases with those in the non-collision cases in figure 10. For  $h/H=0.25$, although the computational group velocity of breathers A2, A4 and A6 were smaller than the theoretical solutions, there were no significant differences with and without an interaction (figure 10a). The collision affected breather A5 of cases A45 and A65 by increasing the group velocity compared with no-collision cases. For
 $h/H=0.30$, when the initial interface crosses critical depth by a large amount (breathers B5 and B6 of case B65 (
 $q=0.0225$), the group velocity after a collision was slightly larger than in the no collision case. However, for most collisions cases the group velocity was not effected. Therefore,
 $h/H=0.30$ may be more stable than
 $h/H=0.25$ when a collision occurs, provided that the initial interface does not cross the critical depth.
Group velocity with and without an overtaking collision: (a)  $h/H=0.25$; (b)
 $h/H=0.30$. Crosses are for cases with no collisions; triangles and circles indicate results from overtaking collisions with
 $p=0.025$ and
 $p=0.050$, respectively.

When  $h/H$ and the density difference are fixed, the normalized breather length
 $\lambda _e/H$ is a monotonically decreasing function of
 $q$, which can be estimated as
 $q = a_H/(4 H)$. We extracted two sets of wave amplitudes and breather lengths from the computational results from before and after the interactions. The theoretical solution shows that the larger the amplitude is, the shorter the length of the breather (Nakayama & Lamb Reference Nakayama and Lamb2020). The computational
 $\lambda _e/H$ agreed well with the theoretical solutions (figure 11).
Lengths of the breather. Solid lines indicate theoretical length of the breather. All marks correspond to after the interaction due to the overtaking collision finished.

5. Discussion
For the non-interaction cases, when  $h/H=0.25$ and
 $p=0.050$ (cases A2, A4 and A6), the computational values of
 $V_{gr}/c_0$ were 60–64 % of the theoretical solutions (table 1, figure 9). In contrast, when
 $h/H=0.30$ and
 $p=0.050$ (cases B2, B4 and B6), they were 94–110 % of the theoretical values, hence in good agreement with the theory. When
 $p=0.025$ for both
 $h/H=0.25$ and
 $h/H=0.30$ (cases A1, A3, A5, B1, B3 and B5), with the exception of B3, the computational
 $V_{gr}/c_0$ is larger than the theoretical values with the difference increasing with
 $q$ (table 1, figure 9). Therefore, when
 $h/H=0.30$ and
 $p=0.050$, the wave speed agrees with the theoretical solutions more than when
 $h/H=0.25$ or
 $p=0.025$, which is similar to Nakayama & Lamb (Reference Nakayama and Lamb2020). For the overtaking collision cases, the group velocities before and after the collision are similar when
 $h/H=0.30$ and
 $p=0.050$ (figure 9). In addition, cases B21, B43 and B65 were almost unaffected in shape and there was less deformation due to the overtaking collision than cases A21, A43 and A65 (figures 5 and 6). Therefore, this study may also suggest that breathers behave like ‘solitons’ for larger values of
 $h/H$ provided the interface does not cross the critical depth.
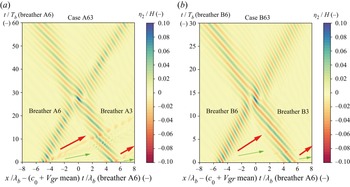
To illustrate the difference between two cases with  $h/H=0.25$ and
 $h/H=0.30$ due to the overtaking collision, we plot space and time contours of the upper interface for cases A63 (
 $h/H=0.25$) and B63 (
 $h/H=0.30$) (figure 12). These are the cases with the largest amplitudes when breathers are interacting. Two different types of short internal waves are clearly seen in case A63 (red and green arrows in figure 12a). The amplitude of waves indicated by the red arrow was larger those indicated by the green arrows. Nakayama & Lamb (Reference Nakayama and Lamb2020) revealed that more short dispersive waves are released from the initial breathers when
 $h/H=0.25$ than when
 $h/H=0.30$, presumably because the ratio of the initial amplitude to the thin layer depth is larger for smaller
 $h/H$, resulting in stronger adjustment. This is illustrated by the much smaller emitted short waves in case B63.
Space and time contour plot of the lower interface for (a) case A63 and (b) case B63 in a reference frame moving with the average group velocity of the two breathers. Horizontal coordinates are normalized by (a) case A6 and (b) case B6. The red and green arrows indicate propagating short waves emitted by the adjustment of the initial breathers. They are barely detectable in case B63.

We next consider the energetics of the breather interactions. The potential energy in the two interfaces and the kinetic energy in each of the three layers are (Nakayama & Lamb Reference Nakayama and Lamb2020) (note that the contributions from  $w_1^2$,
 $w_2^2$ and
 $w_3^2$ were missing from (2.25), (2.26) and (2.27) of Nakayama & Lamb (Reference Nakayama and Lamb2020), respectively)
 $$\begin{gather} PE_1 = \frac{1}{E_e} \int_{A} \frac{1}{2}g' \left( \eta_1 - \frac{h_2}{2} \right)^2 \, \textrm{d}\kern0.06em x, \end{gather}$$
 $$\begin{gather}PE_2 = \frac{1}{E_e} \int_{A} \frac{1}{2} g' \left( \eta_2 + \frac{h_2}{2} \right)^2 \, \textrm{d}\kern0.06em x, \end{gather}$$
 $$\begin{gather}KE_1 = \frac{1}{E_e} \int_{A} \int_{H/2-h+\eta_1}^{H/2} \frac{1}{2} \left( u_1^2 + w_1^2 \right) \,\textrm{d}z \,\textrm{d}\kern0.06em x, \end{gather}$$
 $$\begin{gather}KE_2 = \frac{1}{E_e} \int_{A} \int_{{-}H/2+h+\eta_2}^{H/2-h+\eta_1} \frac{1}{2} \left( u_2^2 + w_2^2 \right) \,\textrm{d}z \,\textrm{d}\kern0.06em x, \end{gather}$$
 $$\begin{gather}KE_3 = \frac{1}{E_e} \int_{A} \int_{{-}H/2}^{{-}H/2+h+\eta_2} \frac{1}{2} \left( u_3^2 + w_3^2 \right) \,\textrm{d}z \,\textrm{d}\kern0.06em x, \end{gather}$$
 $$\begin{gather}E_e = 8 g'qH^2L. \end{gather}$$
Here  $A$ is the whole numerical domain over the breathers.
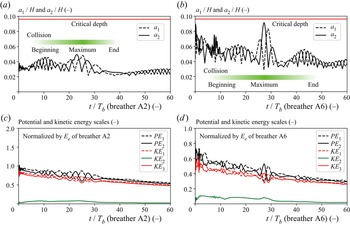
When  $h/H=0.25$, the upper and lower interfaces do not cross the critical depths for any of the breathers. Their maximum displacements towards the mid-depth,
 $a_1$ and
 $a_2$ respectively (see figure 1), exhibit short-period fluctuations in cases A21 and A63 (figure 13a,b). Nakayama & Lamb (Reference Nakayama and Lamb2020) found that breathers in stratification
 $h/H=0.25$ are more unstable than those for
 $h/H=0.30$, which may explain the short-period fluctuations that exist until
 $t/T_b=30$. Interestingly,
 $KE_2$ decreases rapidly after the collision (
 $t/T_b\approx 30$) (figure 13c,d). As the kinetic energy in the second layer,
 $KE_2$, should be zero for a theoretical weakly nonlinear breather, energy in
 $KE_2$ may provide evidence for the existence of mode 2 internal waves (Nakayama & Lamb Reference Nakayama and Lamb2020) or of higher-order nonlinear effects. An actual breather has some asymmetry between the interfaces due to the fact that upward displacement of the upper interface can be affected by the presence of the upper boundary whereas the upward displacement of the lower interface does not have the same geometric constraint. The rapid decrease in
 $KE_2$ corresponds to the middle of the interaction. To investigate the influence of short internal waves released for the adjustment, we conducted one simulation of a breather interaction using the adjusted breathers for case A63, i.e. by removing the released short internal waves prior to the interaction. This is the case which has the largest maximum breather-interaction amplitude and one of the largest phase shifts. This demonstrated that the short internal waves had no significant influence on the breather interaction, particularly on the forward/backward shift of the faster/slower breather and the reduction of the kinetic energy in the second layer after the overtaking collision.
Time series of  $a_1$ and
 $a_2$ in (a) case A21 and (b) case A63. Time series of potential and kinetic energy scales in (c) case A21 and (d) case A63. Horizontal coordinates are normalized by
 $T_b$ of case A2 (a,c) and case A6 (b,d). Green graduations show the significant period of collisions obtained from the shape of interfaces.

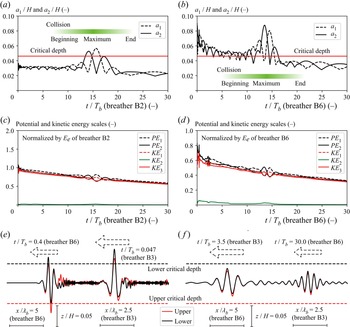
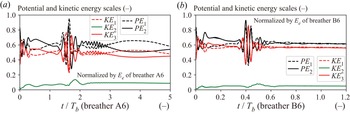
When  $h/H=0.30$, the interfaces cross the critical depth during the interaction in all cases, even if the initial waves do not (figure 14a,b). In case B21,
 $KE_2$ is almost zero before the collision which occurs at around
 $t/T_b=15$. Short-period fluctuations induce slightly larger
 $KE_2$ during the collision, before decreasing to almost zero again (
 $t/T_b>15$) (figure 14c). In case B63, the interfaces for both of the initial breathers cross the critical depth and
 $KE_2$ is non-zero until
 $t/T_b=15$ (figure 14d). Then
 $KE_2$ is almost zero after the collision (
 $t/T_b>15$). It appears that the overtaking collision results in the formation of more symmetric breathers (figure 14e, f). Larger
 $KE_2$ in case B63 than case B21 was considered to occur due to the critical-depth adjustment at the beginning stage in case B63. In addition, the potential and kinetic energy fluctuates less in cases B21 and B63 than in cases A21 and A65, which may also be evidence that a larger value of
 $h/H$ is more suitable for breather formation. The mode-two effect also becomes larger as the thickness of the upper and lower layers is decreased and by increasing
 $q$.
Time series of  $a_1$ and
 $a_2$ in (a) case B21 and (b) case B63. Time series of potential and kinetic energy scales in (c) case B21 and (d) case B63. Horizontal coordinates are normalized by
 $T_b$ of case B2 (a,c) and case B6 (b,d). Green graduations show the significant period of overtaking collisions obtained from the shape of interfaces. (e, f) Upper and lower interfaces for case B63: (e)
 $t/T_b=0.4$ (breather B6) and ( f)
 $t/T_b=30.0$ (breather B6). Red and black lines show the upper and lower interfaces.

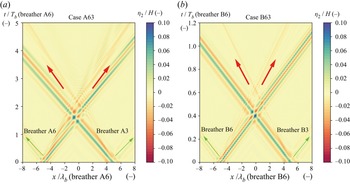
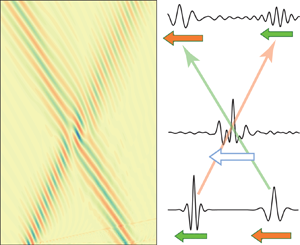
The time during which two breathers interact during an overtaking collision is much longer than during a head-on collision in which the breathers are propagating in opposite direction. Therefore, head-on collisions are expected to result in much weaker interactions. To investigate this, we conducted a head-on collision simulation using breathers A3 and A6 (case A63h) and breathers B3 and B6 (case B63h). The breathers with  $p=0.050$ (A6 and B6) are initially to the left of the breathers with
 $p=0.025$ (A3 and B3). In case A63h, the same small (green arrows) and large (red arrows) disturbances are emitted as for case A63 (figure 15a). Because we now use a non-moving reference frame we can see here that the small disturbance propagates in the oppose direction as the breather does while the large disturbance propagates in the same direction. The breathers seem to pass through each other without any deformation.
Space and time contour of the upper interface for (a) case A63h and (b) case B63h. Horizontal coordinates are normalized by (a) case A6 and (b) case B6. Reference frame did not move.

The normalized collision duration of case A63 was about  $20$, but the duration of case A63h was about
 $0.5$. The corresponding values for cases B63 and B63h was about
 $5$ and
 $0.1$, respectively. We also computed potential and kinetic energies for cases A63h and B63h (figure 16). More complicated and high-frequency fluctuations were found to occur during the collision in case A63h than in case A63 (figures 13d and 16a). Significantly,
 $KE_2$ became less in case A63 than in case A63h after the collision, suggesting that the head-on collision may have removed less of the mode-two structure than the overtaking collision (linear mode-one and mode-two waves having symmetric and anti-symmetric interface displacements). For
 $h/H=0.30$, the fluctuation during the collision in case B63h was confirmed to be larger than case B63 (figures 14d and 16b). After the collision,
 $KE_2$ of case B63 was much smaller than it was for case B63h. This could imply that fewer mode-two waves are emitted during a head-on collision than during an overtaking collision since the interaction times for the former are much smaller than for the latter.
Time series of potential and kinetic energy scales in (a) case A63h and (b) case B63h. Horizontal coordinates are normalized by  $T_b$ of (a) case A6 and (b) case B6.

6. Conclusion
Fully nonlinear numerical simulations of overtaking collisions of two breathers in a symmetric three-layer fluid have been investigated. The simulations were initialized with theoretical breather solutions of the mKdV equation. Because these are not exact solutions of the fully nonlinear equations an initial adjustment of the breathers occurs resulting in the shedding of small-amplitude waves. The adjustment is rapid if an initial interface passes through the critical depth (Nakayama & Lamb Reference Nakayama and Lamb2020). For small-amplitude breathers the superimposed shapes of the analytic breathers fit the wave shapes of the overtaking collision breathers. Cases with  $h/H=0.30$ were found to behave more like solitons than cases using
 $h/H=0.25$ as the breather shapes were less affected by the collisions in the former case (see figures 5 and 6). We attribute this to the smaller ratio of the breather amplitude to the upper/lower layer thickness
 $h$. For
 $h/H=0.25$, the large-amplitude breather collision cases showed larger phase shifts. The normalized phase shifts increased as the amplitude of the faster wave increased. When
 $h/H=0.30$, the breather collisions resulted in a similar phase shift as in the cases with
 $h/H=0.25$. The phase shifts were slightly smaller in case B than in case A. The superimposed analytic shapes were shown to fit the breather shapes well after the collision in cases with
 $h/H=0.30$, suggesting that an overtaking collision of two breathers is an almost elastic collision when the ratio of the breather amplitude to the upper/lower layer thickness is smaller. The energy analysis demonstrated that
 $KE_2$ decreased to almost zero after an overtaking collision, inferring that the collision removed mode-2 structure and played a great role in forming the symmetric internal waves, breathers. Furthermore, a head-on collision did not remove mode-2 structure due to the much smaller interaction times in head-on versus overtaking collisions.
Funding
This work was supported by the Japan Society for the Promotion of Science under grant 18KK0119, 22H01601 and 22H05726.
Data availability
The data that support the findings of this study are available from the corresponding author upon reasonable request.
Declaration of interests
The authors report no conflict of interest.
Author contributions
K.N. performed the simulations and performed all analyses. All authors contributed equally to reaching conclusions, and in writing the paper.
Appendix A
The FDI-3s equations are
 $$\begin{gather} \phi_i \left( x,z,t \right) = \sum_{X=0}^{N-1} Z_{i, X} \left( z \right) f_{i, X}(x,t), \end{gather}$$
 $$\begin{gather}Z_{i, X} = z^X, \end{gather}$$
(first layer)
 \begin{gather} - \zeta_1^\mu \frac{\partial \zeta_1}{\partial t} + \frac{1}{\mu+\nu+1} \boldsymbol{\nabla} \left[ \left\{ \left( h_1+\frac{h_2}{2} \right)^{\mu+\nu+1} - \zeta_1^{\mu+\nu+1} \right\} \boldsymbol{\nabla} f_{1,\mu} \right] \nonumber\\ - \frac{\mu \nu}{\mu+\nu-1} \left\{\left( h_1+\frac{h_2}{2} \right)^{\mu+\nu-1} - \zeta_1^{\mu+\nu-1} \right\} f_{1,\mu} = 0, \end{gather}
 $$\begin{gather} \zeta_1^\mu \frac{\partial f_{1,\mu}}{\partial t} + \frac{1}{2} \zeta_1^{\mu+\kappa} \boldsymbol{\nabla} f_{1,\mu} \boldsymbol{\nabla} f_{1,\kappa} + \frac{\mu \nu}{2} \zeta_1^{\mu+\kappa-2} f_{1,\mu} f_{1,\kappa}+ g \zeta_1 + \frac{p_1+P_1}{\rho_1} = 0, \end{gather}$$
 $$\begin{gather}P_1 ={-} \rho_1 g \left( h_1 + \frac{h_2}{2} \right), \end{gather}$$
(second layer)
 \begin{gather} \zeta_1^\mu \frac{\partial \zeta_1}{\partial t} - \zeta_2^\mu \frac{\partial \zeta_2}{\partial t} + \frac{1}{\mu+\nu+1} \boldsymbol{\nabla} \left\{(\zeta_1^{\mu+\nu+1} - \zeta_2^{\mu+\nu+1} ) \boldsymbol{\nabla} f_{2,\mu} \right\} \nonumber\\ - \frac{\mu \nu}{\mu+\nu-1} ( \zeta_1^{\mu+\nu-1} - \zeta_2^{\mu+\nu-1} ) f_{2,\mu} = 0, \end{gather}
 $$\begin{gather} \zeta_1^\mu \frac{\partial f_{2,\mu}}{\partial t} + \frac{1}{2} \zeta_1^{\mu+\kappa} \boldsymbol{\nabla} f_{2,\mu} \boldsymbol{\nabla} f_{2,\kappa} + \frac{\mu \nu}{2} \zeta_1^{\mu+\kappa-2} f_{2,\mu} f_{2,\kappa} + g \zeta_1 + \frac{p_1+P_2}{\rho_2} = 0, \end{gather}$$
 $$\begin{gather}\zeta_2^\mu \frac{\partial f_{2,\mu}}{\partial t} + \frac{1}{2} \zeta_2^{\mu+\kappa} \boldsymbol{\nabla} f_{2,\mu} \boldsymbol{\nabla} f_{2,\kappa} + \frac{\mu \nu}{2} \zeta_2^{\mu+\kappa-2} f_{2,\mu} f_{2,\kappa} + g \zeta_2 + \frac{p_2+P_2}{\rho_2} = 0, \end{gather}$$
 $$\begin{gather}P_2 ={-} \rho_1 g h_1 - \rho_2 g \frac{h_2}{2}, \end{gather}$$
(third layer)
 \begin{gather} \zeta_2^\mu \frac{\partial \zeta_2}{\partial t} + \frac{1}{\mu+\nu+1} \boldsymbol{\nabla} \left\{ \left( \zeta_2^{\mu+\nu+1} - b^{\mu+\nu+1} \right) \boldsymbol{\nabla} f_{3,\mu} \right\} \nonumber\\ - \frac{\mu \nu}{\mu+\nu-1} ( \zeta_2^{\mu+\nu-1} - b^{\mu+\nu-1} ) f_{3,\mu} = 0, \end{gather}
 $$\begin{gather} \zeta_2^\mu \frac{\partial f_{3,\mu}}{\partial t} + \frac{1}{2} \zeta_2^{\mu+\kappa} \boldsymbol{\nabla} f_{3,\mu} \boldsymbol{\nabla} f_{3,\kappa} + \frac{\mu \nu}{2} \zeta_2^{\mu+\kappa-2} f_{3,\mu} f_{3,\kappa} + g \zeta_2 + \frac{p_2+P_3}{\rho_3} = 0, \end{gather}$$
 $$\begin{gather}P_3 ={-} \rho_1 g h_1 - \rho_2 g h_2 + \rho_3 g \frac{h_2}{2}, \end{gather}$$
where  $\phi _i$ is the velocity potential in the
 $i{\rm th}$ layer (
 $i = 1$, 2 and 3),
 $\zeta _i$ is the interface level,
 $(u_i, v_i) = \boldsymbol {\nabla } \phi _i$ is the horizontal velocity field,
 $w_i = \partial \phi _i / \partial z$ is the vertical velocity,
 $\rho _{i}$ is the density,
 $p_{i-j}$ is the pressure at the density interface
 $j$,
 $j=0$ and
 $j=1$ correspond to the lower and upper density interfaces of the layer,
 $P_{i}$ is the average pressure in the layer,
 $\boldsymbol {\nabla } = (\partial / \partial x, \partial / \partial y)$ is the gradient operator in the horizontal plane,
 $f_{i, X}$ is the coefficient for the velocity potential in the
 $i{\rm th}$ layer,
 $N$ is the total number of an expanded function,
 $\mu =1,2,\ldots,N$,
 $\nu =1,2,\ldots,N$ and
 $\kappa =1,2,\ldots,N$.