

Introduction
Rice, Oryza sativa L. (Poaceae), is the staple food for 2.7 billion people in 39 countries. Among various biotic constraints for rice production, insect pests are important. The brown planthopper (BPH), Nilaparvata lugens (Stål) (Homoptera: Delphacidae), is a typical phloem sap feeder that has gained significant pest status in several of the rice-growing Asian countries. Both nymphs and adults suck phloem sap from leaf sheaths, which results in yellowing of leaves, reduced tillering, reduced plant height, and increased number of unfilled grains. Populations of BPH rapidly increase and cause hopper burn, thus killing plants in large areas. Even with moderate populations, researchers have reported a significant yield loss (up to 60%) in susceptible cultivars in recent years across Asia (Chen and Cheng, Reference Chen and Cheng1978; Normile, Reference Normile2008; Heong and Hardy, Reference Heong and Hardy2009; Prasannakumar et al., Reference Prasannakumar, Chander, Sahoo and Gupta2013). BPH also transmits virus diseases, such as grassy stunt, ragged stunt (Ling et al., Reference Ling, Tiongco and Aguiero1978), and wilted stunt (Chen et al., Reference Chen, Ko and Chiu1978).
BPH is a troublesome pest to manage, and timely detection of its incidence through regular monitoring is crucial to effective pest management. Experts recommend many insecticides for the control of this insect (Sarao, Reference Sarao2015), but the additional application of insecticides for its control disrupts the ecological balance and can lead to pest resurgence. This pest has a propensity for developing resistance to multiple classes of insecticides (Gorman et al., Reference Gorman, Liu, Denholm, Brüggen and Nauen2008; Matsumura and Sanada-Morimura, Reference Matsumura and Sanada-Morimura2010). Cultivation of resistant varieties is an efficient and an environmentally sound strategy for management of this insect (Song et al., Reference Song, Qiang, Liu, Xu and Liu2002). Breeding rice varieties with genes that differ in mechanisms of resistance will provide a reliable and broad spectrum of resistance against BPH. Such varieties will also help in conserving natural enemies, increasing their effectiveness (Gurr et al., Reference Gurr, Liu, Read, Catindig, Cheng, Lan and Heong2011) and minimising the number of pesticide applications (Panda and Khush, Reference Panda and Khush1995; Sharma, Reference Sharma2007).
Many methods have been employed to evaluate BPH resistance in rice (Alam and Cohen, Reference Alam and Cohen1998; Huang et al., Reference Huang, He, Shu, Li and Zhang2001; Hao et al., Reference Hao, Liu, Wang, Chen, Tang, Du, Zhu and He2008; Brar et al., Reference Brar, Virk, Jena, Khush, Heong and Hardy2009; Myint et al., Reference Myint, Hideshi, Masami and Masaya2009; Qiu et al., Reference Qiu, Guo, Jing, Zhu and He2010; Ali et al., Reference Ali, Alghamdi, Begum, Anwar Uddin, Alam and Huang2012). However, most studies relating to the identification of the most critical genes conferring BPH resistance have been based on damage score in standard seedbox screening tests (SSST). No detailed studies about different parameters of antibiosis have been published to compare simultaneously diverse genotypes with varying levels of resistance. Such studies are necessary to identify the genetic variability among resistant genotypes, which ultimately, can lead to the identification of resistance genes with diverse mechanisms. The present study was conducted to quantify antibiosis levels of resistance in nine different rice genotypes with diverse genetic backgrounds.
Materials and methods
Rearing of BPH colony
The colony of BPH was raised from a population collected from rice fields in Jand village and from the Punjab Agricultural University (PAU) campus, Ludhiana, Punjab, India. It was raised on 30-day-old TN1 rice plants under glasshouse conditions at the Rice Research Laboratories of the Department of Plant Breeding and Genetics, PAU, Ludhiana (30o 54′ N and 75o 48′ E) as per the protocol developed by Heinrichs et al. (Reference Heinrichs, Medrano and Rapusas1985). Insects were reared in cages at 28 ± 2 °C, 75 ± 5% RH and 14:10 h light: dark photoperiod. For obtaining neonate nymphs, newly emerged male and female adults were paired and released on 30-day-old potted TN1 plants under a conical cage (0.45 × 0.20 × 0.15 m, circular iron frame cage covered with nylon mesh) for oviposition. Eggs were monitored for the emergence of nymphs.
Raising test genotypes
The seeds of nine rice genotypes, namely, RP2068-18-3-5, Rathu Heenati, Sinnasivappu, MR1523, MO1, ARC10550, INRC3021, Ptb33, and TN1 were received from the Indian Institute of Rice Research, Hyderabad, India. During the wet season of 2010 and 2011, the seeds of test genotypes were soaked in Petri dishes and excess water removed after 24 h. Pre-germinated seeds of the test genotypes were sown in pots or trays containing well-puddled soil. All the test plants were raised in an insect-proof glasshouse. Irrigation and fertiliser were applied at 3- and 10-day intervals, respectively, to keep plants healthy. All experiments were repeated twice, each time with three replicates. Five 30-day-old plants of each genotype were in each replicate except for seed box screening tests. The mean of these five plants in each replicate was used for data analysis.
Seed box screening/damage score
Damage in each line was scored on a scale of 0–9 following the Standard Evaluation System (SES) of rice (IRRI, 1996). Each genotype was scored on an individual plant basis as 0 = no visible damage, 1 = partial yellowing of first leaf, 3 = first and second leaves of most plants partially yellowing, 5 = pronounced yellowing and stunting or about half of the plants wilting or dead, 7 = more than half the plants wilting or dead and remaining plants severely stunted, and 9 = all plants wilted and dead. Each genotype was graded based on SES where genotypes with a mean score of 0–3.49, 3.50–5.49, and 5.50–9.00 were designated as resistant, moderately resistant, and susceptible, respectively (Heinrichs et al., Reference Heinrichs, Medrano and Rapusas1985).
Honeydew excretion
Feeding rate of BPH adults on each genotype was assessed according to Heinrichs et al. (Reference Heinrichs, Medrano and Rapusas1985). Circular pieces of Whatman filter paper No. 1 were prepared with a small hole in the centre and a longitudinal cut from margin to the central hole. Papers were treated with Bromocresol Green powder mixed in ethanol, and dried in the shade before being dipped again in the solution to obtain an orange colour. The stem of test plants was passed through the hole in a plastic plate placed on the rim of the pot and then the treated filter paper was spread around the stem on the plastic plate. A glass chimney was placed over the plant while resting on the plate. The upper end of the chimney was secured with a piece of muslin cloth held in place with a rubber band/thread to prevent escape of BPH. Care was taken to prevent the treated paper getting wet through direct contact with the plant. Five 1-day-old BPH females starved for 2 hr were released into the chimney and allowed to feed on the plant for 24 h. The insect honeydew when dropped onto the filter paper created a blue spot. The paper was removed after 24 hr and spots were delineated on a tracing paper and then measured using mm square graph paper. The total area of all the spots was determined and expressed as mm2 of honeydew excreted by five females. The area of honeydew excretion was used as the parameter to assess feeding activity, which provides a reliable index for determining resistance and susceptibility of a genotype to homopteran pests.
Nymphal emergence and unfertilised eggs
For determining fecundity and fertility of BPH on test genotypes, five newly emerged female and male adults were caged on 30-day-old plants with Mylar cages. Adults were removed after 10 days. Nymphs hatching from eggs were counted daily and removed. When eggs stopped hatching, plants were dissected under a stereo binocular microscope to count and record the unfertilised eggs, which was then expressed as the percentage of total eggs, taking count of nymphs as fertile eggs.
Nymphal survival (%) and nymphal development period (days)
In another set of experiments, 30-day-old plants of the test genotypes were individually covered with Mylar cages and 10 early instar hopper nymphs were released on each genotype. Plants were observed daily, and the number of adults emerging from nymphs gave the nymphal survival percentage (Heinrichs et al., Reference Heinrichs, Medrano and Rapusas1985). For the nymphal development period, daily observations were recorded on the moulting of nymphs until they reached adulthood.
Adult population: sex and female wing type
In another study, 30 early instar nymphs were released on 30-day-old plants of test genotypes in the Mylar cages to record number of emerging adults, their sex, and wing morph. Sex ratio and percentage of macropterous females were calculated.
Growth index
Growth index of each test variety was calculated by dividing the nymphal survival percentage with nymphal development period recorded in the earlier experiment.
Data analysis
The data obtained from various experiments were analysed using analysis of variance with the help of IRRI STAT developed by International Rice Research Institute, Biometrics Unit, Philippines. All data were checked for normality before being analysed. Data that lacked normality were transformed using arcsine and square-root transformations. Different treatment means were identified using the least significant difference test (LSD) at P = 0.05 (Gomez and Gomez, Reference Gomez and Gomez1984). Pearson's correlation coefficient was used as a measure of the relationship between different study parameters. Multiple stepwise regression was performed using the forward selection method. This was performed by using damage score as the dependent variable, and different study parameters as the independent variables. Further linear relationship was studied between damage score and three parameters, namely number of nymphs hatched from eggs, percent nymphal survival, and percentage of brachypterous females.
Results and Discussion
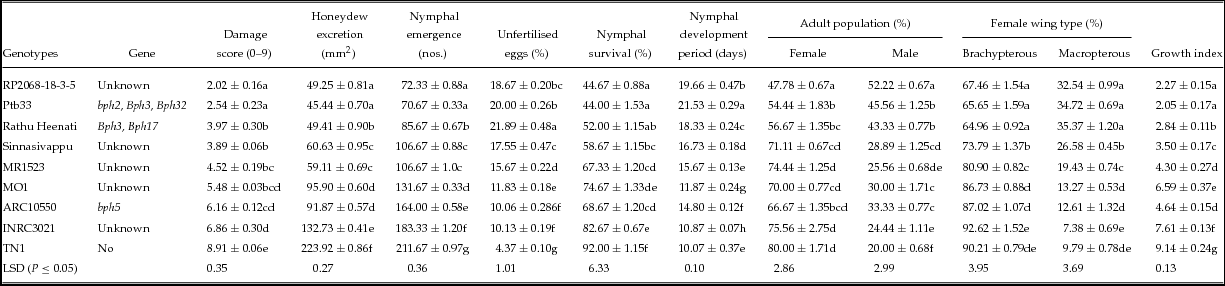
Nine test genotypes differed significantly amongst themselves in all the nine parameters under study (Table 1). Several types of tests were done to reveal different components of resistance (Panda and Heinrichs, Reference Panda and Heinrichs1983; Heinrichs et al., Reference Heinrichs, Medrano and Rapusas1985; Geethanjali et al., Reference Geethanjali, Kadirvel, Gunathilagaraj and Maheswaran2009). Such a range of tests aimed to identify novel and diverse sources of BPH resistance.
Reaction of rice genotypes to Nilaparvata lugens (mean ± SE)

Means with the same letter are not significantly different (P = 0.05).
Seedbox screening/damage score
Damage score differed significantly among different genotypes (F8,18 = 14.80, P ≤ 0.001), and ranged from 2.02 to 8.91 (Table 1). We recorded significantly lower scores of 2.02 and 2.54 for the RP2068-18-3-5 and Ptb33 in comparison with other test genotypes. Rathu Heenati, Sinnasivappu, MR1523, and MOI showed average damage scores ranging from 3.97 to 5.48 that were not significantly different within the group. These two groups could be considered resistant and moderately resistant to BPH. TN1 showed the highest damage score of 8.91 with susceptibility reaction (Table 1).
Among different methods to evaluate BPH resistance in rice, the SSST is the most widely adopted one (Paguia et al., Reference Paguia, Pathak and Heinrichs1980; Alam and Cohen, Reference Alam and Cohen1998; Sun et al., Reference Sun, Su, Wang, Zhai and Wan2005; Hao et al., Reference Hao, Liu, Wang, Chen, Tang, Du, Zhu and He2008; Myint et al., Reference Myint, Hideshi, Masami and Masaya2009; Kumar and Tiwari, Reference Kumar and Tiwari2010; Li et al., Reference Li, Chen, Wang, Liu, Shang and Hua2011; Nanthakumar et al., Reference Nanthakumar, Jhansi Lakshmi, Shashi Bhushan, Balachandran and Mohan2012, Fujita et al., Reference Fujita, Kohli and Horgan2013; Sarao et al., Reference Sarao, Sahi, Neelam, Mangat, Patra and Singh2016). This test mainly measures the plant response to nymphal feeding and preference in free choice setup. The test is relatively subjective regarding the time of scoring the entries with damage noted in the susceptible check line TN1. Ideally, one needs to score the test entries precisely when susceptible plants display 90% plant mortality, neither early nor late. Despite the subjectivity, this method has been widely adopted in reporting new sources of BPH resistance (Chelliah et al., Reference Chelliah, Velusamy, Heinrichs and Murugesan1981; Veronica and Kalode, Reference Veronica and Kalode1983; Pophaly and Rana, Reference Pophaly and Rana1995; Reddy and Misra, Reference Reddy and Misra1995; Huang et al., Reference Huang, He, Shu, Li and Zhang2001; Du et al., Reference Du, Zhang, Liu, Hu, Wei, Shi, He, Zhu, Chen, Han and He2009; Directorate of Rice Research, 2011, 2012; Sai Harini et al., Reference Sai Harini, Sai Kumar, Balaravi, Sharma, Ayyappa Dass and Shenoy2013; Sarao et al., Reference Sarao, Kaur, Bentur, Chakravarthy, Ashok Kumar, Verghese and Thyagaraj2013) and on inheritance of resistance (Khush and Brar, Reference Khush and Brar1991; Sun et al., Reference Sun, Su, Wang, Zhai and Wan2005). The reasons for using the standard seedbox-screening test are because it is a simple method, is less time consuming and one can process a large volume of data using the method.
Honeydew excretion studies
The area of honeydew excretion on test lines varied from 45.44 to 223.92 mm2 and differed significantly among genotypes (F8,18 = 874.37, P ≤ 0.001). The least area of honeydew excretion was in Ptb33 and RP2068, while the highest was in TN1 (Table 1). Amount of honeydew excreted by BPH is a useful criterion for assessing its feeding response and for grading resistance or susceptibility of the genotype. This test often complements the SSST (Paguia et al., Reference Paguia, Pathak and Heinrichs1980; Pophaly and Rana, Reference Pophaly and Rana1995; Reddy and Misra, Reference Reddy and Misra1995; Du et al., Reference Du, Zhang, Liu, Hu, Wei, Shi, He, Zhu, Chen, Han and He2009; He et al., Reference He, Liu, Liu, Jiang, Wu, Kang, Liu, Chen, Liu, Cheng and Wan2013). It is mainly targeted to measure adult female response to feeding under a no-choice setup and is more consistent (and less subjective) than SSST. Ling and Weilin (Reference Ling and Weilin2016) have demonstrated that the resistance level of rice varieties to BPH is associated with particular combinations of several plant metabolites that inhibit feeding by BPH. Sogawa (Reference Sogawa1982) reports on elaborate studies on feeding physiology of BPH using electropenetrogram (Ghaffar et al., Reference Ghaffar, Pritchard and Ford-Lloyd2011) that attempt to explain why the planthopper cannot sustainably feed on resistant plants. Horgan (Reference Horgan, Heong and Hardy2009) infers that experts associate resistance with phloem sap composition and chemistry, plant surface chemistry, volatiles, and inducible responses to planthopper attack. The resistance mechanism could be as a result of either diet-related primary metabolites or defence-related secondary metabolites/volatile or plant-surface characteristics, or both.
Nymphal emergence and unfertilised eggs (%)
The number of nymphs emerging on test plants ranged from 70.67 to 211.67, differing significantly among genotypes (F8,18 = 362.94, P ≤ 0.001), being lowest in Ptb33 and highest in TN1 (Table 1). Percentage of unfertilised eggs differed significantly among different genotypes (F8,18 = 217.88, P ≤ 0.001), and was highest in Rathu Heenati followed by Ptb33, RP2068-18-3-5, and Sinnasivappu, with TN1 again showing the least percentage (Table 1). The sum of the number of nymphs emerged, and the unfertilised eggs represent fecundity. Although the ovicidal effect of resistant japonica cultivars like Asominori against white-backed planthopper (WBPH) are reported, and responsible genes are well characterised (Yamasaki et al., Reference Yamasaki, Yoshimura and Yasui2003), such effects are not well known for BPH. This component of resistance needs to be further studied.
Nymphal survival
Nymphal survival differed significantly among different genotypes (F8,18 = 26.57, P ≤ 0.001) and the average survival ranged from 44 to 92% (Table 1). Significantly lower nymphal survival was observed on Ptb33 and RP2068-18-3-5 followed by Rathu Heenati and Sinnasivappu (Table 1). Testing the nymphal survival is the most direct way of measuring the antibiotic component of host plant resistance. It is significant to note that, even on the most resistant line, survival has been reported to be in the range of 30–50% (Reddy and Misra, Reference Reddy and Misra1995; Du et al., Reference Du, Zhang, Liu, Hu, Wei, Shi, He, Zhu, Chen, Han and He2009; Qiu et al., Reference Qiu, Guo, Jing, Zhu and He2010, Reference Qiu, Guo, Jing, Tang, Zhu and He2011; He et al., Reference He, Liu, Liu, Jiang, Wu, Kang, Liu, Chen, Liu, Cheng and Wan2013) and rarely nil (Myint et al., Reference Myint, Hideshi, Masami and Masaya2009). This survival rate is suggestive of lack of acute toxins as antibiotic factors in rice against BPH. However, in case of gall midge resistance in rice, feeding maggots were killed within 48 hr in resistant cultivars, while no mortality was seen on susceptible lines (Bentur et al., Reference Bentur, Rawat, Divya, Sinha, Agarrwal, Atray and Nair2016).
Nymphal developmental period
Nymphal developmental period differed significantly among different genotypes (F8,18 = 212.94, P ≤ 0.001) and it ranged from 10.07 to 21.53 days (Table 1). Longest nymphal development periods were observed on Ptb33, RP2068-18-3-5, and Rathu Heenati, whereas development was shortest on TN1 (Table 1).
Sex ratio
Female emergence as a percentage of the total also differed significantly among different genotypes (F8,18 = 47.31, P ≤ 0.001). Fewer females emerged from RP2068-18-3-5 followed by those from Ptb33 and Rathu Heenati (Table 1). Another influence of plant resistance was seen in the distorted sex ratio reported earlier for both BPH and WBPH, for which it was observed that a higher percentage of males was produced on the resistant genotypes than on the susceptible ones (Vaidya and Kalode, Reference Vaidya and Kalode1982; Velusamy, Reference Velusamy1982; Alagar and Suresh, Reference Alagar and Suresh2007; Thamarai and Soundararajan, Reference Thamarai and Soundararajan2017). While the phenomenon needs further investigation at the molecular level, its effect on pest population dynamics is critical.
The proportion of macropterous females
The percentage of macropterous females differed significantly among the genotypes (F8,18 = 42.75, P ≤ 0.001). More macropterous females emerged on Rathu Heenati (35.37%), Ptb33 (34.72%), and RP 2068-18-3-5 (32.54%) than on the other rice genotypes (Table 1). An increase in the proportion of macropterous forms of adults in response to crowding, plant senescence, and deteriorating food quality is an evolutionarily adaptative phenomenon in rice planthoppers with a history of long-range migration. Resistant genotypes also induce macropterous forms (Alagar and Suresh, Reference Alagar and Suresh2007), possibly due to their poor food quality (Saxena et al., Reference Saxena, Okech and Liquido1981).
Growth index
The growth index differed significantly among different genotypes (F8,18 = 130.57, P ≤ 0.001). Significantly lower growth indices were seen on Ptb33 and RP2068-18-3-5 followed by Rathu Heenati and Sinnasivappu (Table 1). Population growth under no-choice experiments is yet another direct measurement of plant resistance influencing the entire life cycle of the pest. This index computes the adverse influence of a plant on insect survival and development rate. Several studies on planthoppers (Gunathilagaraj and Chelliah, Reference Gunathilagaraj and Chelliah1985; Khan and Saxena, Reference Khan and Saxena1985; Saxena and Okech, Reference Saxena and Okech1985; Du et al., Reference Du, Zhang, Liu, Hu, Wei, Shi, He, Zhu, Chen, Han and He2009) have also included both these parameters.
Correlation analysis among resistance parameters
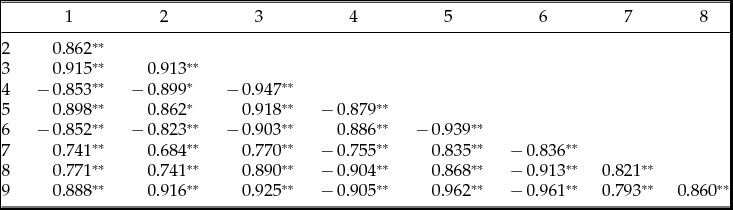
Damage score of the tested genotypes was correlated with other antibiosis parameters (Table 2). Damage score was positively and significantly correlated (r-value ranged from 0.741 to 0.915) with honeydew excretion, nymphal emergence, percent nymphal survival, female population build-up, the proportion of brachypterous females, and growth index (Table 2). Damage score was also negatively and significantly correlated (r-value ranged from −0.852 to −0.853) with unfertilised eggs and nymphal development period (Table 2).
Pearson correlation coefficient among different resistance parameters against Nilaparvata lugens

**P<0.01; 1 = damage score; 2 = honey dew excretion; 3 = nymphal emergence; 4 = Unfertilised eggs; 5 = nymphal survival; 6 = nymphal development period; 7 = female population; 8 = brachypterous female; 9 = growth index.
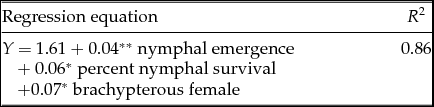
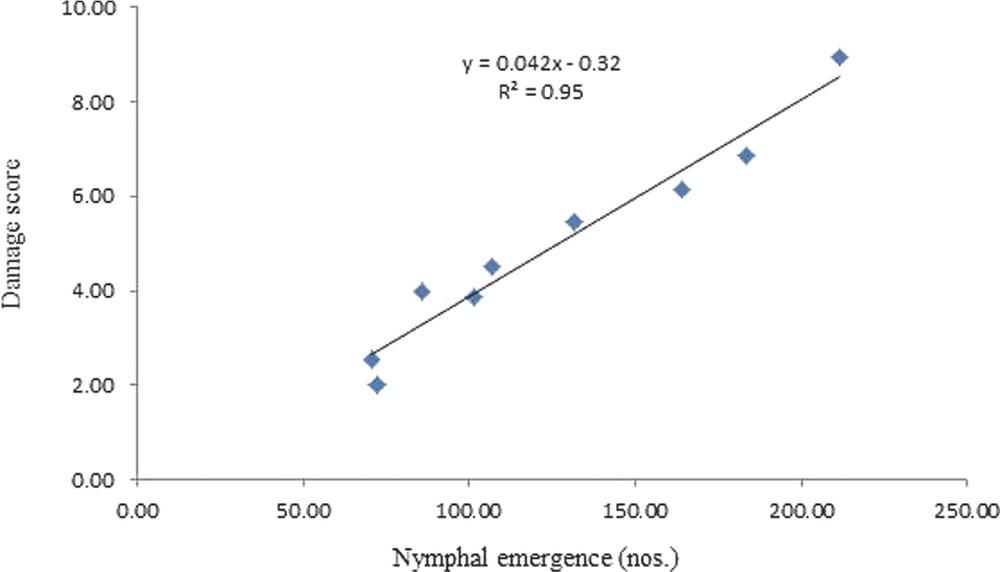
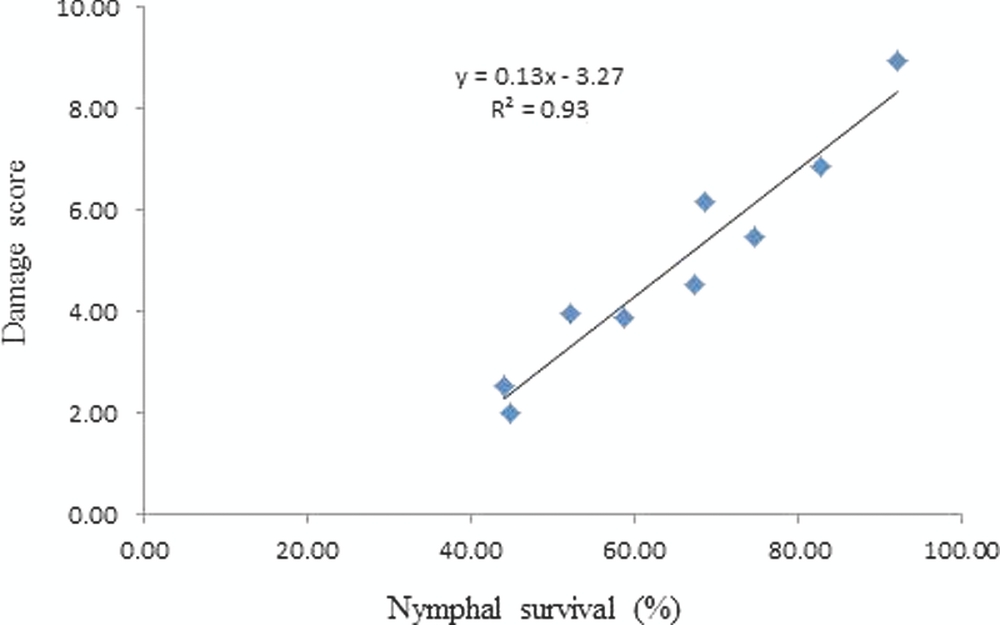
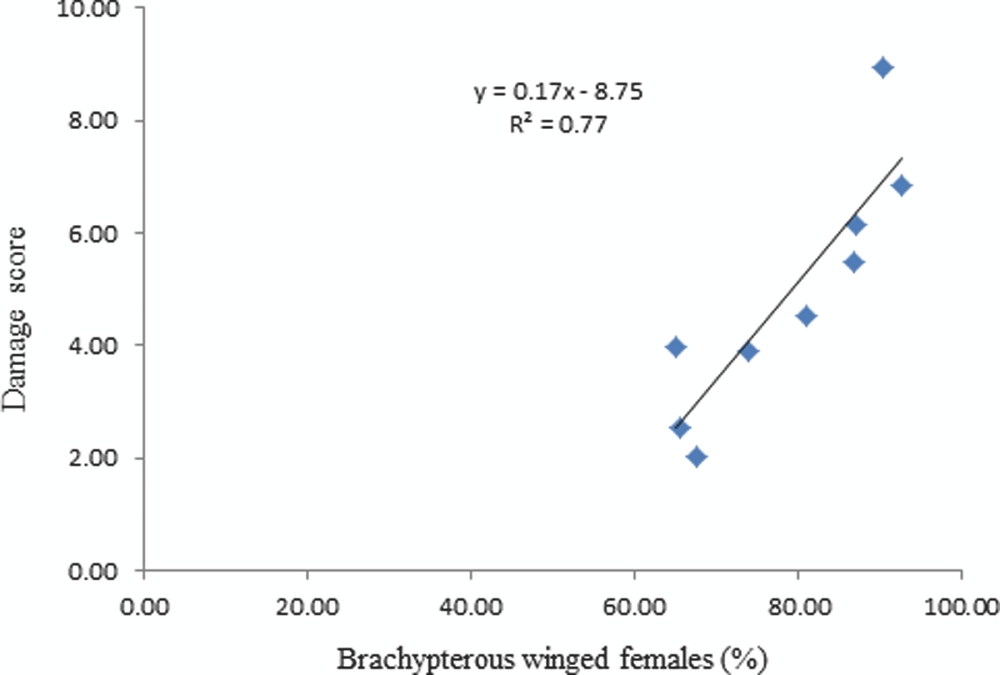
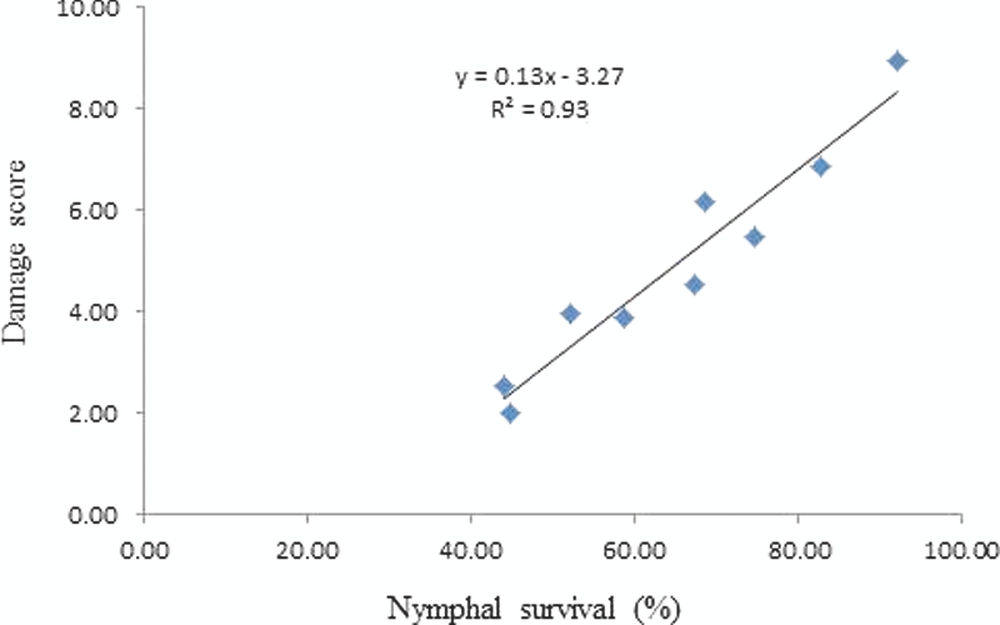
A stepwise multiple regression study was performed by taking the damage score as the dependent variable and all other antibiosis parameters as independent variables. Out of these, three parameters, nymphal emergence, nymphal survival percentage, and proportion of brachypterous females were significantly related to damage score. Together, these three accounted for 86% of the variation in damage score (F = 11.73, P<0.001) (Table 3). Individual regression analyses of damage score versus nymphal emergence, nymphal survival percentage, and proportion of brachypterous females revealed significant linear relationships (Figs. 1–3). The trend in damage score versus these three parameters was positive and significantly correlated.
Stepwise regression analysis for damage score and different resistance parameters against Nilaparvata lugens

**Significant at 1%; * significant at 5%.
Relationship between damage score and Nilaparvata lugens nymph emergence (Nos.) on different rice genotypes.

Relationship between damage score and Nilaparvata lugens nymph survival (%) on different rice genotypes.
Relationship between damage score and emergence of Nilaparvata lugens brachypterous winged females (%) on different rice genotypes.
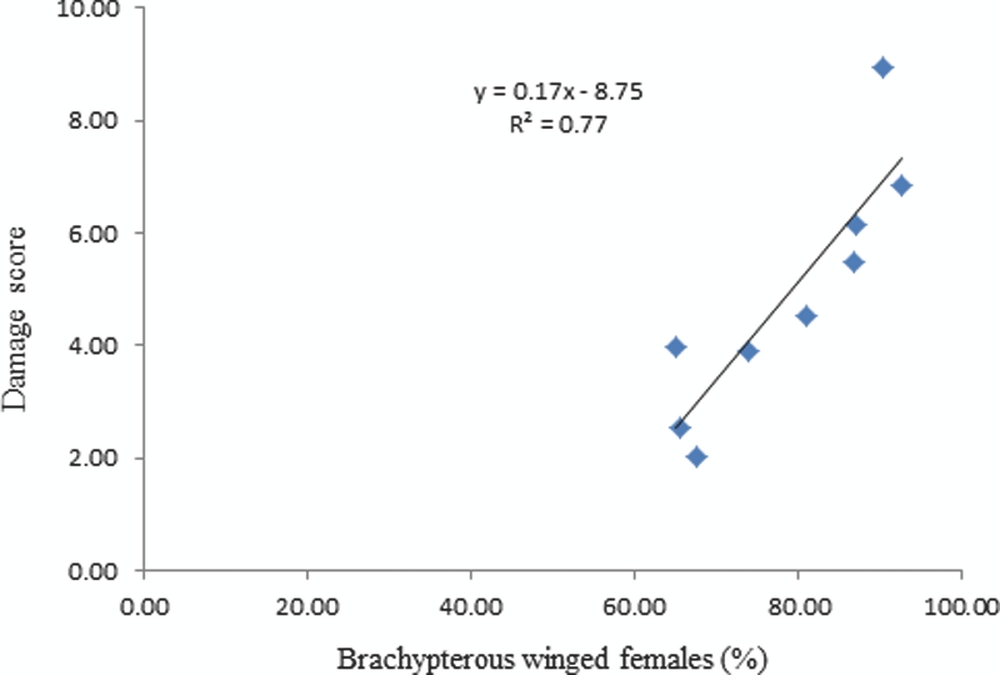
In the current study, we attempted to interlink different parameters through correlation analysis. All the parameters showed significant positive or negative correlations with the damage score. These studies support the findings of Qiu et al. (Reference Qiu, Guo, Jing, Tang, Zhu and He2011) who also showed that the seedling bulk test was a general indicator of the antibiosis component of resistance in genotypes to BPH. However, Ramesh et al. (Reference Ramesh, Padmavathi, Deen, Pandey, Jhansi Lakshmi and Bentur2014) in their observations regarding tests conducted for WBPH resistance in F2:3 mapping population failed to find a significant correlation between damage score and nymphal development period.
In summary, RP2068-18-3-5 was found to be a new source for resistance to BPH comparable in performance with Ptb33 (Jairin et al., Reference Jairin, Phengrat, Teangdeerith, Vanavichit and Toojinda2007; Yadavalli et al., Reference Yadavalli, Narwane, Krishna, Pothi and Muthusamy2012). Rathu Heenati was the next best genotype in almost all the parameters tested. INRC3021 did not differ from TN1 concerning sex ratio and wing morph but differed regarding nymphal survival percentage as reported earlier (Sable and Rana, Reference Sable and Rana2015). Both Sinna Sivappu and MR1523 displayed an intermediate level of BPH resistance, but these are also reported to be resistant to WBPH (Ramesh et al., Reference Ramesh, Padmavathi, Deen, Pandey, Jhansi Lakshmi and Bentur2014). These results further confirm the report of the effectiveness of Ptb33 (bph2, Bph3, Bph32) and Rathu Heenati (Bph3, Bph17) against Indian populations of BPH (Horgan et al., Reference Horgan, Ramal, Bentur, Kumar, Vasanta Banu, Sarao, Iswanto, Chien, Phyu, Bernal, Almazan, Alam, Lu and Huang2015; Ren et al., Reference Ren, Gao, Wu, Lu, Zeng, Lv, Su, Luo and Ren2016).
Conclusion
This is an overview of the antibiosis levels in nine different rice genotypes. From these experiments, we can conclude that RP2068-18-3-5 has emerged as a new source of resistance to BPH. Because of the limited sources of BPH resistance carrying known genes with identified, linked markers in the context of India, it is imperative to study the genetics of BPH resistance in RP2068-18-3-5 and identify linked markers for the dominant gene(s). We have already initiated the transfer and mapping of BPH resistance genes from RP2068-18-3-5. Transfer and mapping of BPH resistance genes will pave the way to breed durable BPH-resistant rice varieties, and ultimately, provide an environmentally friendly control tool that forms the core of an IPM programme without involving any extra cost to the farmers.
Acknowledgements
We thank the In-charge Rice Section and Head, Department of Plant Breeding and Genetics, Punjab Agricultural University, Ludhiana, India for providing facilities necessary for the conduct of these experiments, and the Indian Institute of Rice Research, Hyderabad for providing the rice genotypes seeds.