Introduction
Current diagnostic criteria for mental disorders are largely symptom-based and thus lack significant biological validation. The National Institutes of Mental Health (NIMH) have tried to address this conundrum by suggesting utilizing their Research Domain criteria (RDoC) framework (Cuthbert, Reference Cuthbert2014; Fava, Reference Fava2014; First, Reference First2014; Parnas, Reference Parnas2014). Although biomarkers have been incorporated in the routine diagnosis, treatment, and prognosis of patients in many medical specialties, progress in this area within psychiatry has been limited (Kapur et al. Reference Kapur, Phillips and Insel2012; McGorry et al. Reference McGorry, Keshavan, Goldstone, Amminger, Allott, Berk, Lavoie, Pantelis, Yung, Wood and Hickie2014). The development of biomarkers is a necessary step in the development of a more personalized and stratified practice of psychiatry (McGorry et al. Reference McGorry, Keshavan, Goldstone, Amminger, Allott, Berk, Lavoie, Pantelis, Yung, Wood and Hickie2014; Murck et al. Reference Murck, Laughren, Lamers, Picard, Walther, Goff and Sainati2015; Phillips et al. Reference Phillips, Chase, Sheline, Etkin, Almeida, Deckersbach and Trivedi2015). Reflecting this acknowledged translational gap (Insel & Landis, Reference Insel and Landis2013), the International Society for Bipolar Disorders (ISBD) has published a positional report on the potential role of biomarkers in the care of patients with bipolar disorder (BD) (Frey et al. Reference Frey, Andreazza, Houenou, Jamain, Goldstein, Frye, Leboyer, Berk, Malhi, Lopez-Jaramillo, Taylor, Dodd, Frangou, Hall, Fernandes, Kauer-Sant'Anna, Yatham, Kapczinski and Young2013). The overall conclusion of this panel was that although biomarkers offer considerable promise there remains a need for large and well-designed studies before they can be introduced in everyday clinical practice (Frey et al. Reference Frey, Andreazza, Houenou, Jamain, Goldstein, Frye, Leboyer, Berk, Malhi, Lopez-Jaramillo, Taylor, Dodd, Frangou, Hall, Fernandes, Kauer-Sant'Anna, Yatham, Kapczinski and Young2013).
In marked contrast to this statement, since the 1990s, several peripheral biomarkers have been subjected to meta-analysis with encouraging results (Looney & el-Mallakh, Reference Looney and el-Mallakh1997; Scola & Andreazza, Reference Scola and Andreazza2014). The biomarkers evaluated are involved with pathways that could play a role in the pathophysiology of BD including, but not limited to, the hypothalamic-pituitary-adrenal (HPA) axis (Girshkin et al. Reference Girshkin, Matheson, Shepherd and Green2014), the immune system (Modabbernia et al. Reference Modabbernia, Taslimi, Brietzke and Ashrafi2013; Munkholm et al. Reference Munkholm, Brauner, Kessing and Vinberg2013a , Reference Munkholm, Vinberg and Vedel Kessing b ), neurotrophins and apoptotic factors (Lin, Reference Lin2009; Fernandes et al. Reference Fernandes, Gama, Cereser, Yatham, Fries, Colpo, de Lucena, Kunz, Gomes and Kapczinski2011; Polyakova et al. Reference Polyakova, Stuke, Schuemberg, Mueller, Schoenknecht and Schroeter2015), as well as markers of oxidative and nitrosative stress (ONS) (Brown et al. Reference Brown, Andreazza and Young2014).
The literature on biomarkers in other fields of medicine has been hampered by an excess of significance bias, indicating the selective reporting of a greater than expected number of statistically significant results (Tsilidis et al. Reference Tsilidis, Papatheodorou, Evangelou and Ioannidis2012; Tzoulaki et al. Reference Tzoulaki, Siontis, Evangelou and Ioannidis2013). The following mechanisms have been suggested as contributing to this type of bias: (1) publication bias where studies with positive results are preferentially published, whereas ‘negative’ studies remain unpublished (Young & Bang, Reference Young and Bang2004); (2) selective outcome reporting bias, in which researchers may selectively report significant ‘positive’ results, whereas non-significant ‘negative’ findings are not reported; (3) selective analysis reporting bias in which the results are analyzed with different statistical methods (sometimes not a priori in the study protocol) in order to emphasize ‘positive’ results. These all result in excess of significance bias, which impedes proper evaluation of the evidence, and thus undermine the incorporation of biomarkers in clinical practice (Egger et al. Reference Egger, Davey Smith, Schneider and Minder1997; Ioannidis, Reference Ioannidis2005; Ioannidis & Panagiotou, Reference Ioannidis and Panagiotou2011). Within psychiatry it has been suggested that there is excess of significance bias in the literature of brain volume abnormalities (Ioannidis & Panagiotou, Reference Ioannidis and Panagiotou2011), voxel-based morphometry neuroimaging studies (Fusar-Poli et al. Reference Fusar-Poli, Radua, Frascarelli, Mechelli, Borgwardt, Di Fabio, Biondi, Ioannidis and David2014), the field of cognitive neurosciences (Fusar-Poli et al. Reference Fusar-Poli, Radua, Frascarelli, Mechelli, Borgwardt, Di Fabio, Biondi, Ioannidis and David2014), and in psychotherapy trials for major depressive disorder (Cuijpers et al. Reference Cuijpers, Smit, Bohlmeijer, Hollon and Andersson2010; Flint et al. Reference Flint, Cuijpers, Horder, Koole and Munafo2015).
To the best of our knowledge, there has been no previous umbrella review of peripheral non-genetic biomarkers that could differentiate individuals with BD (across different mood states) from healthy controls. Here we systematically selected a representative set of meta-analyses of peripheral diagnostic as well as biomarkers of illness activity for BD to determine the likelihood of bias, as well as the strength of the evidence, in this area.
Method
Identification of eligible studies
We collated meta-analyses that evaluated any peripheral (i.e. measured in serum, plasma, whole blood and urine) trait/diagnosis and state/acuity biomarkers (Davis et al. Reference Davis, Maes, Andreazza, McGrath, Tye and Berk2015) in individuals with BD compared to healthy controls. For inclusion, a meta-analysis had to include participants with a DSM (APA, 2013) and/or ICD (WHO, 1992) diagnosis of BD established through a validated structured diagnostic interview. This study did not examine markers of risk, stage, or prognosis. Meta-analyses published in any language were considered for inclusion in this umbrella review. When more than one meta-analyses were available for the same biomarker, we selected the one with the larger number of included studies in their forest plots. We excluded meta-analyses with <5 datasets, because meta-analyses with fewer datasets would likely provide limited information to draw more definitive conclusions regarding the likelihood of bias, due to the limited statistical power of the Ioannidis test of excess of significance bias (see below) (Ioannidis & Trikalinos, Reference Ioannidis and Trikalinos2007).
We used two different approaches to collect a representative sample of meta-analyses. First, we searched the PubMed/Medline, EMBASE and PsycInfo electronic databases (last search performed 23 May 2015) using the following Boolean terms: (1) for PubMed/Medline: (bipolar disorder OR mania OR manic depression OR bipolar depression OR bipolarity) AND meta-analysis; (2) for EMBASE and PsycInfo (through OVID): (exp Bipolar Disorder/or bipolar depression.mp. or exp Mania/or manic depressive.mp. or bipolarity.mp.) and meta-analysis. Targeted Medline searches were then performed for 56 emerging biomarkers (‘Biomarker name’ AND ‘bipolar disorder [Mesh]’ AND meta-analysis was used for each search; see Supplementary Table S1) collected from recent comprehensives reviews (Frey et al. Reference Frey, Andreazza, Houenou, Jamain, Goldstein, Frye, Leboyer, Berk, Malhi, Lopez-Jaramillo, Taylor, Dodd, Frangou, Hall, Fernandes, Kauer-Sant'Anna, Yatham, Kapczinski and Young2013; Goldstein & Young, Reference Goldstein and Young2013; Teixeira et al. Reference Teixeira, Barbosa, Machado-Vieira, Rizzo, Wieck and Bauer2013). Titles/abstracts were screened for eligibility by two of the authors (A.F.C. and C.A.K.). Potentially eligible articles were retrieved as full text and examined for final inclusion in this review by the same two authors. Disagreements were resolved through consensus. This study followed procedures established in the Preferred reporting items for systematic reviews and meta-analyses (PRISMA) statement (Moher et al. Reference Moher, Liberati, Tetzlaff and Altman2009).
Data extraction
Two of the authors (A.F.C. and C.A.K.) independently extracted the data for each eligible meta-analysis using a Microsoft Access database form. Disagreements were resolved through consensus. For each meta-analysis we extracted the name of the first author, year of publication, journal, and the standardized (reported as Cohen's d, Hedges's g or other similar method) effect size estimate and 95% confidence intervals (CI). The number of studies in each meta-analysis as well as the sample size (N total sample, number of participants with BD, and number of healthy controls), and effect size of each individual study (with its 95% CI) were also extracted from the forest plots provided by each meta-analysis. We also recorded the I 2 metric as a measure of heterogeneity (Higgins & Thompson, Reference Higgins and Thompson2002) and the p value of the Egger's asymmetry test (Egger et al. Reference Egger, Davey Smith, Schneider and Minder1997) as an estimation of small-study effects. We considered each study as a separate estimate of effect.
Whenever forest plots of available meta-analyses included studies that enrolled participants with diagnoses other than BD or datasets in which the biomarker was measured in other body compartments (e.g. post-mortem brain studies, cerebrospinal fluid), we excluded these studies. The effect-size estimate for the meta-analysis (in the same metric as reported in the eligible report), the I 2 metric and the p value for the Egger's test were then re-calculated. The corresponding authors of eligible manuscripts were contacted electronically on two different occasions whenever data could not be extracted from the original publication (i.e. in meta-analyses that included the summary effect-size estimate, but forest plots and/or effect-size estimates for individual studies were not reported). Whenever data were only presented graphically, we used a previously described method (Sistrom & Mergo, Reference Sistrom and Mergo2000) for data extraction. Whenever data were available, we extracted data for each separate mood state (mania, hypomania, bipolar depression, euthymia) compared to healthy controls. Mood states were defined according to either DSM or ICD criteria.
Statistical analysis
We used the Ioannidis test for excess of significance (Ioannidis & Trikalinos, Reference Ioannidis and Trikalinos2007). In brief, this test evaluates whether the number of studies with nominally significant results (i.e. with p < 0.05) among those included in a meta-analysis is too large based on the power that these datasets have to detect effects at α = 0.05. The power estimate for each dataset was calculated. The sum of the power estimates of each study provides the expected number of datasets with nominal statistical significance. As described elsewhere, the number of expected ‘positive’ (i.e. statistically significant datasets) sets can be compared with the observed number of statistically significant studies through a χ2-based test (Ioannidis & Trikalinos, Reference Ioannidis and Trikalinos2007). The greater the difference between observed and expected, the higher the degree of excess of significance bias.
The estimated power of each included dataset in a meta-analysis is dependent on its plausible true effect size (Ioannidis & Trikalinos, Reference Ioannidis and Trikalinos2007). The true effect size of a meta-analysis cannot be precisely determined. Thus, to calculate the Ioannidis test of excess of significance bias, assumptions regarding the true effect size of a meta-analysis are required. In the absence of bias, simulations indicate that the most reliable assumption is the effect size of its largest dataset. Summary effect sizes obtained from random-effects models can be substantially biased (inflated) in the presence of selective reporting that affect smaller studies disproportionately. In this scenario, the largest study is the best choice for the plausible effect, unless there are concerns about the quality of the largest study (Ioannidis, Reference Ioannidis2013; Tzoulaki et al. Reference Tzoulaki, Siontis, Evangelou and Ioannidis2013). Thus, we considered the effect size of the largest study in our analysis as a proxy of the true effect size of each meta-analysis.
All effect size estimates were expressed as standardized mean differences between two compared groups (i.e. participants with BD v. controls) using the same metric of the original published meta-analysis. When the standardized mean difference were not provided, they were calculated using the means and standard deviations (s.d.) of the absolute measurements for each of the two reported groups using standard formula reported in detail elsewhere (Ioannidis & Panagiotou, Reference Ioannidis and Panagiotou2011). All effect-size calculations were performed using random-effects models. Random-effect modeling assumes a genuine diversity in the results of various studies and incorporates a between-study variance into the calculations (Higgins & Green, Reference Higgins and Green2013). Power estimations were performed for each study with the freely available PS Power and Sample Size 3 software (Dupont & Plummer, Reference Dupont and Plummer1990). Statistical significance for the Ioannidis test was set at p < 0.05.
For the I 2 metric, values >50% were considered as indicative of high heterogeneity beyond chance, while values >75% were regarded as presenting very high heterogeneity (Higgins & Thompson, Reference Higgins and Thompson2002). However, with a limited number of datasets, I 2 values could be underpowered and misleading (Huedo-Medina et al. Reference Huedo-Medina, Sánchez-Meca, Marin-Martinez and Botella2006). We also calculated the 95% prediction interval, which further estimates between-study heterogeneity. This statistic reveals the level of uncertainty that could be expected in a new study addressing the same association (Higgins, Reference Higgins2008, Reference Higgins, Thompson and Spiegelhalter2009).
We also assessed whether there was evidence for small-study effects (i.e. whether smaller studies tend to provide substantially larger effects sizes than the larger studies included in each meta-analysis) with Egger's regression asymmetry test (Egger et al. Reference Egger, Davey Smith, Schneider and Minder1997). A p value <0.10 with smaller effect size in the largest study compared to the summary effect size of the respective random-effects meta-analysis was judged as indicative of small-study effects.
To identify possible variables related to bias, we also calculated the Ioannidis test of excess of significance in specific subgroups of meta-analyses namely small v. large heterogeneity (see above), significant v. non-significant summary effect size, presence v. absence of small-study effects (see above), biomarker type, biomarker sample source, and mood state.
Finally, we sought to classify each biomarker according to the level of evidence based on modified criteria proposed by Belbasis et al. (Reference Belbasis, Bellou, Evangelou, Ioannidis and Tzoulaki2015). We considered the following a priori categories: (1) convincing evidence criteria: more than 500 cases (i.e. with an established diagnosis of BD), significant summary size estimates (p < 0.001), no evidence for an excess of significance bias, no evidence of large heterogeneity (i.e. I 2 < 50%), no small-study effects, and the prediction interval not crossing the null (zero); (2) suggestive evidence criteria: nominally significant summary effect size (p < 0.05), no evidence of small-study effects, not large heterogeneity, and no evidence for small-study effects; (3) weak evidence criteria: all other meta-analyses with significant summary effect sizes (p < 0.05) and (4) non-significant meta-analyses (p > 0.05).
Results
Eligible meta-analyses
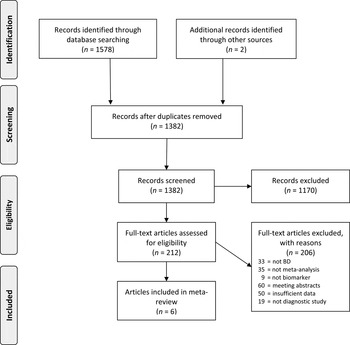
Our search strategy identified 1580 results, and the title/abstracts of 1382 unique references were screened for eligibility. Of 212 references selected for full-text review, six references met inclusion criteria (Looney & el-Mallakh, Reference Looney and el-Mallakh1997; Modabbernia et al. Reference Modabbernia, Taslimi, Brietzke and Ashrafi2013; Brown et al. Reference Brown, Andreazza and Young2014; Girshkin et al. Reference Girshkin, Matheson, Shepherd and Green2014; Dargel et al. Reference Dargel, Godin, Kapczinski, Kupfer and Leboyer2015; Polyakova et al. Reference Polyakova, Stuke, Schuemberg, Mueller, Schoenknecht and Schroeter2015). The flowchart of the selection process of eligible articles is presented in Fig. 1. Eligible references (k = 6) included 20 separate forest plots, which investigated 13 unique biomarkers (Fig. 2). Overall, our analyses included 169 datasets (5474 BD cases, 4823 healthy controls). Eleven meta-analyses did not differentiate between mood states, while three meta-analyses provided data for different mood states (euthymia, bipolar depression, mania), namely brain-derived neurotrophic factor (BDNF), C-reactive protein (CRP), and erythrocyte Na,K-ATPase activity (Fig. 2 b).
Flowchart of selection of meta-analyses for the umbrella review.

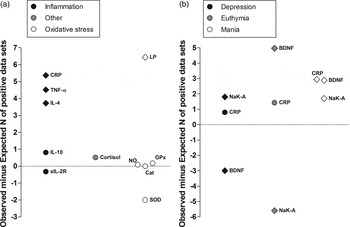
Excess of significance in studies of biomarkers of bipolar disorder (BD). (a) For the studies that did not differentiate BD mood states, the difference between the number of observed and expected studies with ‘positive’ (i.e. significant) results is presented grouped by biomarker type (inflammation, oxidative stress or other). (b) For the studies that separated the BD mood states (euthymia, bipolar depression or mania), the difference between the number of observed and expected with ‘positive’ results is presented grouped by mood state. Biomarkers with a significant difference (p < 0.05 in the Ioannidis test for excess of significance) are plotted as diamonds, while non-significant differences are plotted as circles. BDNF, Brain-derived neurotrophic factor; Cat, catalase; CRP, C-reactive protein; GPx, glutathione peroxidase; IL, interleukin; sIL-2R, soluble IL-2 receptor; LP, lipid peroxidation; NaK-A, erythrocyte NaK-ATPase activity; NO, nitric oxide; SOD, superoxide dismutase; TNF-α, tumor necrosis factor-alpha.

Excess of significance bias
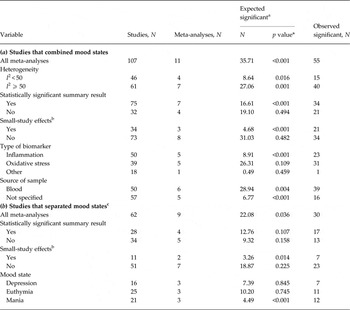
The overall assessment of bias using the Ioannidis test is presented in Table 1. Overall, we found evidence of an excess of significant findings for studies that combined BD cases in different mood states (Table 1). When separated by specific subgroups, evidence for an excess of significance bias was found for: (1) meta-analyses with statistically significant effect size estimates; (2) meta-analyses with evidence of small-study effects; (3) meta-analyses of inflammatory biomarkers compared to biomarkers related to oxidative stress or other types of biomarkers. No evidence of an excess of significance bias was found for meta-analyses with non-significant effect sizes or where small-study effects could not be demonstrated.
Observed and expected number of significant studies across all meta-analyses and in subgroups

(a) Studies where datasets including different mood states were combined.
(b) Studies where the datasets were separated by mood state.
a Expected is the sum of the power of all studies to detect a difference equal to the effect size of the largest study with α = 5%.
b Defined as p < 0.1 in Egger's test for publication bias and effect size of the largest study more conservative than the effect size of the meta-analysis.
c Heterogeneity analysis not included since all studies had I 2 ⩾ 50%.
*Nominally statistically significant difference between expected and observed (p < 0.05 in χ2-based excess significance test).
For the nine meta-analyses that had differentiated participants according to mood states, there was also evidence of an overall excess of significance bias (Table 1). When separated by specific subgroups, evidence of an excess of significant findings could be demonstrated for: (1) meta-analyses with evidence of small-study effects; (2) meta-analyses that had measured biomarkers in manic participants compared to meta-analyses that included participants in either bipolar depression or euthymia.
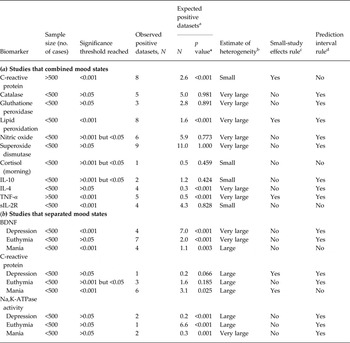
Fig. 2 depicts the magnitude of the difference between observed and expected number of significant studies, according to biomarker type (Fig. 2 a) or mood state (Fig. 2 b). No evidence of an excess of significance bias was found for catalase, glutathione peroxidase, nitric oxide, superoxide dismutase, morning cortisol, IL-10 and soluble IL-2 receptor (sIL-2R) in the meta-analyses that did not separate mood states (Fig. 2 a). There was also no evidence of an excess of significance bias for CRP in depression and euthymia (Fig. 2 b and Table 2).
Assessment of bias across the 13 bipolar disorder peripheral biomarkers

(a) Biomarkers from studies that combined all mood states (n = 11).
(b) Biomarkers from studies that separated each mood state in the analysis (n = 3).
BDNF, Brain-derived neurotrophic factor; sIL-2R, soluble IL-2 receptor; TNF-α, tumor necrosis factor-alpha.
a Expected is the sum of the power of all studies to detect a difference equal to the effect size of the largest study with α = 5%.
b Small: I 2 < 50%; large: 50% ⩽ I 2 < 75%; very large: I 2 ⩾ 75%.
c p < 0.1 in Egger's test of publication bias and effect size of the largest study more conservative than the effect size of the meta-analysis.
d 95% prediction interval includes the null value (zero).
*p value in χ2-based excess significance test.
Evidence criteria
No examined biomarker met the convincing evidence criteria (Table 2). Two biomarkers met the suggestive evidence criteria namely morning cortisol and the sIL-2R. The following biomarkers that had been examined in eligible meta-analyses met the weak evidence criteria: CRP, CRP in mania, CRP in euthymia, lipid peroxidation, nitric oxide, tumor necrosis factor-alpha, BDNF in bipolar depression, and BDNF in mania. Conversely, no nominally significant effect-size estimates (p > 0.05) were observed for the following biomarkers: catalase, glutathione peroxidase, IL-10, IL-4, superoxide dismutase, BDNF in euthymia, CRP in bipolar depression, and erythrocyte Na,K-ATPase activity (in bipolar depression, euthymia, mania).
Summary effect sizes
Summary effect-size estimates of 11 forest plots (55.0%) were statistically significant (p < 0.05), while the largest study was significant in 10 (50.0%) forest plots (see Supplementary Table S2). The point summary effect-size estimate of the meta-analysis was larger than the effect size of its largest dataset in six meta-analyses (30.0%).
Heterogeneity and small-study effects
Heterogeneity was high (i.e. I 2 > 50.0%) in 16 meta-analyses (80.0%). The prediction interval included the null (zero) in 14 meta-analyses (70.0%). Evidence of small-study effects was observed in five (25.0%) of the examined meta-analyses (Table 2). The prediction interval of 15 meta-analyses (75.0%) crossed the null point (Table 2).
Power of biomarker studies
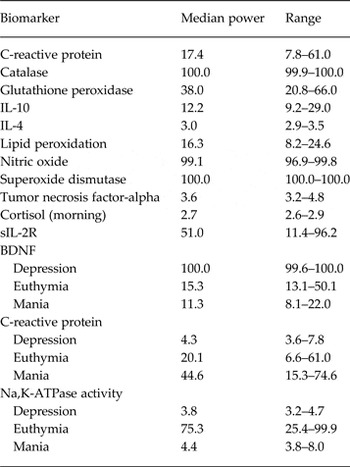
We also aimed to determine the statistical power of individual studies in this field considering the summary effect size of the largest dataset included in each meta-analysis as the plausible true effect size. Overall, the median power of individual studies was 15.3% (range 2.5–100%). For meta-analyses that did not provide data separately by mood states the overall median power was 13.3% (range 2.6–100%), while for meta-analyses that separated BD cases according to mood state the calculated median power was 18.7% (range 3.2–100%). Table 3 depicts the median and range of calculated powers of individual studies of each biomarker examined in different meta-analyses.
Observed power (%) in the studies of each biomarker

BDNF, Brain-derived neurotrophic factor; sIL-2R, soluble IL-2 receptor.
Power was estimated under the assumption that the true effect size was the effect size of the largest study.
Discussion
We provide an overview and appraisal of the literature on peripheral biomarkers in individuals with BD compared to healthy controls. In this analysis, we evaluated 13 individual biomarkers that were evaluated in 20 different meta-analyses (i.e. forest plots) from six unique references. We found evidence that several results could be prone to bias. Furthermore, only sIL-2R and morning cortisol met the a priori-defined criteria for suggestive evidence, while none of the examined biomarkers fulfilled the convincing evidence criteria. Therefore, from an epidemiological perspective, the results in this literature seem to be supported by only a limited level of methodological rigor. In other medical specialties, evidence of bias in biomarker research has also been shown (Tsilidis et al. Reference Tsilidis, Papatheodorou, Evangelou and Ioannidis2012; Tzoulaki et al. Reference Tzoulaki, Siontis, Evangelou and Ioannidis2013).
Large heterogeneity (i.e. I 2 > 50.0%) was a frequent hint of bias across examined meta-analyses. Notwithstanding that this high degree of heterogeneity could reflect a bias differentially affecting constituent datasets, it may also represent genuine heterogeneity across studies. Potential genuine sources of heterogeneity may include the enrolment of samples with different socio-demographic and clinical characteristics. Examples include participants with BD with different mood states (mania, hypomania, bipolar depression, euthymia), treatments, stages or co-morbidities (Vieta, Reference Vieta2014). These clinical characteristics may demarcate distinct clinical populations, who otherwise would appear deceptively similar as they have the same DSM-5 diagnosis (in our case, BD). Furthermore, evidence indicates that the BD phenotype is heterogeneous. Hence, the illness may have different trajectories that could be at least in part be explained by distinct underlying pathophysiological underpinnings (Berk et al. Reference Berk, Kapczinski, Andreazza, Dean, Giorlando, Maes, Yucel, Gama, Dodd, Dean, Magalhaes, Amminger, McGorry and Malhi2011; Birmaher et al. Reference Birmaher, Gill, Axelson, Goldstein, Goldstein, Yu, Liao, Iyengar, Diler, Strober, Hower, Yen, Hunt, Merranko, Ryan and Keller2014). Therefore, possible clinical and biological distinctions between participants included across studies in this umbrella review should be considered (Fava et al. Reference Fava, Guidi, Grandi and Hasler2014) when interpreting our results. In addition, these factors may be obstacles for the incorporation of biomarkers in the routine care of patients with BD.
The prediction interval crossed the null in most (75.0%) examined meta-analyses. Although this statistic was not reported in the included references, Higgins et al. suggest that one of the main roles of meta-analytic reviews is to quantify the level of uncertainty in a specific subject or field (Higgins et al. Reference Higgins, Thompson and Spiegelhalter2009). This hint of bias indicates that the level of certainty in the literature of peripheral biomarkers for BD could be remarkably low.
An excess of significance bias was also observed for several biomarkers observed across meta-analyses (55.0%). This excess of significance bias may be due to unpublished ‘negative’ results or to a selective analysis of data whereby only the most prominent (nominally significant) findings are reported. Bias in preferably reporting ‘positive’ findings or ‘positive analysis’ in studies have been a problematic aspect of biomarker research in other fields of medicine (Tsilidis et al. Reference Tsilidis, Papatheodorou, Evangelou and Ioannidis2012; Tzoulaki et al. Reference Tzoulaki, Siontis, Evangelou and Ioannidis2013). It is possible that only a fraction of potentially available results is ultimately published in this field. In psychiatric biomarker research the availability of assays at a relatively low cost have enabled the widespread measurement of a range of biomarkers in a single investigation (Janelidze et al. Reference Janelidze, Ventorp, Erhardt, Hansson, Minthon, Flax, Samuelsson, Traskman-Bendz and Brundin2013; Diniz et al. Reference Diniz, Sibille, Ding, Tseng, Aizenstein, Lotrich, Becker, Lopez, Lotze, Klunk, Reynolds and Butters2015). Thus, at least in some scenarios, some promising biomarker results may reflect ‘false positive’ results due to the failure to correct for multiple statistical testing across studies (Ioannidis et al. Reference Ioannidis, Tarone and McLaughlin2011). Consistent with this, we found in our subgroup analyses that an excess of significance bias could be even more problematic in studies that have assayed inflammatory biomarkers (e.g. cytokines). It is possible that both mechanisms could play a role in the observed excess of significance bias reported herein.
In spite of some variations across investigations, we found evidence that most individual studies in this field are substantially underpowered. It has been demonstrated that underpowered studies are more likely to report spurious results, and thus undermine the reliability of a specific field (Button et al. Reference Button, Ioannidis, Mokrysz, Nosek, Flint, Robinson and Munafo2013).
The main strength of our analyses is that we included a comprehensive set of meta-analyses for several biomarkers, which provided an overall view of this field. However, some limitations of our study warrant discussion. First, we restricted our investigation to peripheral non-genetic biomarkers for BD. Notwithstanding that peripheral biomarkers may not necessarily reflect pathophysiological processes in the brain, the ‘periphery as a window to the brain’ (Fernandes et al. Reference Fernandes, Steiner, Berk, Molendijk, Gonzalez-Pinto, Turck, Nardin and Goncalves2015) paradigm has several strengths and has gained momentum in biomarker research in psychiatry due to the limited access to brain tissue in vivo. Second, we limited our eligibility criteria to diagnostic and illness activity biomarkers since narrative reviews indicated that investigations on these biomarkers have been more prevalent in this field. It is worthy of note that a basic framework for the classification of biomarkers across neuropsychiatric diseases was recently proposed (Davis et al. Reference Davis, Maes, Andreazza, McGrath, Tye and Berk2015). Third, while the overall picture suggests that this literature has several hints of bias, it should be noted that distinct biomarkers could differ in the likelihood of bias. For example, the sIL-2R and morning cortisol met the suggestive evidence criteria. However, unadjusted values considered in our analyses may be affected by selection bias and other confounding variables that may compromise the validity of these findings. In addition, our study examined biomarkers related to pathways, e.g. inflammation, oxidative and nitrosative stress, and neurotrophins that may contribute to the pathophysiology of this illness (Berk et al. Reference Berk, Kapczinski, Andreazza, Dean, Giorlando, Maes, Yucel, Gama, Dodd, Dean, Magalhaes, Amminger, McGorry and Malhi2011; Rosa et al. Reference Rosa, Singh, Whitaker, de Brito, Lewis, Vieta, Churchill, Geddes and Goodwin2014). Finally, meta-analyses evaluating other cytokines have been reported by Modabbernia et al. (Reference Modabbernia, Taslimi, Brietzke and Ashrafi2013). However, forest plots for all examined cytokines were not available, and thus data could not be extracted.
In conclusion, our analysis indicates that the literature on peripheral biomarkers for BD may be prone to bias and may have limited epidemiological credibility. Several developments that could ultimately remedy the proneness to bias in future studies are expected. For example, the establishment of large international consortia for the design of methodologically robust (including a better standardization of assay techniques across different laboratories) and adequately powered studies could be a necessary step. Finally, platforms for the registration of biomarker studies could improve the transparency of studies and analyses, thereby diminishing the overall degree of bias in this literature.
Supplementary material
For supplementary material accompanying this paper visit http://dx.doi.org/10.1017/S0033291716000957.
Acknowledgements
A.F.C. and J.Q. are supported by research fellowship awards from CNPq (Brazil). C.A.K. is supported by a postdoctoral fellowship from CAPES (Brazil). B.S.F. is supported by a scholarship and by a research grant MCTI/CNPQ/Universal 14/2014461833/2014-0, both from CNPq, Brazil. A.R.B. is supported by the following grants: 2013 NARSAD Young Investigator from the Brain & Behavior Research Foundation (grant no. 20493), 2012 FAPESP Young Researcher from the São Paulo State Foundation (grant no. 20911-5) and National Council for Scientific and Technological Development (CNPq, grant no. 470904). M.B. is supported by a NHMRC Senior Principal Research Fellowship (1059660).
Declaration of Interest
None.