


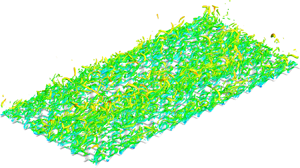


1. Introduction
Rough-wall turbulence is commonplace in nature and engineering problems. In recent decades, fluid mechanics studies in this area have mainly focused on the following aspects: (i) roughness parametric characterization, including the scaling of the roughness function and equivalent sand grain roughness (Napoli, Armenio & De Marchis Reference Napoli, Armenio and De Marchis2008; Flack & Schultz Reference Flack and Schultz2010; Forooghi et al. Reference Forooghi, Stroh, Magagnato, Jakirlić and Frohnapfel2017); (ii) the prediction of rough-wall friction resistance (Flack & Schultz Reference Flack and Schultz2010; Yang et al. Reference Yang, Sadique, Mittal and Meneveau2016); (iii) the modification of near-wall turbulent coherent structures by roughness (Chan et al. Reference Chan, MacDonald, Chung, Hutchins and Ooi2018; Stroh et al. Reference Stroh, Schäfer, Frohnapfel and Forooghi2020); and (iv) the verification of the outer-layer similarity hypothesis (Jimenez Reference Jimenez2004; Lee, Sung & Krogstad Reference Lee, Sung and Krogstad2011; Squire et al. Reference Squire, Morrill-Winter, Hutchins, Schultz, Klewicki and Marusic2016). Turbulent flows over rough walls almost always undergo higher drag than those over smooth walls. This increase in drag is often quantified with the Hama roughness function  ${\rm \Delta} {{U}^{+}}$, which reflects the downward shift of the mean streamwise velocity profile of the flow over a rough wall when compared with a smooth wall. In practice, increased drag usually results in efficiency losses, so predicting the drag due to a rough wall is crucial to the management of most engineering flows.
The parameterization of rough surfaces is fundamental to the prediction of wall resistance. The selection of suitable roughness parameters enables the construction of meaningful rules. Nikuradse (Reference Nikuradse1933) carried out experiments on uniform sand grain roughness and proposed the concept of equivalent sand grain roughness height  ${{k}_{s}}$ as characteristic of the fully rough regime: different roughness types, such as spherical, square and wedge-shaped roughness elements, can have equivalent
 ${{k}_{s}}$ values. Further roughness parameters have been proposed. For instance, Schlichting (Reference Schlichting1936) defined the roughness solidity
 $\Lambda$ as the ratio of the total projected frontal roughness area to the wall-parallel projected area, which is now considered an important parameter for the characterization of roughness density. Sigal & Danberg (Reference Sigal and Danberg1990) and Van Rij, Belnap & Ligrani (Reference Van Rij, Belnap and Ligrani2002) modified this definition by taking into account the roughness shape and the irregular roughness form, respectively. Recently, the effective slope ES, which is defined as the mean absolute streamwise gradient of the surface (Napoli et al. Reference Napoli, Armenio and De Marchis2008), was proposed as a roughness parameter, and is now widely used. In the present study, this definition is extended to three dimensions as the roughness steepness (S). In addition, the root-mean-square (r.m.s.) of the local surface slope angle can be used to characterize the roughness shape (Yuan & Piomelli Reference Yuan and Piomelli2014). Flack & Schultz (Reference Flack and Schultz2010) summarized the roughness function correlation models that have been proposed based on these roughness parameters. Some of these models have shown promise in the task of scaling the equivalent sand grain roughness
 ${{k}_{s}}$ in the fully rough regime for certain classes of rough surfaces, but none has proven universally reliable.
The dependence of the roughness function  ${\rm \Delta} {{U}^{+}}$ on the roughness height
 ${{k}^{+}}$ and other geometric features, such as the roughness density and shape, has been explored in many studies. Most of these studies have focused on investigating the individual influence of these parameters. Napoli et al. (Reference Napoli, Armenio and De Marchis2008) numerically investigated the influence of ES on the roughness function for a wide range of irregular rough walls and found that
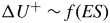 ${\rm \Delta} {{U}^{+}}\sim f( ES )$ is linear for
 $ES < 0.15$ and smoothly nonlinear for
 $ES\ge 0.15$. Schultz & Flack (Reference Schultz and Flack2009) examined the waviness regime
 $( ES<0.35 )$, in which
 ${\rm \Delta} {{U}^{{+}}}$ scales entirely with ES of the pyramids and has little dependence on the roughness height, and the roughness regime
 $( ES>0.35 )$, in which
 ${\rm \Delta} {{U}^{{+}}}$ is sensitive to the roughness height but is independent of ES. On the other hand, Mejia-Alvarez & Christensen (Reference Mejia-Alvarez and Christensen2013) defined the waviness regime (
 $ES<0.15$) and the transition regime (
 $0.15<ES<0.35$), where
 $ES=0.35$ represents a limit between slope-dependent and height-dependent regimes. The viscous drag dominates over the pressure drag in the waviness regime, and the roughness function
 ${\rm \Delta} {{U}^{+}}$ is dependent on both ES and
 ${{k}^{+}}$. Meanwhile, Flack, Schultz & Rose (Reference Flack, Schultz and Rose2012) studied the roughness scale for predicting the onset of roughess effects in the transitionally rough regime and suggested the peak-to-trough roughness height (
 $k_{t}^{+}$) for scaling the roughness function of different painted surfaces, instead of the r.m.s. roughness height (
 $k_\textit {rms}^{+}$). Recently, Chan et al. (Reference Chan, MacDonald, Chung, Hutchins and Ooi2015) systematically studied the effects of the roughness average height (
 $k_{a}^{+}$) and the wavelength (or the surface slope) on flows in a three-dimensional sinusoidal rough-wall pipe and concluded that
 ${\rm \Delta} {{U}^{+}}$ is strongly dependent on both
 $k_{a}^{+}$ and ES. Thakkar, Busse & Sandham (Reference Thakkar, Busse and Sandham2017) showed a linear fit of the roughness function
 ${\rm \Delta} {{U}^{+}}$ based on the solidity parameter, which was further extended to higher-order scaling models by considering more roughness parameters for more realistic random roughness, e.g. the streamwise correlation length, the r.m.s. roughness height and the skewness of surface elevation probability density function, etc. Similarly, the second-order turbulence statistics of a rough-wall flow depend strongly on the topological features of the surface. For example, MacDonald et al. (Reference MacDonald, Chan, Chung, Hutchins and Ooi2016) found that increasing the solidity
 $\Lambda$ results in a reduction in the peak of the streamwise velocity fluctuations and moves the peak location away from the wall in the sparse roughness regime. However, the scaling of roughness with respect to second-order statistics has not yet been established.
The aim of the present study was to predict the roughness function directly from the roughness parameters of a given rough surface, and to thereby predict the rough-wall resistance. To this end, we performed a direct numerical simulation (DNS) of a fully developed turbulent channel flow with three-dimensional sinusoidal roughness and at the same time systematically varied the roughness height  ${{k}^{+}}$ and the roughness steepness S. A coupling scale
 ${{k}^{+}} S$ is proposed, which accounts for both the roughness Reynolds number and the steepness of the wall roughness, in order to parameterize the first- and second-order turbulence statistics.
2. Problem formulation and numerical method
The system under consideration is a fully developed turbulent channel flow over three-dimensional sinusoidal rough walls. A schematic diagram of the channel is shown in figure 1. A right-handed Cartesian frame fixed in physical space is employed with  $x,y$ and
 $z$ axes along the streamwise, vertical and spanwise coordinates, respectively. As can be seen in figure 1,
 $k$ is the semiamplitude of the sinusoidal roughness and
 $\lambda$ is the wavelength of the roughness elements. The mean height of the rough surfaces is set at zero, thus the coordinate
 $y=0$ is used in what follows as the virtual origin of the bottom wall. The governing equations are the dimensionless Navier–Stokes and continuity equations:
 \begin{gather} \frac{\partial u_{i}}{\partial t}+u_{j} \frac{\partial u_{i}}{\partial x_{j}}=-\frac{\partial p}{\partial x_{i}}+\frac{1}{R e_{b}} {\rm \Delta} u_{i}, \end{gather}
 \begin{gather}\frac{\partial u_{i}}{\partial x_{i}}=0, \end{gather}
where  ${{u}_{i}}\ (i=1, 2, 3)=(u, v, w)$ are the velocity components in the
 $x_i\, (i=1,2,3)=(x,y,z)$ directions, respectively,
 $p$ is the pressure normalized by
 $\rho U_{b}^{2}$ with
 $\rho$ the fluid density,
 ${{{Re}}_{b}}={{U}_{b}}\delta /\nu$ is the bulk Reynolds number where
 ${{U}_{b}}$ is the bulk mean velocity,
 $\nu$ is the kinematic viscosity,
 $\delta$ is the half-channel height and
 ${\rm \Delta}$ is the Laplacian operator. The characteristic friction velocity defined by the averaged total drag at the rough surface including the friction drag and pressure drag can be expressed as
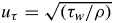 ${{u}_{\tau }}=\sqrt {( {{\tau }_{w}}/\rho )}$, where
 ${{\tau }_{w}}$ is calculated from the time-averaged mean pressure gradient. The friction Reynolds number
 $(Re_{\tau})$ based on
 ${{u}_{\tau }}$ and
 $\delta$ is approximately 540 in all the simulations. Hereafter, the superscript ‘
 $+$’ denotes the the physical quantities normalized by the friction velocity
 ${{u}_{\tau }}$ and the wall viscous length scale
 ${{\delta }_{\nu }}$ (
 $\, = \nu /{{u}_{\tau }}$).
Schematic diagram of the turbulent channel flow over three-dimensional sinusoidal rough walls.

For numerical simulation, an irregular physical domain is transformed into a rectangular computational domain based on a boundary-fitted system, by adopting the following algebraic mapping:
 \begin{equation} t=\tau, \quad x_{1}=\xi_{1}, \quad x_{2}=\xi_{2}(1-\eta_{d})+\eta_{d}, \quad x_{3}=\xi_{3}, \end{equation}
where  $\xi _{1}$,
 $\xi _{2}$,
 $\xi _{3}$ and
 $\tau$ are the space and time coordinates in the computational domain, and
 $\eta _{d}$ is the rough surface elevation, expressed as
 ${{\eta }_{d}}=k\cos ( 2{\rm \pi} x/\lambda )\cos ( 2{\rm \pi} z/\lambda )$. In the computational space, the bottom and top boundaries are represented by
 $\xi _{2}=0$ and
 $\xi _{2}=2 \delta$, respectively. With this coordinate transformation, the governing equations (2.1) and (2.2) are rewritten in terms of the curvilinear coordinates
 $(\tau , \xi _{1}, \xi _{2}, \xi _{3})$. For the spatial discretization, we applied the pseudo-spectral method in the
 $\xi _{1}$ and
 $\xi _{3}$ directions, along with the second-order finite-difference method on the staggered grids in the
 $\xi _{2}$ direction. The governing equations are integrated in time by the third-order time-splitting method. The computational domain size is
 ${{L}_{x}}\times {{L}_{y}}\times {{L}_{z}}=2{\rm \pi} \delta \times 2\delta \times {\rm \pi}\delta$, and the corresponding grid number is
 ${{N}_{x}}\times {{N}_{y}}\times {{N}_{z}}=288\times 191\times 288$. The grid sizes in the streamwise and spanwise directions are uniform with resolutions of
 ${\rm \Delta} \xi _{1}^{{+}}\approx 11$ and
 ${\rm \Delta} \xi _{3}^{{+}}\approx 5.5$, respectively. The grid points along the
 $y$-axis follow a cosine distribution with
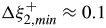 ${\rm \Delta} \xi _{2, min }^{+} \approx 0.1$ near the rough walls to
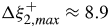 ${\rm \Delta} \xi _{2, max }^{+} \approx 8.9$ near the channel centreline. The no-slip condition is applied to the walls of the channel and a periodic boundary condition is applied in the
 $x$ and
 $z$ directions. The flow is driven by a mean pressure gradient, which is dynamically adjusted to keep the flow rate constant in time. Further details of the numerical method can be found in Ge, Xu & Cui (Reference Ge, Xu and Cui2010) and Zhang, Huang & Xu (Reference Zhang, Huang and Xu2019).
In this study, three groups of numerical cases were simulated as follows: (1) in group A,  ${{k}^{+}}$ is varied while
 $k/\lambda$ is kept constant; (2) in group B,
 ${{\lambda }^{+}}$ is varied while
 ${{k}^{+}}$ is kept constant; and (3) in group C,
 ${{k}^{+}}$ is varied while
 ${{\lambda }^{+}}$ is kept constant. A summary of the flow and roughness parameters is listed in table 1. In fact, in the latter two groups of cases the roughness steepness is changed, which is defined as follows:
 \begin{equation} S=\frac{1}{L_{x} L_{z}} \int_{0}^{L_{z}} \int_{0}^{L_{x}} \left|\frac{\partial \eta_{d}(x, z)}{\partial x}\right| \mathrm{d} x \,\mathrm{d} z. \end{equation}
Substituting the expression for  $\eta _{d}$ into the above definition, we can obtain
 $S=( {\rm \pi}/8 )k/\lambda$. Moreover, it can be easily derived that the roughness steepness has a relation with the traditional solidity parameter, i.e.
 $S = 2\Lambda$ (Schlichting Reference Schlichting1936; MacDonald et al. Reference MacDonald, Chan, Chung, Hutchins and Ooi2016).
Flow and roughness parameters.  ${{N}_{wx}}$ and
 ${{N}_{wz}}$ denote the numbers of roughness elements in the streamwise and spanwise directions, respectively.

3. Results and discussion
3.1. Determination of  $k_{s}^{+}$

The presence of roughness causes a downward shift in the viscous-scaled mean velocity profile. The logarithmic law for a smooth wall can be expressed as
 \begin{equation} U_{s}^{+}=\frac{1}{\kappa }\ln \left( {{y}^{+}} \right)+C, \end{equation}
where  $\kappa$ denotes the Kármán constant and C is the offset constant. The exact values of these constants are the subject of vigorous debate, and those for channel flows are also slightly different from those of pipe flows and boundary-layer flows (Marusic et al. Reference Marusic, Monty, Hultmark and Smits2013). Here,
 $\kappa$ and
 $C$ were set at 0.40 and 5.3, respectively. For a rough wall, the logarithmic law can be expressed as
 \begin{equation} U_{r}^{+}=\frac{1}{\kappa }\ln \left( {{y}^{+}} \right)+C-{\rm \Delta} {{U}^{+}}= \frac{1}{\kappa }\ln \left( \frac{y}{k} \right)+C-{\rm \Delta} {{U}^{+}}+ \frac{1}{\kappa }\ln \left( \frac{k}{{{\delta }_{\nu }}} \right). \end{equation}
Specifically, in the fully rough regime, it needs to meet the condition (Hama Reference Hama1954):
 \begin{equation} C-{\rm \Delta} U^{+}+\frac{1}{\kappa} \ln \left(k^{+}\right)=B, \end{equation}
where the intercept constant  $B$ depends on the specific roughness form.
Figure 2 shows the mean velocity profiles for various rough-wall conditions. In general, these mean velocity profiles satisfy the logarithmic law beyond a certain position. For the first-order statistics, the hypothesis of outer-layer similarity holds for all conditions. Figure 2(a) shows the effects of varying the roughness size on the velocity profile. The roughness function  ${\rm \Delta} {{U}^{+}}$ increases with increase in the roughness size. Figures 2(b) and 2(c) show that decreasing the roughness wavelength (with fixed
 ${{k}^{+}}$) and increasing the roughness height (with fixed
 ${{\lambda }^{+}}$) both lead to an increase in
 ${\rm \Delta} {{U}^{+}}$. Both of these results can be interpreted in terms of the roughness steepness S. An increase in S corresponds to an increase in the roughness solidity, which can be represented as the frontal area divided by the plane area. The increment in
 ${\rm \Delta} {{U}^{+}}$ gradually decreases as S increases.
Profiles of  ${{U}^{+}}$ for (a) group A, (b) group B, (c) group C and (d)
 ${\rm \Delta} {{U}^{+}}$ versus
 $k^{+}$ (grey) and
 ${\rm \Delta} {{U}^{+}}$ versus
 $k_{s}^{+}$ (red).

We used the mean offsets in the range 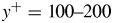 ${{y}^{+}}=100\text {--}200$ to calculate the roughness function
 ${\rm \Delta} {{U}^{{+}}}$. Figure 2(d) plots the variation of
 ${\rm \Delta} {{U}^{+}}$ with
 $k^{+}$ and also the equivalent sand grain roughness height
 $k_{s}^{+}$. For a uniform sand grain surface, the intercept B in (3.3), which is known as Nikuradse's constant (Flack & Schultz Reference Flack and Schultz2010), is approximately 8.5. The equivalent sand grain roughness height
 $k_{s}^{+}$ can then be determined from the roughness function
 ${\rm \Delta} {{U}^{{+}}}$ in the fully rough regime:
 \begin{equation} C-{\rm \Delta} U^{+}+\frac{1}{\kappa} \ln \left(k_{s}^{+}\right)=8.5. \end{equation}
In figure 2(d), the dashed line indicates  ${\rm \Delta} {{U}^{+}}=(1/\kappa) \ln ( {{k}^{+}} )+C-B$, and the dash-dotted line indicates Nikuradse's fully rough asymptote
 ${\rm \Delta} {{U}^{+}}=(1/\kappa) \ln ( k_{s}^{+} )+C-B$. In the fully rough regime, the roughness function follows a logarithmic dependence on the roughness Reynolds number. From figure 2(d), it is seen that the dashed line approaches Nikuradse's fully rough asymptote by shifting a distance of 3.7 along the logarithmic abscissa. Thus, we obtain the relation
 $k_{s}^{+}=3.7{{k}^{+}}$ for the current sinusoidal roughness type, which is a typical k-type roughness (Leonardi, Orlandi & Antonia Reference Leonardi, Orlandi and Antonia2007). Note that only the two cases (
 ${{k}^{+}}=60$ and
 ${{k}^{+}}=80$) in group A fall onto the fully rough asymptote, whereas the other cases belong to the transitional rough regime. According to the different slopes in the profiles of
 ${\rm \Delta} {{U}^{+}}$ versus
 $k^{+}$, the relation
 $k_{s}^{+}=3.7{{k}^{+}}$ cannot be applied to groups B and C, and thus the profile of
 ${\rm \Delta} {{U}^{+}}$ versus
 $k_{s}^{+}$ is only plotted for group A. For group B, even if
 ${k}^{+}$ increases further,
 ${\rm \Delta} {{U}^{+}}$ does not reach Nikuradse's fully rough asymptote. This result is mainly attributed to the limited roughness height (
 ${{k}^{+}}=30$). An appropriate roughness height (at least
 ${{k}^{+}}>30$) is required to produce the fully rough regime. For group C, if we continue to increase the roughness height, it will reach the fully rough asymptote. The rough-pipe DNS data of Chan et al. (Reference Chan, MacDonald, Chung, Hutchins and Ooi2015) are also included for comparison in figure 2(d), for which
 $k_{s}^{+}=4.1{{k}^{+}}$, a value close to the present data. For
 ${{k}^{+}}>60$, the variation of
 ${\rm \Delta} {{U}^{+}}$ with
 $k_{s}^{+}$ falls onto the fully rough asymptote. The present sinusoidal roughness reaches the fully rough regime for
 $k_{s}^{{+}}>200$, which is much larger than that obtained by considering Nikuradse's sand grain roughness, i.e.
 $k_{s}^{+}>70$. This difference may be caused by the difference in the local roughness steepness between Nikuradse's sand grain surface and the current sinusoidal roughness.
3.2. Scaling of the roughness function
The roughness function depends on both the roughness height and the roughness steepness, which can be understood from the above analysis about the downward shift of the mean velocity profile. The roughness function  ${\rm \Delta} {{U}^{+}}$ is plotted against
 ${{k}^{+}} S$ in figure 3(a). All the data collapse onto a single line, i.e.
 \begin{equation} {\rm \Delta} U_{e s t}^{+}=2.66\, \left[\log \left(k^{+} S\right)\right]+1.46, \end{equation}
where  ${\rm \Delta} U_{est}^{+}$ is the predicted roughness function of
 ${{k}^{+}} S$ fitted with a linear logarithm function. The goodness-of-fit
 ${{R}^{2}}$ is close to 0.97 for the above fitting function equation (3.5). This fit shows that rough walls constructed with different roughness heights and roughness wavelengths exhibit similar behaviour:
 ${\rm \Delta} {{U}^{+}}$ increases monotonically with increases in
 ${{k}^{+}} S$. According to (3.5), the slope equals 2.66 and is slightly different from
 $1/\kappa$ as dictated in (3.4). This difference could be related to the fact that these cases are mainly in the transitional rough regime. Note that similar coupling scales were explored in the previous studies. For instance,
 ${{k}_{rms}^{+}} S$ was considered in Flack et al. (Reference Flack, Schultz and Rose2012), and Chan et al. (Reference Chan, MacDonald, Chung, Hutchins and Ooi2015) proposed a more general log-linear fitting model based on
 ${{k}^{+}}$ and
 $S$. The present coupling scale can be regarded as a special case of those of Chan et al. (Reference Chan, MacDonald, Chung, Hutchins and Ooi2015).
Variations of (a)  ${\rm \Delta} {{U}^{+}}$, (b)
 ${{\gamma }_{p}}$, (c)
 $U_{b}^{+}$ with
 ${{k}^{+}} S$ and (d)
 ${\rm \Delta} {{U}^{+}}$ versus
 ${\rm \Delta} U_{est}^{+}$.

To further examine the physical meaning of the coupling scale  ${{k}^{+}} S$, the ratio
 ${{\gamma }_{p}}$ of the pressure drag to the total drag force is plotted in figure 3(b) as a function of
 ${{k}^{+}} S$. A good fit also arises for
 ${{\gamma }_{p}}$, which indicates that
 ${\rm \Delta} {{U}^{+}}$ is strongly dependent on
 ${{\gamma }_{p}}$. Note that when
 ${{k}^{+}} S$ is small, the frictional drag dominates, whereas when
 ${{k}^{+}} S$ is higher, in the fully rough regime, the pressure drag dominates. In addition, the scaling property of the normalized bulk mean velocity
 $U_{b}^{+}$ is plotted in figure 3(c) as a function of
 ${{k}^{+}} S$. The normalized bulk mean velocity
 $U_{b}^{+}$ actually reflects the variation of
 ${{1}/{u}_{\tau }}$. The result shows that
 $U_{b}^{+}$ scales well with
 ${{k}^{+}} S$. In figure 3(d),
 ${\rm \Delta} U_{est}^{+}$ obtained from (3.5) is compared with the actual
 ${\rm \Delta} {{U}^{+}}$ from the present simulations, together with some published data. Several roughness forms were chosen: a three-dimensional ‘egg-carton’ rough pipe (Chan et al. Reference Chan, MacDonald, Chung, Hutchins and Ooi2015), irregular random two-dimensional sinusoidal roughness (Napoli et al. Reference Napoli, Armenio and De Marchis2008), close-packed right-angle pyramids (Schultz & Flack Reference Schultz and Flack2009) and random sand grain roughness (Yuan & Piomelli Reference Yuan and Piomelli2014). Moreover, the average roughness height (Napoli et al. Reference Napoli, Armenio and De Marchis2008; Yuan & Piomelli Reference Yuan and Piomelli2014) and the peak-to-trough roughness height (Schultz & Flack Reference Schultz and Flack2009) were chosen as in the literature. These results clearly show that the roughness function for all these rough surfaces, both regular and random, two-dimensional and three-dimensional, depends on
 ${{k}^{+}} S$. The differences among these different roughness forms arise in the intercepts of (3.5). In addition, data scattering in the comparison between the roughness function of different roughness forms and the proposed prediction model can also be observed in figure 3(d), as marked by blue symbols. Further discussion will be given in the conclusions.
3.3. Scaling of the drag coefficient
The roughness function exhibits a good scaling behaviour with  ${{k}^{+}} S$, and the roughness function is closely related to the increase in wall resistance. Figure 4(a) shows the relationship between the wall drag coefficient and
 ${{k}^{+}} S$. The vertical coordinate is defined as the drag increase ratio
 $DI={({{C}_{f}}-{{C}_{f,0}} )}/{{{C}_{f,0}}}$, where
 ${C}_{f,0}$ denotes the smooth-wall drag coefficient. In this figure,
 $DI$ is fitted with a second-order polynomial. Almost all the data points fall on the fitting asymptote, and the goodness-of-fit
 ${{R}^{2}}$ is close to 0.99. Note that
 ${{C}_{f}}$ approaches the smooth-wall result of
 ${{C}_{f,0}}=0.0059$ (Moser, Kim & Mansour Reference Moser, Kim and Mansour1999) for
 ${{k}^{+}} S=0$, i.e. DI tends to zero as
 ${{k}^{+}} S$ decreases. In addition, an expression for DI can also be derived from its definition, which is often used in drag reduction designs (Garcia-Mayoral, Gómez-de Segura & Fairhall Reference Garcia-Mayoral, Gómez-de Segura and Fairhall2019), while in the present study it is considered in the prediction of drag increase of rough walls. The friction Reynolds number is assumed to be constant in both smooth- and rough-wall flows, and
 $U_{b,0}^{+}-U_{b}^{+}$ is assumed to be equal to
 ${\rm \Delta} {{U}^{+}}$, where
 $U_{b,0}^{+}$ is the viscous-scaled bulk velocity of the smooth wall and
 $U_{b}^{+}$ is that of the rough wall. Note that this is an approximation since
 ${\rm \Delta} {{U}^{+}}$ is usually determined within the log layer. Then DI is expressed as
 \begin{equation} D I=\left(1-{\rm \Delta} U^{+} / U_{b, 0}^{+}\right)^{-2}-1. \end{equation}
Figure 4(b) compares the drag increase ratio DI calculated from (3.6) with the present results and those obtained in the previous studies (Chan et al. Reference Chan, MacDonald, Chung, Hutchins and Ooi2015; MacDonald et al. Reference MacDonald, Chan, Chung, Hutchins and Ooi2016; Busse, Thakkar & Sandham Reference Busse, Thakkar and Sandham2017; Ma, Alamé & Mahesh Reference Ma, Alamé and Mahesh2019; Ganju et al. Reference Ganju, Davis, Bailey and Brehm2019). Good agreement with (3.6) is evident in all cases, which indicates that the relationship for wall resistance prediction is also valid for other roughness forms. In fact, we can also obtain an approximate relationship of the drag increase DI with  ${{k}^{+}} S$ by substituting the predicted roughness function equation (3.5) into (3.6), but the fitted curve in figure 4(a) is more intuitive. Accordingly, for a given rough surface, relative increases in wall resistance due to roughness elements can be estimated directly from
 ${{k}^{+}} S$ or
 ${\rm \Delta} {{U}^{+}}$, which is of great significance to practical applications.
Variations of (a) DI with  ${{k}^{+}} S$ and (b) DI with
 ${\rm \Delta} {{U}^{+}}$.

3.4. Scaling of velocity fluctuations
The presence of roughness elements has a significant effect on the velocity fluctuations. According to the phase average and triple decomposition, the second-order velocity correlation can be decomposed into three parts, i.e.
 \begin{equation} \overline{u_{i} u_{j}}=\overline{\left(\overline{u_{i}}+\tilde{u}_{i}+u_{i}^{\prime}\right) \left(\bar{u}_{j}+\tilde{u}_{j}+u_{j}^{\prime}\right)}=\bar{u}_{i} \bar{u}_{j}+ \overline{\tilde{u}_{i} \tilde{u}_{j}}+\overline{u_{i}^{\prime} u_{j}^{\prime}}, \end{equation}
where the second and third terms on the right-hand side are the dispersive and Reynolds stresses, which correspond to the wave-induced and turbulent components, respectively. Figure 5 shows the streamwise Reynolds stresses obtained by using the triple decomposition. In figure 5(a), it can be seen that the streamwise Reynolds normal stress for the smooth wall reaches its maximum at  ${{y}^{+}}\approx 15$ (Jimenez Reference Jimenez2004). For rough walls, as the roughness size increases, the intensity of the peaks tends to decrease and they move outward away from the wall. This result indicates that as the roughness size increases, the typical coherent structures near the wall are disrupted, and the turbulent fluctuations are weakened. Correspondingly, the wave-induced fluctuations due to roughness are enhanced (not shown here). At the same time, the turbulent active region is elevated. Figure 5(c) shows that the results for group C are similar to those for group A. Moreover, these curves coincide with that for the smooth wall for
 ${{y}^{+}}>100$. For group A with large
 ${{k}^{+}}$, e.g.
 ${{k}^{+}}= 60$ and 80, there are slight downward shifts in the rough wall results from the smooth-wall case and the outer-layer similarity is no longer obvious. As the roughness size increases, a higher vertical position is required to achieve similarity in the outer region. This result probably arises because the channel flow is an internal flow for which
 $\delta$ is fixed, and larger roughness elements have a greater impact on the outer-layer similarity. In figure 5(b), the peaks increase as the roughness wavelength increases. However, this increase is not obvious for rough-pipe flows (Chan et al. Reference Chan, MacDonald, Chung, Hutchins and Ooi2018). All the data in group B have the same roughness height, so the peak locations are approximately at the same vertical positions, except for
 ${{\lambda }^{+}}=848$. In the outer region, the data coincide with those for the smooth wall for
 ${{y}^{+}}>100$, and the data for the smallest wavelength in group B, i.e.
 ${{\lambda }^{{+}}}=188$, are slightly higher than those for the smooth wall. The cases with different roughness wavelengths, for instance the sparsest case
 ${{\lambda }^{+}}=848$ and the densest case
 ${{\lambda }^{+}}=188$, differ mainly in roughness density.
Profiles of the streamwise Reynolds stresses for (a) group A, (b) group B, and (c) group C. (d) The peak intensity of the streamwise turbulent velocity fluctuations versus  ${{k}^{+}} S$.

We found that the Reynolds stresses are strongly correlated with both  ${{k}^{+}}$ and S, as is
 ${\rm \Delta} {{U}^{+}}$. Figure 5(d) shows the statistics for the peak values of streamwise turbulent velocity fluctuation
 $\overline {u_{p}^{\prime +}}$ with respect to the coupling scale
 ${{k}^{+}} S$. The data fall on a single line. In order to express this relationship more clearly, a linear–log fit was computed, i.e.
 \begin{equation} \overline{u_{p}^{\prime+}}=-0.26\, \left[\log \left(k^{+} S\right)\right]+2.5, \end{equation}
which indicates that roughness elements with similar  ${{k}^{+}} S$ have similar effects on turbulence fluctuations. This fit is even better than that for
 ${\rm \Delta} {{U}^{+}}$ as depicted in (3.5) since
 ${{R}^{2}}$ is close to 0.99. Orlandi (Reference Orlandi2013) found a correlation between the roughness function and the r.m.s. wall-normal velocity fluctuation at the plane of the crests and proposed that the equivalent sand grain roughness can be replaced with the velocity fluctuations. Our results show that the roughness function also has a strong correlation with the peak values of the turbulence fluctuation intensity and thus the coupling scale
 ${{k}^{+}} S$ provides an alternative to
 $k_{s}^{+}$ as a means of characterizing rough walls.
4. Conclusions
In the present study, DNSs with a body-conforming grid were performed for turbulent channel flows over three-dimensional sinusoidal rough walls. By systematically varying the roughness height  ${{k}^{+}}$ or roughness steepness S, three groups of cases were chosen and compared with those arising for flat-wall turbulence. We demonstrated that the combination of
 ${{k}^{+}}$ and S, i.e.
 ${{k}^{+}} S$, produces a predictive scheme that performs significantly better and is more reliable than
 ${{k}^{+}}$ or S alone. Note that
 ${{k}^{+}} S$ is a coupling scale between the inner and outer scales, i.e.
 $k^{+} S\sim (k / \delta _{v})(k / \lambda )$, similar to that proposed for scaling in the overlap region of high-Reynolds-number wall turbulence (Smits, McKeon & Marusic Reference Smits, McKeon and Marusic2011). Furthermore, a wall resistance increasing ratio can be defined to capture the predictive relationship between the total drag coefficient and the roughness function. As a result, the wall drag coefficient can be estimated directly from the known roughness parameters of the surface, i.e.
 ${{C}_{f}}\sim f( {{k}^{+}} S )$.
Note also the limitations of the current scaling behaviour. When  $S$ is very large or small, the predicted behaviour would become incorrect. Rough forms with a smaller roughness steepness are generally considered to have two-dimensional roughness properties and result in what is known as the waviness regime (Mejia-Alvarez & Christensen Reference Mejia-Alvarez and Christensen2013). In the case presented above, when the roughness steepness decreases to 0.09 (
 ${{k}^{+}}=30$,
 ${{\lambda }^{+}}=848$), the roughness function begins to deviate from the fitting line. On the other hand, when S is large, an increase in the roughness height or a decrease in the roughness wavelength can cause the flow to enter the dense roughness regime. At this point, the roughness function begins to decline with S. On the other hand, the fitting line of the roughness function tends to rise monotonically, and so fails within this regime. All the cases of the present study lie outside the dense roughness regime. Nevertheless, some cases of Chan et al. (Reference Chan, MacDonald, Chung, Hutchins and Ooi2015), Schultz & Flack (Reference Schultz and Flack2009) and Yuan & Piomelli (Reference Yuan and Piomelli2014) deviate from the fitting line, and are marked as blue symbols in figure 3(d). A perusal of the reference data revealed that the deviation is caused by either small or large
 $S$. Therefore, the current scaling is applicable to different roughness forms within a certain range of
 $S$. Moreover, for irregular rough surfaces, more roughness parameters besides
 ${{k}^{+}}$ and S should be taken into account to improve the prediction model, as in Thakkar et al. (Reference Thakkar, Busse and Sandham2017).
It was not the focus of the present study to distinguish the waviness and dense roughness regimes because all the simulated data could be fitted satisfactorily. Here, we focused on the scaling of the turbulence statistics in the intermediate roughness regime, where the roughness height  ${k}^{+}$ and roughness steepness S act in concert. The good scaling behaviour of
 ${{k}^{+}} S$ when applied to the first- and second-order turbulence statistics indicates that it is an important roughness parameter that provides an alternative roughness parametrization to the equivalent sand grain roughness
 ${{k}_{s}}$. In addition, it should be pointed out that the roughness form studied here is three-dimensional regular roughness and that the universality of the proposed coupling scale for other types of roughness forms needs further investigation.
Acknowledgements
The authors acknowledge funding support from the National Natural Science Foundation of China under grants numbers 11772172 and 91752205 and from the National Research Foundation of Korea under grant number 2019M3C1B7025091.
Declaration of interests
The authors report no conflict of interest.



