Waterhemp (Amaranthus tuberculatus) is a summer annual weed that is indigenous to the midwestern United States and is becoming more prevalent and problematic in agronomic crop production (Hager et al. Reference Hager, Wax, Stoller and Bollero2002; Sauer Reference Sauer1967). Waterhemp’s increasing prevalence is due to its tendency to emerge from the soil surface, coupled with an increase in conservation tillage acres (Culpepper Reference Culpepper2006; Givens et al. Reference Givens, Shaw, Kruger, Johnson, Weller, Young, Wilson, Owen and Jordan2009; Leon et al. Reference Leon, Bassham and Owen2006). Two waterhemp species are recognized in the Midwest, Amaranthus rudis and A. tuberculatus, yet these two species are only differentiated by miniscule differences in their seed morphology; therefore, it has been proposed that these two species are to be wholly considered as one (Pratt and Clark Reference Pratt and Clark2001).
Waterhemp is a dioecious plant and is consequently an obligate outcrosser, possessing great genetic diversity (Costea et al. Reference Costea, Weaver and Tardif2005; Steckel Reference Steckel2007). The sex ratio of waterhemp and other Amaranthus species is variable. Pratt and Clark (Reference Pratt and Clark2001) report up to a 1:10 ratio of male:female waterhemp plants in Ohio. Bram and Quinn (Reference Bram and Quinn2000) observed a 1:1 ratio in salt-marsh waterhemp (Amaranthus cannabinus) in New Jersey until late in the growing season, when a higher proportion of female plants would occur, but this was attributed to male plants having already senesced. Menalled et al. (Reference Menalled, Liebman and Buhler2004) even observed that the addition of swine compost in a field experiment in Iowa slightly increased the proportion of male waterhemp plants, implying some potential for plasticity. Flowering timing of waterhemp is likened to that of other Amaranthus species, in that it is a facultative short-day plant that flowers in relation to photoperiod (Huang et al. Reference Huang, Shrestha, Tollenaar, Deen, Rahimian and Swanton2000; Wu and Owen Reference Wu and Owen2014).
Waterhemp is notorious for exhibiting a discontinuous germination pattern that extends well into the growing season, beyond the time period of many other summer annual weeds that infest agronomic crops (Hager et al. Reference Hager, Wax, Simmons and Stoller1997; Hartzler et al. Reference Hartzler, Buhler and Stoltenberg1999; Leon et al. Reference Leon, Bassham and Owen2006). This season-long emergence often allows waterhemp to grow after all weed management actions have been completed and can oftentimes lead to contributions to the soil seedbank (Brewer and Oliver Reference Brewer and Oliver2007; Hartzler et al. Reference Hartzler, Battles and Nordby2004; Steckel and Sprague Reference Steckel and Sprague2004). When allowed to develop for a full growing season in Illinois, waterhemp has demonstrated the ability to produce in excess of 1 million seeds plant−1 (Steckel et al. Reference Steckel, Sprague, Hager, Simmons and Bollero2003). Hartzler et al. (Reference Hartzler, Battles and Nordby2004) reported more than 4.8 million seeds plant−1 in Iowa. Conversely, in Missouri, Sellers et al. (Reference Sellers, Smeda, Johnson, Kendig and Ellersieck2003) reported 288,950 seeds plant−1 when the start of the season was slightly delayed. Despite the seeds only persisting for 4 to 5 yr in the soil, this high level of fecundity ensures a continuous waterhemp presence in the soil seedbank (Buhler and Hartzler Reference Buhler and Hartzler2001; Steckel et al. Reference Steckel, Sprague, Stoller, Wax and Simmons2007). Waterhemp seeds are also among the smallest in the Amaranthus family. Sellers et al. (Reference Sellers, Smeda, Johnson, Kendig and Ellersieck2003) reported 3,670 seeds g−1 from waterhemp, representing 32 to 105% more seeds g−1 than the other five Amaranthus species investigated in their study.
These prior studies demonstrate the growth and development of waterhemp; however, the environmental factors of varying locations and seasons greatly differed between all these studies. A common garden experiment, which evaluates multiple populations of interest in a single location, can allow for direct comparisons between populations of interest and can help demonstrate inherent differences between populations (Dorman et al. Reference Dorman, Sapir and Volis2009).
The growing issue of managing waterhemp in agronomic crops and the wide geographic spread of waterhemp across the midwestern United States creates the need for continued investigation into waterhemp growth and development across this geographic range. Establishing a common garden that includes various waterhemp populations from across the Midwest would allow for comparisons between different populations and could reveal inherent differences in these populations due to local adaption and selection pressures. The objective of this experiment was to establish a common garden with waterhemp populations from Indiana, Illinois, Missouri, Iowa, and Nebraska, and measure their growth and development characteristics in Indiana.
Materials and Methods
Field Plot Design
The experiment was conducted at the Throckmorton Purdue Agricultural Center (TPAC) near Lafayette, IN (40.30°N, 86.90°W) in 2014 and 2015. The research area soil types included both a Throckmorton silt loam (fine-silty, mixed, superactive, mesic Mollic Oxyaquic Hapludalfs) and an Octagon silt loam (fine-loamy, mixed, active, mesic Mollic Oxyaquic Hapludalfs). The soil pH was 6.7 and 6.9, and organic matter content was 3.0 and 2.9% in 2014 and 2015, respectively. The 2015 trial area was immediately adjacent to the 2014 trial area to avoid volunteer waterhemp plants.
The experiment was arranged as a split-plot design with planting date as the main plot and population as the subplot. Three planting dates were used each season to simulate a discontinuous emergence pattern: initial spring emergence, 21 d before summer solstice, and 21 d after summer solstice. In 2014 the planting dates were May 12, June 2, and July 14. In 2015 the planting dates were May 4, June 1, and July 13. Five populations from different states were used in this experiment: Benton County, IN (40.64°N, 87.34°W), Jackson County, IL (37.72°N, 89.32°W), Randolph County, MO (39.42°N, 92.50°W), Story County, IA (42.10°N, 93.50°W), and Clay County, NE (40.60°N, 98.05°W). The seed for these populations was collected in 2013 from waterhemp present in production environments. Each plot contained a single population, and the plot size was 3 by 10 m with three rows of waterhemp planted with 61 cm row spacing, centered within the plots, with four replications. To facilitate successful germination and emergence, the seedlings were initiated in a greenhouse on the previously mentioned planting dates using peat pellets (no. 736 Jiffy Peat Pellets, Hummert International, Earth City, MO) and thinned down to three plants per pellet after emergence. The pellets were then transplanted to the field at the 2- to 4-leaf stage 12 to 15 d after initiation. The seedlings were transplanted to the field by making a 5-cm-wide by 5-cm-deep cylindrical hole in the soil and then placing the entire peat pellet in the hole and covering it with soil. Transplants were watered at the time of transplanting and were thinned down to 30 plants per plot or 10 plants per row after successful establishment. The plot areas were weed free at trial initiation and were maintained weed free by mechanical cultivation once the waterhemp plants were established.
Data Collection
Weekly data collection included measuring waterhemp plant heights and monitoring flower emergence. To record plant height, 12 nonadjacent plants, where possible, were permanently marked, and the heights of these plants were recorded weekly. The height measurements were conducted from transplanting until 1 wk after flowering was complete. The number of flowering plants was also recorded weekly in each plot and calculated as a percentage of plants that had flowered in all replications. At the completion of flowering, the male-to-female ratio was recorded in each population as determined by the reproductive flower structures on each plant. The aboveground biomass from three representative female plants from each plot was harvested 4 wk after the collective average of the plots in that planting had surpassed 90% flowering, allowing time for seed maturation, yet maintaining seed retention on the plant. Plant biomass and seed yield were quantified from the harvested plants. Plant material was dried in a greenhouse with air temperatures of 20 to 35 C until weight was consistent. Whole-plant biomass was recorded, and seed was threshed from the plants, passed through screens, and further cleaned with a vertical column seed blower until foreign matter was removed. The total weight of the seed lots was recorded; three subsamples, each consisting of 100 seeds, were counted and weighed; and the averages of these measurements were used to determine the number of seeds per gram and to extrapolate the number of seeds per plant.
Data Analysis
Male-to-female ratios were compared with an expected 50:50 ratio with a Pearson’s chi-square test at P=0.05, with df =1 and χ2=3.841. The remaining analysis was performed with SAS (v. 9.3, SAS Institute, Cary, NC 27513). Plant biomass and seed yield data were subject to an ANOVA using PROC MIXED at P=0.05 significance level. Plant biomass data were untransformed, whereas seed yield data were subjected to square-root transformation to achieve normality assumptions. Year was not found to be significant; therefore, data were pooled across years. Growing degree day (GDD) values were calculated for the flowering timing data as the mean of the minimum and maximum temperatures minus a base temperature of 10 C using weather from the TPAC local weather station.
Plant height data were fit to a four-parameter growth model:
 $$y\,{\equals}\,c{\plus}{{d {\minus} c} \over {1 {\plus} {\rm exp}[b \,{\asterisk}\, \left( {x {\minus} i50} \right)]}} $$
where y=height (cm) at time x (wk), c= maximum height (cm), d=minimum height (cm), I50=inflection point, or time to reach 50% of the final height (weeks after transplanting), and b=rate of change about I50. PROC NLMIXED was used to estimate variable values for each individual plot. Model fit was evaluated with root mean square error (RMSE) and modeling efficiency coefficients (EF) (Sarangi et al. Reference Sarangi, Irmak, Lindquist, Knezevic and Jhala2016). RMSE was calculated with the following equation:
 $$RMSE\,{\equals}\, \left[ {{1 \over n}\mathop \sum\limits_{i\,{\equals}\,1}^n \left( {P_{i} {\minus}O_{i} } \right)^{2} } \right]^{{{1 \over 2}}} $$
where P i is the model-predicted value, O i is the observed value, and n is the number of observations. EF was used instead of R2 because of the high bias that R2 calculations have toward highly parameterized models (Sarangi et al. Reference Sarangi, Irmak, Lindquist, Knezevic and Jhala2016; Spiess and Neumeyer Reference Spiess and Neumeyer2010). EF values were calculated with the following equation:
 $$EF\,\,{\equals}\,\,1{\minus}\left[ {\mathop \sum\limits_{i\,\,{\equals}\,\,1}^n \left( {O_{i} {\minus}P_{i} } \right)^{2} \,/\,\mathop \sum\limits_{i\,\,{\equals}\,\,1}^n (O_{i} {\minus}\bar{O}_{i} )^{2} } \right] $$
where O
i
is the observed value, P
i
is the model-predicted value,
 $$\overline{O} _{i} $$
is the mean observed value, and n is the number of observations. EF values can range from −∞ to 1, with values closer to 1 indicating a better model fit and more accurate estimates.
Once parameters were estimated, PROC MIXED was used to conduct an ANOVA on the maximum height (c), inflection point (I50), and rate of change (b) at a P=0.05 significance level.
Results and Discussion
Flowering Timing
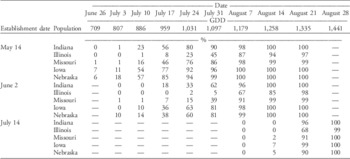
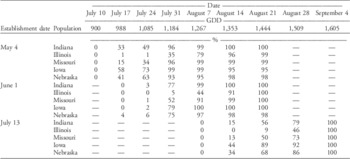
Waterhemp plants established in May initiated flowering earlier in 2014 compared with 2015, despite a 10 d delay in planting in 2014 compared with 2015. In both years, all populations had exceeded 94% flowering by August 14, with 1,258 and 1,353 GDD accumulated since March 1 in 2014 and 2015, respectively (Tables 1 and 2). In both years, the Illinois population was the slowest population to initiate flowering and to achieve 90% flowering.
Percentage of flowered plants by date and growing degree day (GDD) accumulation from five waterhemp populations grown at a single Indiana location and established on three different dates in 2014.

Percentage of flowering plants by date and growing degree day (GDD) accumulation from five waterhemp populations grown at a single Indiana location and established on three different dates in 2015.

Waterhemp plants established in June again initiated flowering sooner in 2014, with similar planting dates and GDD accumulations. Despite the earlier start in 2014, flowering from all populations in both years had surpassed 85% by August 14 and 95% by August 21, with comparable GDD accumulations in both years (Tables 1 and 2).
Waterhemp plants established in July initiated flowering by August 14 with 1,258 and 1,353 GDD accumulated in 2014 and 2015, respectively (Tables 1 and 2). Flowering had exceed 99% by the August 28 observation in 2014 but did not exceed 99% until the September 4 observation in 2015 (Tables 1 and 2). The July establishment date flowered the soonest after planting and progressed rapidly, presumably induced by late-season environmental triggers such as a shifting photoperiod and decreasing temperatures (Huang et al. Reference Huang, Shrestha, Tollenaar, Deen, Rahimian and Swanton2000; Steckel et al. Reference Steckel, Sprague, Hager, Simmons and Bollero2003).
Male-to-Female Ratio
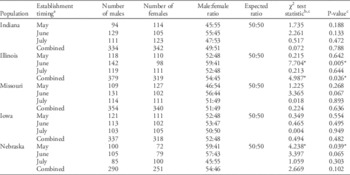
The male-to-female ratio was analyzed by establishment date and also as a combined data set. There were few deviations from the expected 50:50 male-to-female ratio. The Nebraska population established in May and the Illinois population established in June both had a 59:41 male-to-female ratio, with P-values of 0.039 and 0.005, respectively (Table 3). The Illinois population overall also contained a higher percentage of male-to-female plants at a 54:46 male-to-female ratio, with a P-value of 0.029 (Table 3). This appears to be heavily influenced by the high number of male plants in the June establishment date. All other populations and planting dates did not differ from the expected 50:50 male-to-female ratio, suggesting no widespread or inherent bias toward either male or female waterhemp plants.
Observed male-to-female ratio from five waterhemp populations grown in a single Indiana location in 2014 and 2015.

a Data were pooled across years.
b χ2 test statistic were calculated with df=1 and a critical value of χ2=3.841.
c χ2 test statistic and P-values followed by an asterisk (*) are significant at a P=0.05 level.
Plant Biomass
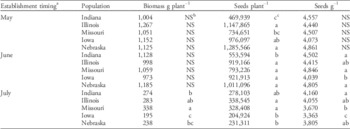
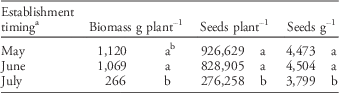
Biomass accumulations were analyzed within establishment date and across establishment dates, allowing for comparisons among waterhemp populations and time. Plant biomass accumulation within a planting date was only influenced by the waterhemp population in the July establishment date. The Missouri population, with the greatest biomass accumulation, amassed 58% more biomass than the Iowa population, which accumulated the least, with 338 and 195 g of biomass, respectively (Table 4). Biomass accumulation was drastically reduced in the July establishment date compared with the May or June establishment date. Combining all populations together, the May and June establishment dates accumulated 1,120 g and 1,069 g of plant biomass, respectively, compared with only 266 g of plant biomass from the July planting date (Table 5). This is due largely to the shorter season, rapid initiation of flowering, and a consequential decrease in vegetative growth from the plants from the July establishment date.
Mean plant biomass and seed yield for five waterhemp populations grown in a single Indiana location in 2014 and 2015.

a Data were pooled across years.
b Nonsignificant (NS) population effect.
c Means followed by the same letter, within establishment date and response variable, are not different at a P=0.05 significance level.
Mean plant biomass and seed yield for three establishment dates of waterhemp grown in Indiana.

a Data were pooled across years.
b Means followed by the same letter, within response variable, are not different at a P=0.05 significance level.
Seed Yield
Seed yield was also analyzed within establishment date and across establishment dates. The Indiana and Missouri waterhemp populations yielded the fewest seeds per plant in the May establishment dates, with a mean yield of 469,939 and 734,651seedsplant−1, respectively (Table 4). The Nebraska, Illinois, and Iowa waterhemp populations yielded the most seeds per plant in the May establishment dates, with a mean yield of 1,285,556, 1,147,865, and 976,097 seeds plant−1, respectively (Table 4). In the June establishment date, with the exception of the Indiana population, all the other populations were similar in seeds per plant yield with a range of 793,226 to 1,011,096 seeds plant−1 (Table 4). The Indiana waterhemp population yielded the fewest seeds per plant in the June establishment with a mean yield of 553,594 seeds plant−1 (Table 4). In the July establishment date, yields ranged from 204,924 to 338,545 seeds plant−1 (Table 4).
When seed yields per plant were compared across planting dates, the mean yields of 926,629 and 828,905 seeds plant−1 from the May and June establishment dates were higher than the yield of 276,258 seeds plant−1 from the July establishment date (Table 5). With seed production in excess of 1 million seeds plant−1 from multiple populations in both the May and June establishment dates, the seed yield potential of waterhemp in a full-season setting is undoubtedly a key component of its success as a weed. In addition to this, when considering the late-season July establishment, every population was able to produce more than 200,000 seeds plant−1. The seed yields from all of these establishment dates demonstrate the prolific seed production capabilities of waterhemp, regardless of when in the season the plant germinates.
Seed size was also quantified, and when compared across planting dates, seed size was similar in the May and June establishment dates, with a mean 4,473 and 4,504 seeds g−1, respectively (Table 5). The July establishment date produced the largest seeds, with a mean of 3,799 seeds g−1, a number comparable to that reported by Sellers et al. (Reference Sellers, Smeda, Johnson, Kendig and Ellersieck2003) (Table 5). Within establishment dates, there was no difference in seeds per gram from the populations established in May. The June establishment date ranged from 4,039 to 4,846 seeds g−1, and the July establishment date ranged from 3,363 to 4,160 seeds g−1 (Table 4). Despite the drastically lower seed yield per plant from the July establishment date, the largest seeds were produced by plants from this timing. This phenomenon could be due to the rapid shift from vegetative growth to reproductive growth induced by late-season environmental effects (Steckel et al. Reference Steckel, Sprague, Hager, Simmons and Bollero2003; Vengris Reference Vengris1963).
Growth Modeling
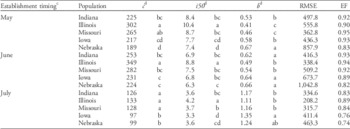
The growth of the five populations was modeled for each establishment date using a four-parameter logistic equation. Analysis was separated by establishment date. RMSE values ranged from 208.2 to 1,042.8, and EF values ranged from 0.74 to 0.95, signaling a good model fit (Table 6). Depending on the nature of the measurement, Sarangi et al. (Reference Sarangi, Irmak, Lindquist, Knezevic and Jhala2016) obtained RMSE values of 7.2 to 9,000, with EF values of 0.43 to 0.90, citing high variability leading to the highest RMSE values.
Estimated maximum height, inflection point, rate of change and goodness of fit (RMSE and EF)Footnote a from a four-parameter logistic functionFootnote b for five waterhemp populations grown in a single Indiana location in 2014 and 2015.

a Abbreviations: RSME, root mean square error; EF, modeling efficiency coefficient.
b y=c+(d − c)/(1+exp [b * (x − i50)], where y=height (cm) at time x (weeks after transplanting), c=maximum height (cm), d=minimum height (cm), i50=inflection point, or time to reach 50% of the final height (weeks after transplanting), and b=rate of change about i50.
c Data were pooled across years.
d Values followed by the same letter, within establishment date and response variable, are not different at a P=0.05 significance level.
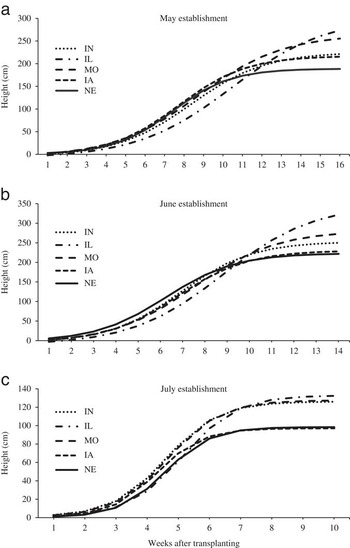
In both the May and June establishment dates, the Illinois population had the greatest estimated maximum height at 302 and 349 cm, respectively (Table 6). The Illinois population was also estimated to have the greatest I50, at 10.4 and 8.8 wk after transplanting, respectively, indicating the Illinois population took the greatest amount of time to reach half of its maximum height, despite being the tallest population (Figure 1). This relatively slow yet steady increase in height may be related to the delayed flowering and extended vegetative growth also observed in the Illinois population.
The four-parameter logistic modeled growth curves (Equation 1) of five waterhemp populations from (a) May, (b) June, and (c) July, grown in Indiana.

In the July establishment, all populations took between 3.3 and 4.2 wk to reach I50, the smallest range of any establishment date (Table 6). The Indiana, Illinois, and Missouri populations predicted c values are considerably greater than the Iowa and Nebraska populations at the July establishment date, and the Iowa and Nebraska populations were observed to flower sooner, especially in 2015 (Tables 1 and 2). The EF values in the July establishment were the lowest of all three establishments, and this relatively poorer fit is believed to be due to greater plant height variability observed later in the growing season.
Conclusions
The male-to-female ratio of waterhemp was largely observed to be a 50:50 ratio in all the populations, despite fluctuations in initiation and duration of flowering among populations. In the May and June establishments, there were no differences in the biomass production; however, there were differences in seed production, plant height, and growth rate. Seed production from the May and June establishments, which ranged from 469,939 to 1,285,566 seeds plant−1, demonstrated the high fecundity of multiple waterhemp populations when allowed to grow in a common environment with minimal competition. The July establishment date yielded smaller plants with lower biomass and seed production, but all populations were still able to produce in excess of 200,000 seeds plant−1. The July establishment demonstrated the most uniform flowering and highest b of all establishment dates, indicating quick and rapid growth, most likely due to the short season experienced by the waterhemp.
These populations exhibited differences in their phenology when they were grown in the same environment, indicating inherent genetic differences and further demonstrating the variability and growth potential of waterhemp.
Acknowledgments
The authors would like to thank the members of the Integrated Weed Management labs at Purdue University for their help in completing this research. The authors would also like to thank the Purdue Statistical Consulting Service and particularly Nathan Hankey for his assistance. The authors would like to recognize the United Soybean Board for funding this work.