I. INTRODUCTION
ZnS is a significant II–VI wide band-gap semiconductor material which has attracted a lot of interest due to its potential applications in various fields. It is a very important material for electronic industry with its usage ranging from efficient phosphors in flat panel displays, light-emitting diodes, and field emitters to UV light sensors, gas sensors,Reference Sunghoon, Soyeon, Hyunsung, Lee and Lee1 photovoltaics, photo catalysis,Reference Kole, Tiwary and Kumbhakar2,Reference Boxi and Paria3 etc. ZnS nanostructures in the form of micro/nanobelts having large surface area are suitable for UV detectors.Reference Liang, Liang, Xiaoa and Hark4 Also, ZnS exhibits a high exciton binding energy at room temperature which makes it further favorable candidate for light-emission based devices.Reference McCloy, Bliss, Miller, Wang and Stave5
ZnS has two structural polymorphs, the cubic zinc blende structure and hexagonal wurtzite structure having band-gaps of 3.72 eV and 3.77 eV, respectively, at room temperature. Quantum confinement in the synthesized ZnS nanoparticles has led to further improvement in their properties.Reference Fang, Zhai, Gautam, Li, Wu, Bando and Golberg6 It has been demonstrated by various groups that by controlling the structure and size of the ZnS nanoparticles, its properties can be tuned according to the required applications.Reference Li, Liu, Li, Yu, Wang, Hou, Zou, Yao, Li, Zou, Zou, Wang and Liu7,Reference Mendil, Ayadi and Djessas8
It is well known that pure ZnS emits at around 420 nm which is termed as self-activated emission.Reference Fang, Zhai, Gautam, Li, Wu, Bando and Golberg6 The luminescence properties of ZnS have been a hot topic of research and are reported to be highly tuned by external elements. Interstitial defects and vacancies also play an important role by forming intermediate energy levels in ZnS which act as luminescent centers. Donor levels are formed by the sulfur vacancies and zinc interstitials present in ZnS, whereas Zn vacancies and S interstitials form acceptor levels.Reference Geng, Liu, Du, We and Zhang9 Generally, the luminescence from ZnS is related to the sulfur and zinc vacancies or to the elemental sulfur species forming the surface states. The impurity states present in the material in the form of heavy-atom doping also contribute to the high luminescence yield. Thus, the interesting properties of ZnS have been further tailored by doping it with various metallic ions, such as Ag+, Au+, Mn+, Cu+,Reference Murase, Jagannathan, Kanematsu, Watanbe, Kurita, Hirata, Yazawa and Kushida10,Reference Lin and Su11 etc., or by conjugating it with other semiconductors like CdSe and CdS.Reference Lu, Zeng, Hu, Chen, Lei and Ren12,Reference Xu, Hu, Gao, Liu, Wageh, Al-Ghamdi, Alshahrie and Fang13 The emission intensity is reported to be enhanced by doping with Ag+ which is termed as silver activated emission.Reference Hao, Sun, Yang, Zhang, Liu and Shen14
These ZnS nanostructures with high luminescence emission have been shown to be synthesized by employing different methods such as dopingReference Hao, Sun, Yang, Zhang, Liu and Shen14,Reference Pan, Yang, Zhao, Ma, Dong and Qiu15 and creation of Zn or sulfur vacancies.Reference Lee and Park16 Recently, many articles suggesting the formation of green emitting ZnS nanostructures have been reported. The emission at around 525 nm is generally related to the charge carrier recombination from energy bands related to sulfur vacancies to the surface defects in ZnS.Reference Zhang, Zeng, Liu and Lu17 Doping of ZnS with Cu+, Mn+, or other rare earth ions also lead to emission in the green region and is attributed to varying doping levels.Reference Yang, Lu, Xu, Yuan and Zhou18 However, the green emission around 538 nm for pure ZnS nanotubes was assigned to vacancy states and defect sites.Reference Li, Liu, Li, Yu, Wang, Hou, Zou, Yao, Li, Zou, Zou, Wang and Liu7 Emission from pure ZnS nanobelts at 535 nm has also been related to the presence of elemental sulfur on the surface of nanostructures.Reference Ye, Fang, Li and Zhang19
The present work focusses on the synthesis and structural and optical study of pure ZnS and ZnS(Ag) powder. ZnS powder was synthesized by a chemical hydrothermal route and annealed at two different temperatures of 750 and 950 °C. The structural and morphological properties of the obtained nanostructures were studied by X-ray diffraction (XRD) and scanning electron microscopy, respectively. X-ray photoelectron spectroscopy (XPS) measurements were performed to understand the doping state and to rule out the presence of impurities in the synthesized powder. Ultra Violet-Visible (UV-Vis) spectroscopy and Photoluminescence (PL) measurements were performed to study their optical properties at room temperature. Characteristic blue emission was observed for the pure ZnS. However, for ZnS(Ag), it was observed that with the change in the annealing temperature from 750 to 950 °C, the energy of emitted radiation varied from the blue to green region of visible light. This change in the emitted wavelength may be attributed to the creation of additional sulfide defect states, due to the incorporation of excess Ag+ ions in the ZnS lattice. This shows a method to tune the ZnS luminescence just by changing the annealing temperature as well as it gives us better understanding of the mechanism of emission in ZnS(Ag).
II. EXPERIMENTAL METHODS
A. Material synthesis
Pure ZnS and Ag doped ZnS were synthesized by hydrothermal route using a Teflon-lined stainless-steel autoclave with a capacity of 250 mL. All the chemicals were analytical grade and were used without any further purification. 10 mM of zinc acetate [Zn(CH3COO)2] and 30 mM thiourea [NH2CSNH2] were dissolved completely in 20 mL deionized (DI) water in separate beakers. Thiourea was used in this experiment as it is a better sulfur producing agent during hydrothermal synthesis as compared to other sulfur agents like Na2S. The two solutions were further mixed together and added to 60 mL ethylenediamine (ED) with continuous stirring for 30 min. ED acts as a template for the growth of sheet-like structures of ZnS and does not play any other role in the synthesis process. For Ag doping, 0.2 mM AgNO3 was added to the final solution. Then the mixture was transferred to the autoclave which was then sealed and heated at 220 °C for 12 h. After cooling to room temperature, ZnS in the form of white precipitate was observed. The resulting precipitate was then separated from the solution using a centrifuge and washed repeatedly with DI water and ethanol using ultra-sonication. A white colored precipitate was observed for the pure ZnS, while a blackish-brown colored precipitate was obtained for the Ag doped ZnS. The products were further dried in air to obtain pure ZnS and Ag doped ZnS powders. The blackish-brown appearance of the Ag-doped ZnS powder may be due to the formation of the secondary Ag2S phase. The as synthesized powder was later annealed in a vacuum (of the order of 5 × 10⁻⁵ mbar) at 750 and 950 °C for 10 h.
B. Characterization techniques
The phase purity of the synthesized powder samples was evaluated using X-ray diffractometer (Rigaku Model: RINT 2000 Dmax, Cu Kα line, Rigaku, Tokyo, Japan). A Carl Ziess-Auriga field emission scanning electron microscope (FESEM) system (Carl Zeiss, Oberkochen, Germany) was used to study the morphology of the so obtained structures. PL studies were performed over a wavelength range from 200 to 800 nm by employing an Edinburg fluorescence spectrometer (model FLP920) in reflection geometry by positioning the samples at 45° with respect to the excitation beam. A xenon lamp was used as the excitation source, and a spectral bandwidth of 0.5 nm was selected for both excitation and emission monochromators. All the recorded luminescence spectra were corrected for the spectral sensitivity function of the instrument. The absorption spectra were recorded using a Shimadzu UV3600 spectrophotometer (Shimadzu, Kyoto, Japan). Ex situ XPS analysis on the sample was performed using a VG make model CLAM-2 hemispherical analyzer with the Mg Kα source (1253.6 eV) having a step size of 0.1 eV. The chamber pressure was maintained at 1 × 10⁻⁹ torr. Detailed fine scans were taken with pass energy 50 eV.
III. RESULTS AND DISCUSSION
A. Structural characterization
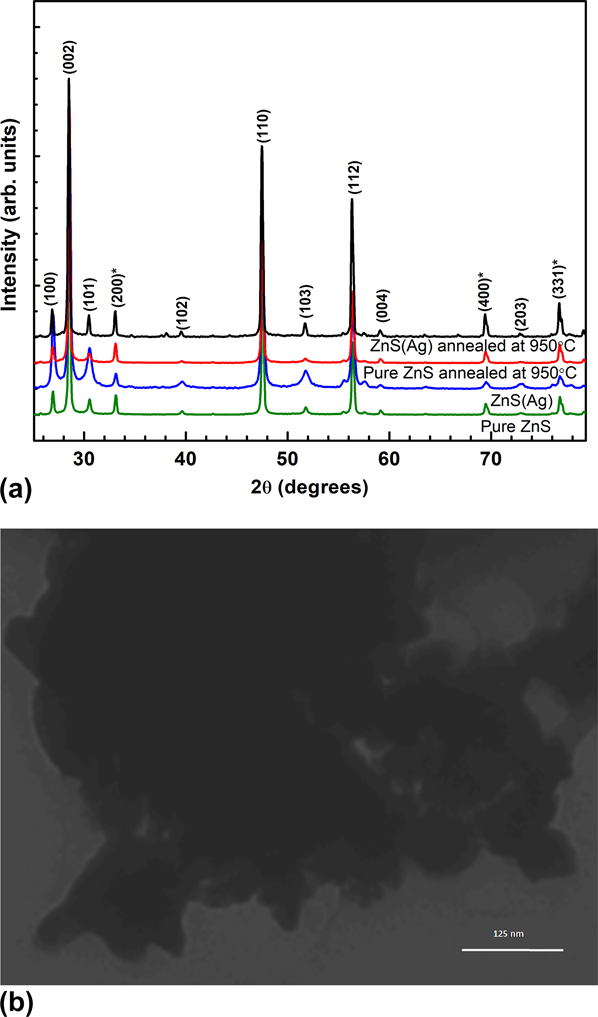
XRD measurements were performed on both pure ZnS and ZnS(Ag) powder before and after annealing. Figure 1 shows the respective powder XRD profiles of pure ZnS and ZnS(Ag) before and after annealing at 950 °C. The peak positions reveal the presence of both wurtzite and sphalerite crystal structures in ZnS powder with wurtzite as the dominating phase. All the observed peaks are identified for the ZnS wurtzite structure [JCPDS # 361450: a = 3.82 Å, c = 6.257 Å] and the peaks corresponding to the cubic sphalerite structure [JCPDS # 020565: a = 5.400 Å] are marked with asterisks in Fig. 1. The peak positions remain unaltered for both pure ZnS and ZnS(Ag) which ensure that no lattice distortion was introduced due to Ag doping. The FWHM of the XRD peaks was observed to decrease with annealing of the powder due to an increase in grain-size. Hence the crystalline nature of the synthesized powder was observed to be enhanced with annealing. The size was estimated using Scherrer’s formula
 $$d = {{K\lambda } \over {\beta \cos \left( {{{2\Theta } / 2}} \right)}}\quad ,$$
where d is the particle size, K is the constant close to unity, λ is the X-ray wavelength, β is FWHM of the XRD peak, and 2Ө is the peak position. The size of as-synthesized pure ZnS and ZnS(Ag) were observed to be around 52 nm and 31 nm, respectively. The particle sizes were observed to increase after annealing (at 950 °C) to around 58 and 67 nm for pure ZnS and ZnS(Ag) nanoparticles, respectively. The particle size was further confirmed using the TEM micrographs of the as prepared ZnS(Ag) powder given in Fig. 1(b). The particles are found to be spherical in shape and highly agglomerated with average size in the range of 50 nm similar to that calculated using XRD data.
(a) XRD profile of the pure ZnS and ZnS(Ag) nanoparticles with and without annealing at 950 °C in a vacuum. (b) TEM micrograph of the as synthesized ZnS(Ag) powder.

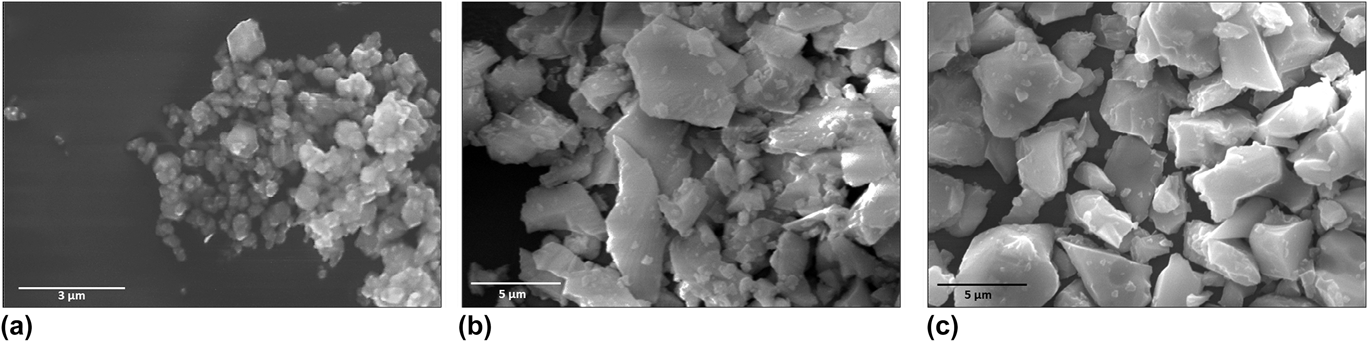
Figure 2 shows the FESEM images of as synthesized pure ZnS [Fig. 2(a)], pure ZnS annealed at 950 °C [Fig. 2(b)], and ZnS(Ag) nanoparticles after annealing at 950 °C [Fig. 2(c)]. Agglomerates of pure ZnS and ZnS(Ag) nanoparticles were observed whose size increased with annealing at 950 °C. The typical particle size of the agglomerated as-synthesized pure ZnS was observed to be around 300–500 nm and that of the agglomerates of annealed ZnS was seen to be around 2–3 µm. The particle size of both pure ZnS and ZnS(Ag) after annealing was observed to be approximately the same. This indicates that Ag doping does not alter the morphology of the ZnS powder. We see that the agglomerated particles have a plate-like structure with multiple plates stacking together. The growth of the plate-like structure occurs due to the presence of ED in the initial solution.Reference Acharya, Maheshwari, Tatikondewar, Kshirsagar and Kulkarni20
SEM results of the ZnS nanoparticles: (a) pure ZnS nanoparticles, (b) pure ZnS nanoparticles after annealing at 950 °C, and (c) Ag doped ZnS nanoparticles after annealing at 950 °C.

B. XPS characterization
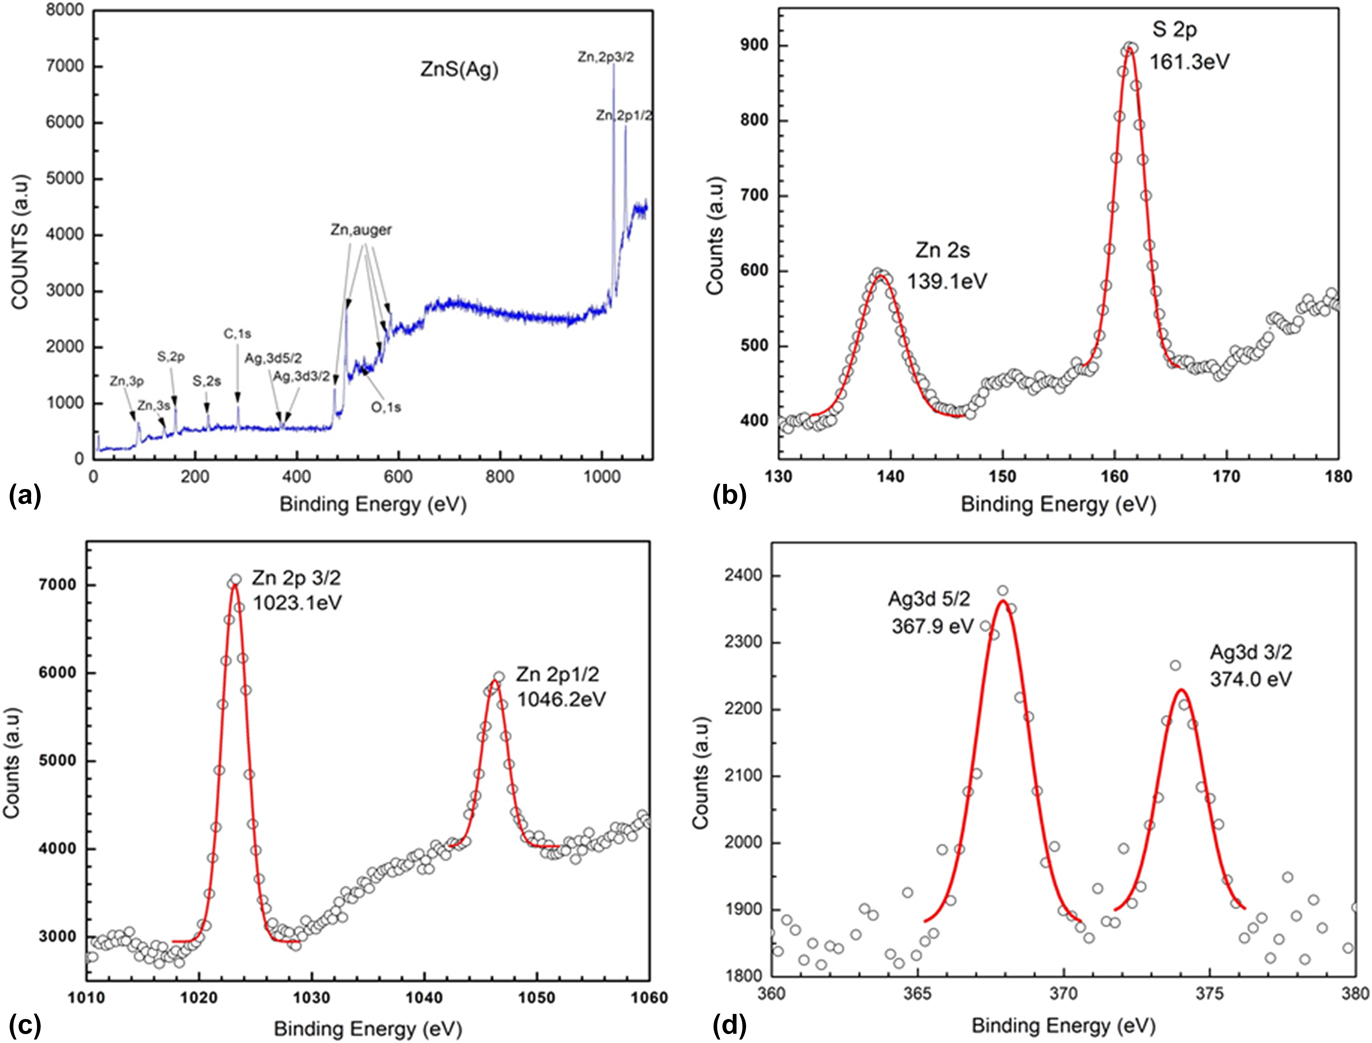
To check the chemical purity of the synthesized ZnS powder and the presence of Ag in ZnS, XPS measurements were performed on the ZnS(Ag) samples annealed at 950 °C and the results are shown in Fig. 3. The XPS survey scan in Fig. 3(a) shows the presence of Zn, S, O, C, and a trace amount of Ag. The C 1s peak at 284.6 eV was used as the reference peak. This is the adventitious carbon peak which arises because of the presence of carbon in the ambient. The XPS spectra confirms the absence of impurities such as Cu, Mn, Mg, etc., in the ZnS(Ag) system.
(a) XPS survey spectrum of the Ag doped ZnS nanoparticles. (b), (c), and (d) represent the detailed XPS spectra of sulfur 2p, zinc 3s, zinc 2p, and silver 3d, respectively.

S 2p peak [Fig. 3(b)] observed at 161.3 eV confirms the presence of sulfur in sulfide (S−) form.Reference Fantauzzi, Elsener, Atzei, Rigoldiab and Rossiab21 The absence of any elemental or oxidized form of sulfur was confirmed by the nonoccurrence of any additional peak from 163 to 170 eV.Reference Hao, Sun, Yang, Zhang, Liu and Shen14 In the same figure, a strong peak at 139.16 eVcan be observed, which corresponds to the Zn2+ 3s binding energy. This indicates the presence of interstitial Zn2+defect sites in the sample which may be caused due to the presence of sulfur vacancies. The characteristic Zn 2p 3/2 and 2p 1/2 peaks at 1023 eV and 1046 eV, respectively, shown in Fig. 3(c) indicate the presence of Zn in 2+states. The spin–orbit splitting of Zn 2p 3/2 and 2p 1/2 is 23 eV which corresponds to ZnS.Reference Acharya, Maheshwari, Tatikondewar, Kshirsagar and Kulkarni20 Relatively weak peaks at 368 and 374 eV were also observed as shown in the Fig. 3(d) which correspond to the Ag 3d 5/2 and Ag 3d 3/2 binding energy, respectively, which is characteristic of Ag+ in the Ag2S product.Reference Hota, Idage and Khilar22,Reference Pan, Liu and Wang23 In XRD, no peak corresponding to Ag2S was observed as the amount is less than the detection limit of XRD.
C. UV-Vis spectroscopy
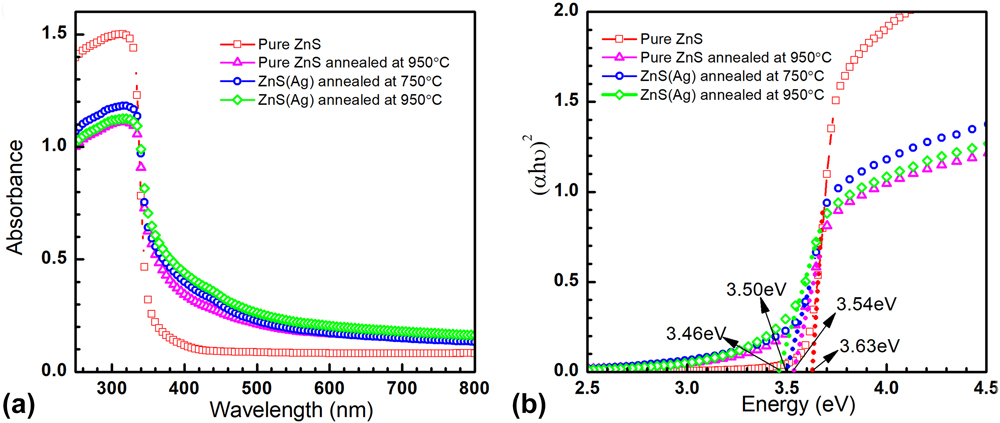
Figure 4(a) shows the UV-vis absorbance spectra of the pure ZnS and ZnS(Ag). The absorption of ZnS powder is found to increase on Ag doping as well as on annealing for wavelengths higher than 350 nm. This can be due to the introduction of defect states in the ZnS lattice due to annealing under vacuum conditions. The absorption edge of all the samples was observed at 340 nm (3.64 eV) which is less than the band gap value of bulk ZnS (3.72 eV). The absorption edges of the annealed samples show gradual fall as compared to the as-synthesized pure ZnS nanostructures which may be due to the formation of new defect states arising from annealing.
(a) UV-vis absorbance spectra of the as synthesized ZnS and ZnS(Ag) nanoparticles annealed at 950 °C. (b) The Tauc plot of the given samples showing band-gap energies.

The absorption coefficient α is related to the optical band-gap E g through the following relation:
 $$\alpha h\nu {\rm{\ }} = {\rm{\ }}A\left( {h\nu - {E_{\rm{g}}}} \right)^n\quad ,$$
where hν is the photon energy, A is proportionality constant, and n is a constant which may take values 1/2, 2, 3/2, and 3 depending upon the transition being allowed direct, allowed indirect, forbidden direct, and forbidden indirect, respectively. ZnS is a direct band-gap semiconductor, and the value of n for this system is 1/2.
Figure 4(b) shows the dependence of the optical absorption coefficient for different samples with photon energy. By extrapolating the linear portion of the Tauc plot to α = 0, the band gap of pure ZnS and ZnS(Ag) nanostructures was observed as follows: 3.63 eV for pure and as synthesized ZnS, 3.54 eV for 950 °C annealed pure ZnS, 3.50 eV for ZnS(Ag) vacuum annealed at 750 °C, and 3.46 eV for ZnS(Ag) vacuum annealed at 950 °C. The vacuum annealing is found to decrease the estimated band gaps in these ZnS nanostructures. This is the manifestation of the presence of defect states created due to annealing and indirect transitions occurring in these particles. We would like to state that the increase in particle size on annealing will not have any effect on the band gap of the material because the particle size in our experiment is larger than what is required to show quantum confinement effects. The change in band gap due to the change in particle size is generally observed in particles with size in the range of 2–20 nm. Our particle size is in the range of 30 nm and above as confirmed by TEM and XRD results. Further investigations were carried out by studying the PL spectra of these materials.
D. PL spectroscopy
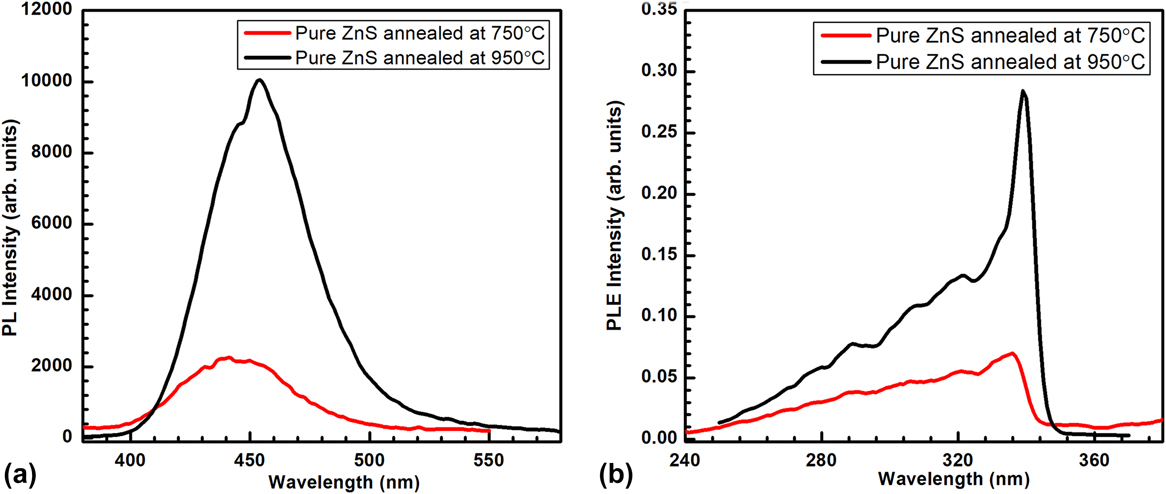
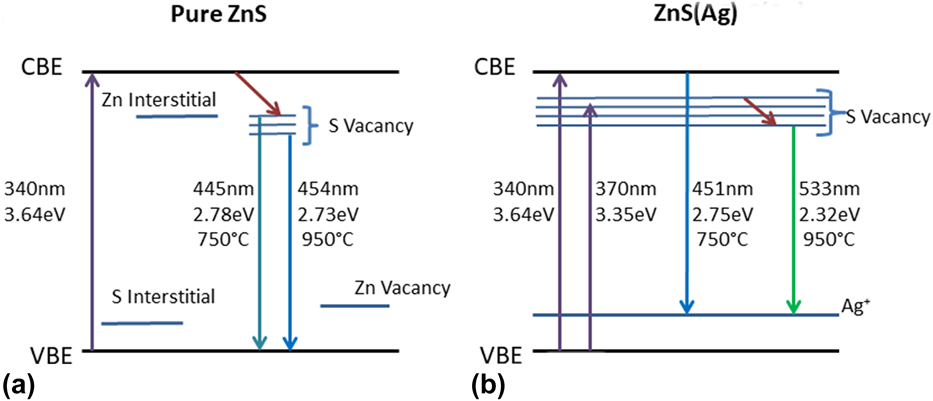
The PL spectra of pure ZnS nanoparticles vacuum annealed at 750 and 950 °C in a vacuum are shown in Fig. 5(a). The PL emission peaks were observed at 445 nm and 455 nm for the pure ZnS nanoparticles annealed at 750 °C and 950 °C, respectively. These emission peaks can be attributed to the transition from the sulfur vacancy state to the valance band edge. The sulfur vacancy states increase with the rise in annealing temperature from 750 to 950 °C leading to an increase in the intensity of the PL emission peak as can be seen in Fig. 5(a). Earlier, the emission in the blue region has been attributed to the transitions involving vacancy states in ZnS nanocrystals.Reference Murase, Jagannathan, Kanematsu, Watanbe, Kurita, Hirata, Yazawa and Kushida10 As mentioned earlier, the possible defects in the ZnS lattice are Zn, S vacancies and Zn, S interstitial. The donor defects are sulfur vacancies and interstitial zinc atoms, while the acceptor defects are zinc vacancies and interstitial sulfur.Reference Becker and Bard24 The energy states due to interstitial sulfur are located closer to the valence band edge (VBE) than the interstitial Zn to the conduction band edge (CBE). Similarly, the sulfur vacancy states are located closer to the conduction band than zinc vacancies to the valance band edge.Reference Denzler, Olschewski and Sattler25 Emission at around 450 nm has also been observed previously in ZnS nanobeltsReference Peng, Cong, Qu and Wang26 and nanowires and was attributed to either defect states or surface states.Reference Xiong, Chen, Acord, Liu, Zengel, Gutierrez, Redwing, Lew Yan Voon, Lassen and Eklund27 Figure 5(b) shows the PL excitation (PLE) spectra for pure ZnS annealed at 750 °C and 950 °C. The PLE peaks observed at 337 nm and 339 nm for pure ZnS nanoparticles annealed at 750 °C and 950 °C, respectively, correspond to the band gap energy of ZnSReference Kakarndee, Juabrum and Nanan28 which was also observed in the UV-vis data analysis as shown in Sec. III.C. The energy band diagram representing the various possible transitions in pure ZnS are shown in Fig. 7(a).
The PL emission (a) and excitation (b) spectra of the pure ZnS nanoparticles annealed at 750 and 950 °C.

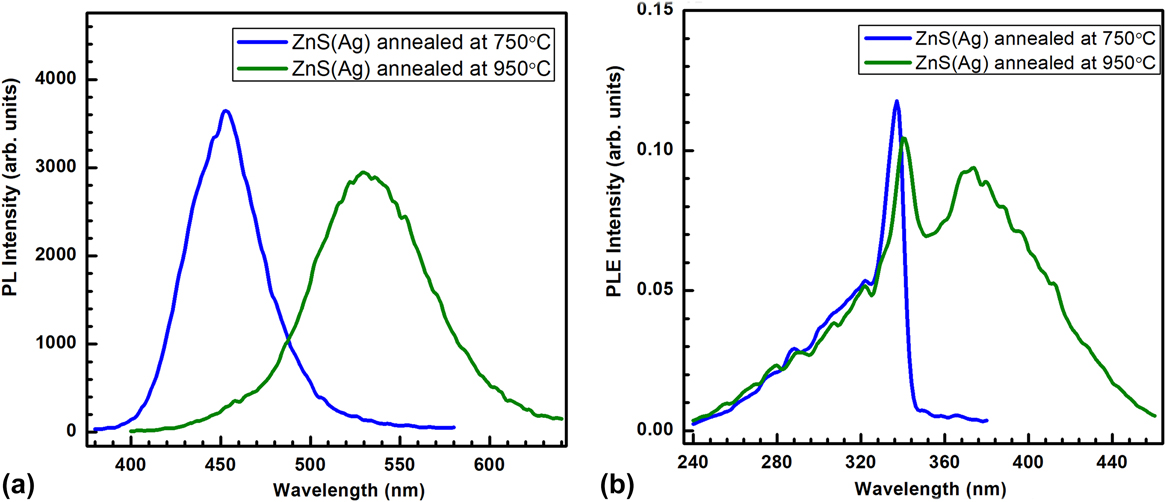
For ZnS(Ag) powder annealed at 750 °C and 950 °C, the PL and PLE spectra are shown in Figs. 6(a) and 6(b), respectively. It can be clearly seen that the ZnS(Ag) powder annealed at 750 °C shows PL emission at 451 nm which is characteristic of ZnS(Ag) powder. During the hydrothermal synthesis of ZnS(Ag), Ag+ ions get incorporated into the ZnS lattice as a dopant and form Ag+ trap centers near the VBE. Thus, the emission at 451 nm arises from the radiative recombination of charge carriers from the CBE to Ag+ states present near the VBE. For the ZnS(Ag) nanoparticles annealed at 950 °C, the PL emission peak was observed at 533 nm. Earlier, the green emission has been attributed to the presence of elemental S species on the surface of ZnS nanostructures.Reference Ye, Fang, Li and Zhang19 However, the presence of elemental sulfur in the present ZnS(Ag) nanostructures has been ruled out by the XPS studies as discussed in Sec. III.B.
PL emission (a) and excitation (b) spectra of ZnS(Ag) nanoparticles annealed at 750 and 950 °C.

The PLE spectra for ZnS(Ag) nanoparticles annealed at 750 and 950 °C show clear peaks around 340 nm corresponding to the ZnS energy band gap. Apart from that, another peak at 370 nm was observed for ZnS(Ag) nanoparticles annealed at 950 °C. This lower energy excitation suggests the presence of defect sites in the ZnS lattice which act as a metastable state and allow the absorption of photons corresponding to this energy. The excitation peak at 370 nm in Fig. 6(b) corresponds to the excitation of electrons from the VBE to the zinc interstitials present and the 340 nm excitation is related to the CBE. In the case of pure ZnS samples, no excitation band around 370 nm was observed which indicates that the zinc interstitials in pure ZnS are very less and increase on Ag doping. These defect sites allow further relaxation of carriers to lower sulfide sites and final recombination at the Ag+ centers giving rise to green PL emission at 533 nm. The energy band diagram depicting the various transitions is shown in Fig. 7(b).
Energy-band diagram showing the various optical transitions for (a) pure ZnS nanoparticles after annealing at 750 and 950 °C. (b) ZnS(Ag) nanoparticles after annealing at 750 and 950 °C.

A possible reason for higher sulfur vacancy in Ag doped ZnS can be that on annealing of ZnS(Ag) nanoparticles at 950 °C, which is a temperature higher than the melting point of Ag2S (875 °C), more of Ag2S dissociate and Ag+ ions are incorporated in the ZnS lattice creating higher sulfur vacancies and zinc interstitials. These zinc interstitials act as trap centers for the electrons which are excited from the VBE. The trapped electrons may move onto the lower S vacancy states and finally recombine radiatively with the holes present at Ag+ centers giving rise to green luminescence at 533 nm. The probability of nonradiative recombination within the S vacancy defect sites lead to lower intensity of the 533 nm peak as compared to the 451 nm PL emission peak.
IV. CONCLUSION
Pure ZnS and ZnS(Ag) nanoparticles were synthesized by a template mediated simple hydrothermal route, and their vacuum annealing was performed at 750 and 950 °C.
It was observed that the annealing of pure ZnS nanoparticles at 750 and 950 °C gives rise to radiative transitions related mainly to the S vacancies present in the ZnS lattice. The luminescence emission from these pure ZnS nanoparticles has been observed in the blue region of the visible light. It has been shown that the emission wavelength from the ZnS(Ag) nanoparticles can be easily tuned from the blue to green region of visible light by changing the vacuum annealing temperature from 750 to 950 °C. This was found to be attributed to the formation of excess sulfur vacancies in ZnS on annealing at 950 °C under vacuum conditions. These additional sulfur vacancies arise due to the incorporation of further Ag+ ions in the ZnS lattice. This study provides a very simplified technique to synthesize ZnS(Ag) nanoparticles having optical emission in the green region. Such nanoparticles find huge application in imaging screens and can be easily integrated with the silicon photodiodes which show maximum sensitivity around 550 nm.
ACKNOWLEDGMENTS
The authors would like to thank GAMD, BARC for SEM measurements. M. Sharma would like to thank DST for INSPIRE Faculty grant.