Introduction and background
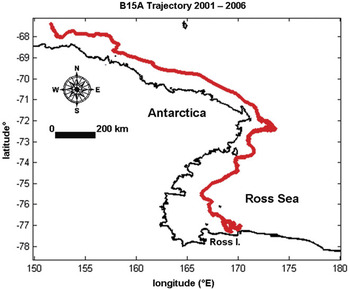
A large tabular iceberg, calved from the Ross Ice Shelf, would normally be expected to drift quickly from the Ross Sea (e.g. in less than one year) following the prevailing winds and ocean currents (Fig. 1). However, B15A, a large tabular iceberg calved in March 2000, remained stuck in a position immediately north of Ross Island from the time of its arrival in early 2001, until December 2004, a 47-month period. In contrast to B15A, B9, another large tabular iceberg, calved off the eastern Ross Ice Shelf in October 1987 and drifted 2000 km around the Ross Sea over 22 months under the influence of ocean currents before exiting the region (Keys et al. Reference Keys, Jacobs and Barnett1990), about half the time B15A remained relatively fixed in one location.
GPS-observed B15A trajectory from 2001 to 2006. B15A was trapped from January 2001 to December 2004, a 47-month period, in the vicinity of Ross Island, where the red trajectory is complex, folding back on itself.

B15A’s maintenance of a fixed position near Ross Island had tangible consequences to both logistics managers for the United States Antarctic Program (USAP) and the local ecosystem. Sea ice flushing was inhibited, imposing additional ice-breaking expenses on the USAP (Brunt et al. Reference Brunt, Sergienko and Macayeal2006). The continuous sea ice coverage prevented penguin populations from gaining access to coastal waters to forage for fish (MacAyeal et al. Reference Macayeal, Okal, Thom, Brunt, Kim and Bliss2008b). While B15A was stuck in this region, it collided repeatedly with the ice shelf front, playing a role in the calving of iceberg C16 in 2001, and C19 on May 11 2002. B15A eventually broke into several smaller icebergs - B15J and B15K (Brunt et al. Reference Brunt, Sergienko and Macayeal2006). All of these icebergs remained trapped near Ross Island for two to four times as long as the normal flushing time for small icebergs and sea ice (Brunt et al. Reference Brunt, Sergienko and Macayeal2006, MacAyeal et al. Reference Macayeal, Okal, Thom, Brunt, Kim and Bliss2008b).
Here, the physical mechanisms behind the trapping of these large tabular icebergs in the vicinity of Ross Island are explored using surface meteorological and Global Positioning System (GPS) data from Automatic Weather Station (AWS) instruments deployed on the icebergs in January 2001 (MacAyeal et al. Reference Macayeal, Okal, Thom, Brunt, Kim and Bliss2008b). Pressure gradients and the associated forces acting on the icebergs are calculated using the surface atmospheric pressure records from the AWS, and iceberg drift direction and location from the GPS. The leading mechanism found to be causing the unexpected entrapment of the icebergs (the influence of a persistent pressure gradient force directed toward Ross Island) is unusual, and does not commonly appear in studies of iceberg drift (e.g. Lichey & Hellmer Reference Lichey and Hellmer2001). The atmospheric pressure gradient also induces a sea-surface slope upward toward Ross Island from the Ross Sea due to the Inverse Barometer Effect (IBE) (Wunsch & Stammer Reference Wunsch and Stammer1997).
The ideal IBE (Wunsch & Stammer Reference Wunsch and Stammer1997) relates variations in ocean surface height Δη and variations in atmospheric pressure ΔP by

in which ρw is the density of seawater (1027.5 kg m-3) and the gravitational acceleration is g (9.81 m s-2). The deviation ΔP is relative to the mean atmospheric pressure 1000 hPa. A positive deviation ΔP depresses the sea surface locally, while a negative deviation allows the sea surface to rise locally. The mean sea level and mean atmospheric pressure must be in equilibrium with one another, thus a perturbation of one must be accompanied by a perturbation of the other. Generally, the sea surface height will rise (fall) about 1 cm in response to 1mbar drop (rise) in atmospheric pressure, discounting variations in seawater density (Padman et al. Reference Padman, King, Goring, Corr and Coleman2003, Aoki Reference Aoki2003).
An iceberg is driven by the combined effects of surface and body forces. The body force relevant to the IBE is the component of gravity down the inclined plane produced by the IBE on the sea surface. The surface forces acting on an iceberg can be quantified as those that act, via drag mechanisms, tangentially across the surface, and those that act perpendicularly to the surface due to pressure effects. The conventional view, that icebergs slide down the sea surface slope induced by the IBE despite the action of gravity is not always correct. Icebergs may drift upslope when pressure forces overcome gravitational forces. A persistent low pressure anomaly exists just to the north of Ross Island in and around Lewis Bay, (Monaghan et al. Reference Monaghan, Bromwich, Powers and Manning2005) which therefore provides a strong physical mechanism for “trapping” icebergs in the immediate vicinity for long periods of time.
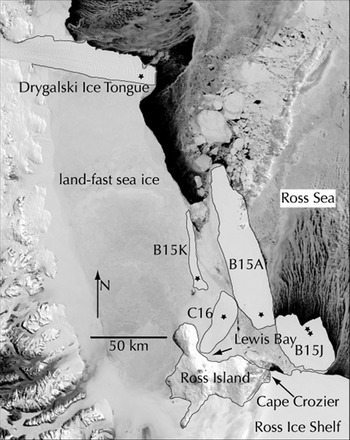
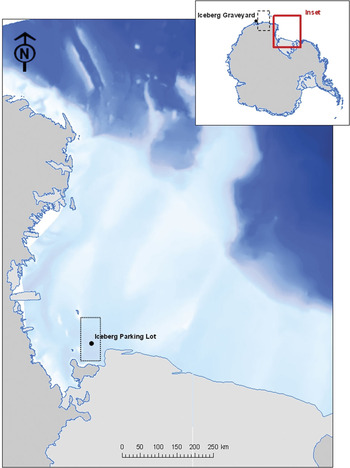
Pressure gradients between pairs of icebergs C16 and B15A, and C16 and B15K, may be computed using pressure recorded by AWS mounted on the icebergs, and GPS records of iceberg locations at 20-minute intervals (Fig. 2). While two fixed-position AWS would have been preferable for this study, the most important aspect of the AWS’ relative positions is that both B15A and B15K were consistently located farther away from the Lewis Bay low pressure anomaly than C16. The AWS pressure records used here span a period when C16 was grounded with its AWS located about 15 km north-west of Lewis Bay. This allows the C16 record to serve as a reference for B15A and B15K. The data are used to examine the pressure gradient conditions under which large tabular icebergs remain stuck in the “iceberg parking lot” (“graveyard” is also used; “iceberg parking lot” was first used by Taladier et al. Reference Taladier, Hyvernaud, Reymond and Okal2006 - see Fig. 3).
The locations of all AWS in the region of this study, black stars. Icebergs C16, B15A, and B15K are labelled. This MODIS (moderate-resolution imaging spectroradiometer) image from 9 November 2004 is reproduced from (MacAyeal et al. Reference Macayeal, Okal, Thom, Brunt, Kim and Bliss2008b).

The location of the iceberg “parking lot,” (Taladier et al. Reference Taladier, Hyvernaud, Reymond and Okal2006, MacAyeal et al. Reference Macayeal, Okal, Thom, Brunt, Kim and Bliss2008b) as denoted by the black-dotted rectangle, in and near Lewis Bay north of Ross Island. Lewis Bay occupies the indentation on the north side of the island. Also note the location of the so-called Iceberg Graveyard in the upper-right corner inset, where many icebergs eventually become grounded and disintegrate after leaving the parking lot. The region defined by the black-dashed rectangle in the inset contains other “iceberg parking lots” for example, near the Mertz Glacier Tongue.

The IBE and iceberg drift
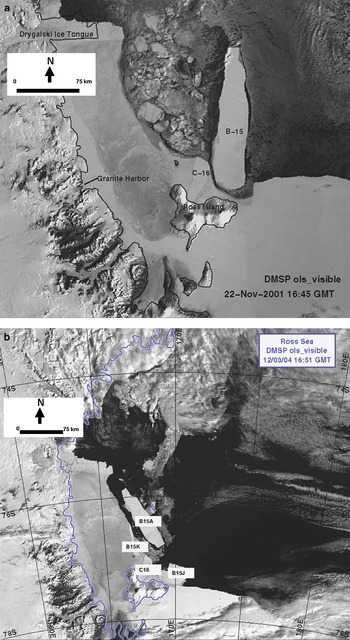
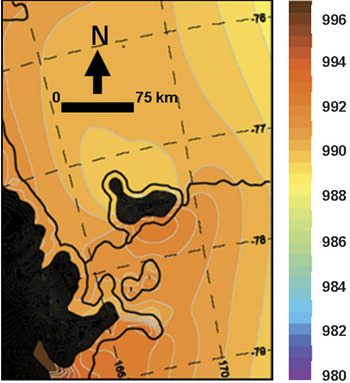
The topography of Ross Island is such that the directionally constant southerly katabatic winds blowing off the Antarctic ice sheet are blocked by the south side of the island and mainly diverted around it, leading to relatively higher atmospheric pressure on the south side, and time-mean cyclonic vorticity on the north side, in the region of Lewis Bay (Van den Broeke & Lipzig Reference Van Den Broeke and Lipzig2003, Bromwich et al. Reference Bromwich, Monaghan, Powers, Cassano, Wei, Kuo and Pellegrini2003, Monaghan et al. Reference Monaghan, Bromwich, Powers and Manning2005). The “iceberg parking lot” in Lewis Bay retained many large icebergs for periods of time ranging from months to years over the period from 2001–04 (MacAyeal et al. Reference Macayeal, Okal, Thom, Brunt, Kim and Bliss2008b) (Fig. 4). The satellite images in Fig. 4 show that the positions of icebergs accumulated north of Ross Island changed little from November 2001 to December 2004. B15A finally departed the region in December 2004, while B15J remained until July 2006. The region consistently exhibited a persistent low surface pressure anomaly over the period of interest (Fig. 5, reproduced from Monaghan et al. Reference Monaghan, Bromwich, Powers and Manning2005).
a. The DMSP (Defense Meteorological Satellite Program) sensor image shows the icebergs B15A (B15) and C16 sitting north of Ross Island on 22 November 2001. b. B15A finally departs the region on 3 December 2004. B15J, which broke from B15A in October 2003, remained in the iceberg parking lot until July 2006. B15K, which broke from B15A in December 2003, remained in the iceberg parking lot until June 2005.

Mean annual surface pressure in the vicinity of Ross Island in mbar, generated by the MM5 Polar Forecast Model, reproduced from (Monaghan et al. Reference Monaghan, Bromwich, Powers and Manning2005). The mean pressure is about 2 mbar lower on the north side of Ross Island than on the south side of the island.

Automatic Weather Stations (AWS)
The US Antarctic Program operates a network of AWS scattered around the continent, with many more stations along the coast than inland, and a number of stations around the Ross Ice Shelf (Stearns & Wendler Reference Stearns and Wendler1988). Taking measurements at intervals ranging from ten minutes to three hours, AWS units record air temperature, atmospheric pressure, wind direction and speed at 3 m above the surface, sometimes the air temperature difference between 0.5 and 3 m above the surface, sometimes relative humidity (Stearns & Wendler Reference Stearns and Wendler1988), and sometimes snow temperature (Stearns & Weidner Reference Stearns and Weidner1993).
Force magnitude analysis for B15A
The net force which acts on a large tabular iceberg is the sum of the pressure gradient, gravitational, ocean current and drag, wind, and Coriolis forces, respectively,

The goal here is to estimate the relative magnitudes of these terms for the large tabular iceberg B15A.
Pressure gradient force
The pressure gradient acting on an iceberg in the parking lot is of the order
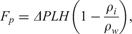
in which the change in pressure over the long axis of the freeboard is ΔP, the length of the iceberg’s long axis is L, and the ice density is ρ i. The term H (1 - ρi/ρw) represents the iceberg freeboard, that part of the total thickness H exposed to the atmosphere. Simply put, the force resulting from a pressure difference across the iceberg face, Fp, is the product of the pressure difference across an iceberg face and the area of the exposed face. In the present order-of-magnitude analysis, the exposed face is idealized as a rectangle with an area LH (1 - ρi/ρw), where the product H (1 - ρi/ρw) is the freeboard height. The pressure gradient force acting over the iceberg freeboard is of significant magnitude. The dimensions of iceberg B15A are approximately 126 km along its longer horizontal axis, and about 27 km along its shorter horizontal axis, giving it an estimated horizontal surface area of 2831 km2. The vertical thickness of B15A is 250 m, hence its freeboard thickness is approximately 27 m. If the iceberg’s long axis is primarily oriented north–south, as observed, 10 mbar is a reasonable characteristic value for the pressure difference ΔP. From this, using an ice density value of 917 kg/m3, the pressure gradient force Fp is approximately 7.3×10⁸ N. If the dominant pressure gradient force were to act mainly over the short axis and therefore push westward toward Lewis Bay, a pressure difference of about 1mbar would be typical. In this case, the pressure gradient force will be approximately 108 N.
Gravitational force
This pressure gradient force can be comparable in magnitude to the opposing gravitational force the iceberg experiences down the IBE-induced sea-surface slope. However, the pressure gradient force can at times be considerably stronger, by one to two orders of magnitude. The gravitational force may be computed by

in which ∂η/∂y is the meridional sea-surface height gradient along the iceberg’s long axis. The sea-surface gradient may be estimated using the IBE relation Eq. (1) and the pressure gradient along the iceberg, 1000 Pa over 126 km, 7.9×10⁻³ Pa m-1. Then by the IBE relation Eq. (1), the pressure gradient can be converted to a sea-surface height gradient on the order of 10-7. The estimated mass of the iceberg B15A, m, is 6.49×10¹⁴ kg. Together, these yield a gravitational force of about 6.4×10⁸ N. This induces a net IBE-force in the direction of the pressure gradient because the magnitude of the pressure gradient force exceeds that of the gravitational force.
Ocean current and drag force
The gravitational force, Fg, Eq. (4) is usually weaker than the ocean current force acting against the iceberg’s submerged portion. The ocean current force and drag against the bottom iceberg horizontal face, Ff, is calculated from

(Lichey & Hellmer Reference Lichey and Hellmer2001) in which Cw is a non-dimensional resistance coefficient for water against the vertical face of the iceberg equal to 0.85 (Lichey & Hellmer Reference Lichey and Hellmer2001), Cdw is a non-dimensional skin-drag coefficient for water against the bottom face of the iceberg equal to 5×10⁻⁴ (Lichey & Hellmer Reference Lichey and Hellmer2001),  and
 are the typical zonal and meridional ocean current velocities, respectively, underneath the iceberg horizontal area A, and the iceberg centre of mass zonal and meridional drift speed components, Ucom and Vcom, respectively, are assumed to be much smaller than the current speed components and taken as zero. The magnitude of the ocean surface current speed measured at moorings north of Ross Island is 10-2 m s-1, and is an order of magnitude smaller along Ross Island area coastlines (Johnson & Woert Reference Johnson and Woert2006). The result is a magnitude of Ff of 108 to 109 N.
Wind forcing
The wind forcing Fw is generated along the freeboard and across the surface of the iceberg. The magnitude of Fw is calculated by
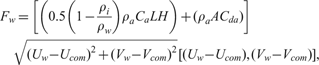
(Lichey & Hellmer Reference Lichey and Hellmer2001) in which the density of air, ρa, is 1.293 kg m-3, Ca is a non-dimensional resistance coefficient for air against the vertical face of the iceberg equal to 0.4 (Lichey & Hellmer Reference Lichey and Hellmer2001), Cda is a non-dimensional skin-drag coefficient for air against the top face of the iceberg equal to 2.5×10⁻⁴ (Lichey & Hellmer Reference Lichey and Hellmer2001), and Ucom and Vcom are again taken to be zero. The quantity [(0.5 (1 − ρi/ρw) ρaCaLH + (ρaACda)] accounts only for the iceberg freeboard over which the wind can act, and is of the order 106 kg m-1.
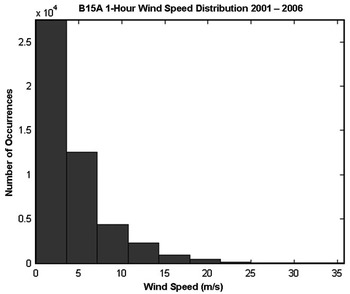
Wind speeds recorded by the B15A AWS range from less than 1 m/s to about 23 m s-1 (Fig. 6). The mean 1-hour average wind speed at the site is 4.4 m s-1. The anemometer height is about 10 m above the snow surface and 20-minute mean values are recorded by the AWS. For wind speeds at the low end of the observed range, the wind force magnitude is of the order 105 N. For more typical wind speeds, Fw is of the order 106 N. There is little seasonality in the wind speeds observed on the icebergs due to their location in the Ross Sea, where katabatic winds are not important. Wind speed varies irregularly with the passage of storms.
Numbers of wind speed measurements from the B15A AWS averaged over every hour. Most of the wind speeds to which the iceberg was subjected were less than 5 m s-1, grouped into 10 evenly-spaced intervals between zero and 35.7 m s-1.

Coriolis force
The Coriolis force, which depends on the iceberg velocity, is

in which the constant Coriolis parameter f has a value of -1.4 × 10⁻⁴s-1 around the Ross Sea coast (an f-plane approximation is made). Using an iceberg drift speed of 0.1 m s-1, as deduced from the GPS record, the Coriolis force magnitude is of the order 1010 N.
Summary of the forces on B15A
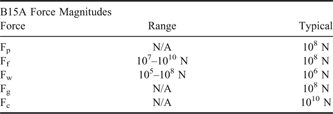
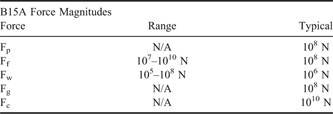
To summarize the relative magnitudes of all five forces acting on B15A (see Table I), the surface forces, which include the pressure gradient, Fp, Eq. (3) ocean current and drag force, Ff, Eq. (5) and wind forcing, Fw, Eq. (6) have typical magnitudes of 108 N, 107 to 1010 N, and 105 to 108 N, respectively. The body forces, which include the gravitational, Fg, Eq. (4) and Coriolis, Fc, Eq. (7) forces, have typical magnitudes of 108 N and 1010 N, respectively. In the context of the hypothesis being tested here, it is important to note that the magnitude of the pressure gradient force is similar to other forces acting on the large tabular iceberg.
Ranges and typical magnitudes of the five forces experienced by the iceberg B15A.
The effect of the pressure gradient force on B15A’s location depends on both its magnitude and direction. During the iceberg’s final months in the parking lot, October through December 2004, the pressure gradient on B15A always pointed south toward Ross Island. A weakening of the pressure gradient was required to allow B15A to escape to the north. The pressure gradient was never pushing B15A away from the parking lot, but when it weakened, other forces such as the ocean current and drag forces, became more important. Without the southward pull of the pressure gradient force, B15A would drift north, away from the parking lot.
It should be noted that neither wave drift nor sea ice forcings are included in the present analysis. As a practical matter, there are insufficient data to include these terms, however the effect of this omission is limited. Wave effects on the icebergs are mitigated by the fact that in sea ice-covered waters, there is reduced sea swell (Cathles et al. Reference Cathles, Okal and Macayeal2009), and sea ice drift in the area of the icebergs north of Ross Island is generally directed to the north. Thus, it would be reasonable to expect that sea ice forces would not act on the icebergs in the same manner as atmospheric pressure forces, as they would tend to push the icebergs to the north.
Methodology
The first step in this analysis of iceberg motion is to re-project an iceberg’s GPS-recorded latitude and longitude track into the Southern Hemispheric polar stereographic map projection. This simplifies the analysis by redefining the spatial domain in terms of Cartesian coordinates so that distances and directions can be readily calculated. The set of equations associated with the Lambert azimuthal equal-area projection is used for the conversion, and the radius of the earth is defined as 6371 km.
Here, iceberg drift in response to horizontal pressure gradient forcing is examined, to clarify under what circumstances an iceberg remains trapped in the parking lot, versus under what circumstances an iceberg permanently escapes from the vicinity of Ross Island. Smoothed pressure gradient records calculated from two pairs of iceberg pressure records - C16 and B15A, and C16 and B15K are presented. The pressure records for each iceberg are converted into a series of locally weighted least squares linear fits for every 10 000 data points, which span 139 days. This smoothing mechanism rids the raw data of strong but short-lived pressure anomalies that are generated by passing storms.
Data on B15A were initially recorded by an AWS that was eventually lost to the newly-formed B15J iceberg at the end of October 2003. Thereafter, B15A’s data until 2007 were recorded by a different AWS. Only the time period in which the pressure and GPS records from C16 and B15A overlap is considered, which is 21 December 2001 to January 2006. For B15K, only the time period in which its pressure and GPS records overlap with those of C16, and in which B15K was not grounded, and thus responding in its trajectory to pressure forcing, is considered. This period runs from 5 April to September 2005.
Due to C16’s grounding just to the north-west of Lewis Bay upon its arrival in 2001 until its departure from the parking lot in January of 2006, this iceberg’s AWS serves as an ideal source of a surface pressure record from a fixed point well inside the iceberg parking lot. The directional pressure gradients between a pair of icebergs are estimated by

in which PB and PC are the smoothed pressure data points from B15A or B15K, and C16, respectively, and x and y are the simultaneously (or near-simultaneously) recorded zonal and meridional Cartesian coordinates of the AWS, respectively. Since pressure gradients on B15A and B15K almost always point south toward Ross Island while these icebergs are in the parking lot, only the magnitudes of the pressure gradients are important.
While these equations may best reflect pressure gradients at a point between a pair of icebergs rather than on B15A and B15K, this is the best approximation that can be made based on available iceberg AWS data. It should also be noted that the timings of the pressure measurements for the two iceberg pairs do not coincide precisely. However, measurements were taken sufficiently close together in time to determine approximate pressure gradients between B15A and C16, and B15K and C16, for any given time. The corresponding pairs of AWS measurements on the two sets of icebergs were never taken more than 20 minutes apart for any pressure gradient calculation, usually three or four minutes apart, and occasionally under a minute apart. The smoothing procedure performed on the pressure data additionally helps to eliminate analysis problems arising from small differences (on the order of seconds) in the timing of the corresponding measurements on B15A or B15K, and C16.
Results
Pressure gradient on B15A
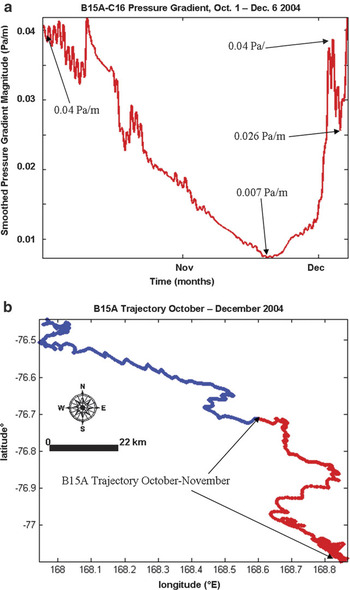
The magnitude of the smoothed pressure gradient determined from the B15A and C16 AWS records from the beginning of October through the early part of December 2004 is examined here. October and November 2004 were B15A’s final two months in the parking lot, and the iceberg began to finally depart the region to the north by the start of December (Fig. 7b). This relatively short period is therefore relevant to determining the role the pressure gradient played in holding B15A in the parking lot, and in subsequently facilitating its departure.
a. Shows the magnitude of the smoothed pressure gradient between B15A and C16, from the beginning of October 2004 through the first few days of December 2004. b. shows the B15A trajectory during October–December 2004, with the trajectory through November in red, and the December trajectory in blue. The iceberg’s journey to the north-west did not commence until very late November.

The pressure gradient magnitude on B15A drops rapidly from the start of October until approximately 19 November, when it reaches a minimum and starts to rise again (Fig. 7a) as B15A begins drifting out of the parking lot. During this time, the pressure gradient between the two icebergs falls from 40.3×10⁻³ Pa m-1 to 7.3×10⁻³ Pa m-1. This is a significant weakening of the pressure gradient over a two-month period. The pressure gradient rises to 38.8×10⁻³ Pa m-1 by 3 December as B15A begins to escape to the north (Fig. 7b). The pressure gradient then rapidly falls to 25.7×10⁻³ Pa m-1 near the end of 4 December. This smaller decrease facilitates B15A’s drift out of the region (Fig. 7b). During October and November, B15A moves 41.1 km to the north-west, but in December alone it moves 34.6 km to the north-west (Fig. 7b), which indicates a significantly more rapid drift speed after the iceberg exits the parking lot.
The history of the pressure gradient on B15A, from the end of 2001 until the end of 2003, is briefly summarized here. From December 2001 until the beginning of 2004, (not shown in any figure) the pressure gradient on B15A does not fluctuate by more than 26×10-3 Pa m-1, or 0.26 mbar km-1. From the beginning of 2004 until the start of October, (not displayed in any figure), the maximum calculated pressure gradient magnitude reaches significantly high values at times, approaching 31.8×10⁻³ Pa m-1, which acts to trap B15A in the parking lot. From December 2001 to the start of 2004, the pressure gradient continuously points toward Ross Island. However, from the start of 2004 through the end of September 2004, there are times during which the pressure gradient on B15A points away from Ross Island between about 15 May and 17 September. The fact that B15A remained in the parking lot through these periods indicates that they are neither long enough nor have a sufficiently strong pressure gradient magnitude to push the iceberg out of the area.
The pressure gradient decrease from the beginning of October to late November was particularly extended in the context of the entire overlapping B15A and C16 AWS records, with the pressure gradient remaining below 10 × 10-3 Pa m-1 for about 11 continuous days. Prior to October 2004, the pressure gradient experienced by B15A did not fall below 7.4×10⁻³ Pa m-1 for more than a total of about 14 days. These 14 days were a continuous period during the first half of November 2003, during which B15A drifted a short distance away from Lewis Bay, but was soon drawn back southward when the pressure gradient magnitude increased again. On 18 November and into 19 November 2004, the pressure gradient over B15A fell below 7.4 × 10⁻³ Pa m-1 for just over 17.3 continuous hours (Fig. 7a), soon before it began to drift out of the region and into conditions of increasing pressure gradient magnitude.
Throughout most of October, when B15A was subjected to “high-gradient,” (e.g. a pressure gradient greater than 15 × 10-3 Pa m-1 as in Fig. 7a) albeit continuously falling, pressure conditions, the iceberg drifted at a mean speed of about 0.02 m s-1 and attained a maximum speed of about 0.2 m s-1 according to the GPS record. While the maximum drift speed throughout October and November varies little, the mean monthly drift speed fluctuates more significantly. During November when the iceberg maintained a higher mean drift speed of 0.04 m s-1, it was able to drift out of the parking lot (Fig. 7b).
The most significant observation about the pressure gradient conditions on B15A from the start of October through the end of November is their gradual decline, which likely allowed B15A to gradually depart the parking lot. Previous significant drops in the pressure gradient magnitude occurring while B15A was in the parking lot, such as the one resulting in the 14-day period of low-gradient conditions in November 2003, were too short-lived to allow B15A the opportunity to gradually drift out of the parking lot as the pressure gradient weakened. For example, the low-gradient conditions in November 2003, arose in a matter of minutes, lasted no longer than an hour, and were of relatively small magnitude.
Another example: pressure gradient on B15K
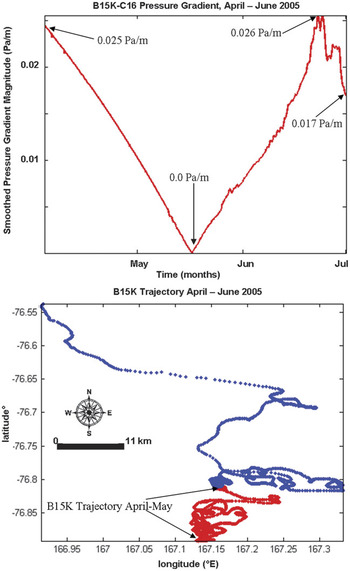
Here, the magnitude of the smoothed pressure gradient calculated from the B15K and C16 AWS records is examined, between the beginning of April and the end of June 2005. The pressure gradient weakened significantly during B15K’s final months in the area (Fig. 8a). The pressure gradient magnitude on B15K dropped by 24.5 × 10⁻³ Pa m-1, from 24.5 × 10⁻³ Pa m-1 to nearly zero, from early April until the start of the day on 13 May, when it began rising again. A second pressure gradient drop, from 25.6 × 10⁻³ Pa m-1 to 17 × 10-3 Pa m-1, took place between June 18 and the end of that month (Fig. 8a). The decreases in the pressure gradient magnitude through the middle of May and during the end of June likely played an important role in allowing B15K to escape from the parking lot (Fig. 8). From April through June 2005, B15K travelled 37.6 km north and 14.5 km west, during just April through May, B15K moved 8.7 km north and 1.2 km west, and in June alone it moved 28.9 km north and 13.3 km west (Fig. 8b).
a. Displays the magnitude of the smoothed pressure gradient between B15K and C16, from the beginning of April through June 2005. b. Shows the B15K trajectory during April–June 2005, with the trajectory through May in red, and the June trajectory in blue. The iceberg’s journey to the north-west did not commence until the start of June.

Throughout most of April, when B15K was subjected to high-gradient (e.g. a pressure gradient greater than 10 × 10-3 Pa m-1 as in Fig. 8a) and continuously falling pressure conditions, the iceberg drifted at a mean speed on the order of 10-6 m s-1 and attained a maximum speed on the order of 10-4 m s-1 according to the GPS record. Similar to the case of B15A, while the maximum drift speed throughout April and May varies little, the mean monthly drift speed fluctuates more significantly. During May when the iceberg maintained a higher mean drift speed of 10-5 m s-1, it was able to drift out of the parking lot (Fig. 8b).
The history of the pressure gradient on B15K can be briefly summarized as: when the pressure gradient magnitude is falling until the middle of May, it points south toward Ross Island until 12 May, and then moves to point north and away from the parking lot at about the time at which it starts rising in magnitude again, until the end of June. While ocean currents may have also played a role in pushing B15K out of the area, the pressure gradient exhibits a clear signal that it may have pushed the iceberg north when B15K was leaving the region permanently. The pressure gradient magnitude on B15K rises from the end of June from 17 × 10-3 Pa m-1 to 36.4 × 10⁻³ Pa m-1 on 14 August, and subsequently falls again to 28.9 × 10⁻³ Pa m-1 on 23 August.
Discussion
Large tabular icebergs trapped in the parking lot do not exit Lewis Bay until subjected to continuously low pressure gradient conditions. In the case of B15K, a pressure gradient reversal (away from Ross Island) also played a role. In the case of both B15A and B15K, their escapes from the parking lot are immediately preceded by continuously dropping pressure gradients for about a month and a half (about 49 days for B15A, and about 43 days for B15K), followed by a more rapid increase in the magnitude of the gradient, then another decrease of lesser magnitude and significantly shorter duration, to give the icebergs a “final push” out of the parking lot. The dropping pressure gradient conditions for both B15A and B15K immediately prior to their escapes from the parking lot lead to the conclusion that large tabular icebergs need to be subjected to relatively gradual gradient drops of at least magnitude 20 × 10-3 Pa m-1 over a period of several weeks (e.g. longer than a month, for example, about one and a half months), but with the pressure gradient magnitude decreasing to significantly below 10 × 10-3 Pa m-1 by the time it reaches its local minimum.
The most important conclusion of this study, to which the other conclusions are subservient, is that the barometric forcing on large tabular iceberg drift can, under certain circumstances, be very important. Iceberg drift models have until now consistently ignored the pressure gradient force on iceberg freeboards. The low-pressure anomalies, found to be important here, are induced by the interactions of the atmospheric circulation patterns with large and steep topographic features that block airflow on their windward flanks and thus allow surface pressure to drop on their leeward sides. This study could be reinforced by an analysis of locales in which Ice Rafted Debris (IRD) significantly accumulates, as these places may reflect regions in which large tabular icebergs become repeatedly trapped by topographically induced barometric forcing.
Acknowledgements
I would like thank to my PhD dissertation advisor, Professor Douglas R. MacAyeal, who provided me with much guidance on my work. I also thank my other academic advisory committee members, Professors Pamela Martin, Noboru N. Nakamura, Michael J. Foote, and John E. Frederick. Very helpful and constructive comments were provided by two anonymous referees, and by Dr Christina Hulbe. NSF grant OPP-0229546 supported this work.