

Introduction
Child poverty is a persistent multidimensional problem and a lead indicator for future social problems as poverty is often passed down from generation to generation (Bellani and Bia, Reference Bellani, Bia, Atkinson, Guio and Marlier2017). On average, one in five children in the European Union grows up poor, but cross-country differences are large: child poverty is 11% in Denmark and the Czech Republic, while it is 32% in Romania (EUROSTAT, 2020a). Moreover, child poverty has been increasing in most OECD countries (Thévenon et al., Reference Thévenon, Manfredi, Govind and Klauzner2018). Belgium, the country under study in this article, is confronted with a comparatively high child poverty risk and a creeping vulnerability of children (Vandenbroucke and Vinck, Reference Vandenbroucke and Vinck2013; Vinck et al., Reference Vinck, Van Lancker, Cantillon, Cantillon, Chzhen, Handa and Nolan2017). Today, 20.6% of children are income poor, a similar record as the EU average, whereas 12 years ago this was 15.3% (EUROSTAT, 2020a).
Nowadays, policy strategies to reduce child poverty are often inspired by the social investment paradigm (Hemerijck, Reference Hemerijck2017) and primarily focus on parental employment integration while simultaneous investments are made in the future potential of children to stop the vicious circle. Previous research has shown a clear link between childhood disability and child poverty, but for parents of disabled children, such a work strategy appears to be problematic (Cantillon and Van Lancker, Reference Cantillon and Van Lancker2013). This is related to the fact that disabled children generally require additional care that exceeds usual parental care and the time needed for this hampers parental employment, especially for mothers (Brown and Clark, Reference Brown and Clark2017; Stabile and Allin, Reference Stabile and Allin2012). Moreover, their families face an extra burden on the household budget as the child’s disability commonly also entails higher out-of-pocket costs to cover the child’s medical and care needs. Besides, disabled children more often live in households with a disadvantaged social background which independently increases their poverty risk: their households are frequently comprised of single parents, parents holding lower educational qualification, and other disabled household members (e.g. Bauman et al., Reference Bauman, Silver and Stein2006; Blackburn et al., Reference Blackburn, Spencer and Read2010; Van Landeghem et al., Reference Van Landeghem, Breda, Mestdagh, Ghysels and Debacker2007). However, the social policy literature lacks a clear insight into how the receipt of different cash support systems for disabled children is related to their parents’ employment participation and social background, and what joint role these three factors play in understanding their poverty risk.
To fill this gap, a case study on Belgium is performed making use of unique and large-scale register data. Administrative recognitions on the child’s disability are linked to information on their family’s income, employment and social background. A control group of non-disabled children is also included in the dataset. The central questions studied in this article are whether disabled children face an increased poverty risk in Belgium, and what role parental employment, social background and targeted cash support jointly play in this story. A three-step analytical strategy is applied to tackle these questions. The causal chain of events is disregarded from the analyses.
Previous research, mechanisms and contributions to the literature
Previous research has found a positive correlation between childhood disability and different indicators of child poverty and deprivation (Banks et al., Reference Banks, Kuper and Polack2017; Di Giulio et al., Reference Di Giulio, Philipov and Jaschinski2014; Elwan, Reference Elwan1999). This association has been reported in Australia (Leonard et al., Reference Leonard, Petterson, De Klerk, Zubrick, Glasson, Sanders and Bower2005), Belgium (Debacker, Reference Debacker, Ghysels and Debacker2007), Canada (Petrenchik, Reference Petrenchik2008), China (Guo et al., Reference Guo, Luo, Tang, Ding, Song and Zheng2019), France (Delobel-Ayoub et al., Reference Delobel-Ayoub, Ehlinger, Klapouszczak, Maffre, Raynaud, Delpierre and Arnaud2015), the United Kingdom (Blackburn et al., Reference Blackburn, Spencer and Read2010; Emerson, Reference Emerson2012; Emerson et al, Reference Emerson, Shahtahmasebi, Lancaster and Berridge2010), the United States (Bauman et al., Reference Bauman, Silver and Stein2006; Houtrow et al., Reference Houtrow, Larson, Olson, Newacheck and Halfon2014; Porterfield and Tracey, Reference Porterfield and Tracey2003; Pulcini et al., Reference Pulcini, Zima, Kelleher and Houtrow2017), and Vietnam (Mont and Cuong, Reference Mont and Cuong2011). However, it is not universally true for all disability types. For children with autism spectrum disorder (ASD), a weaker (Emerson, Reference Emerson2012 for UK), non-existent (Pulcini et al., Reference Pulcini, Zima, Kelleher and Houtrow2017 for US) or even reversed (Durkin et al., Reference Durkin, Maenner, Baio, Christensen, Daniels, Fitzgerald and Yeargin-Allsopp2017 for US) relationship is found. The latter might be attributed to a diagnosis bias: as already shown by Wing in Reference Wing1980, parents with an advantaged social background more often obtain the correct diagnosis for their child with ASD, though this is more recently not necessarily confirmed in countries with universal health care (Rai et al., Reference Rai, Lewis, Lundberg, Araya, Svensson, Dalman and Magnusson2012 for Sweden).
Different mechanisms might explain this adverse relationship, where the causality may run in both directions (Boat and Wu, Reference Boat and Wu2015; Elwan, Reference Elwan1999; Lustig and Strauser, Reference Lustig and Strauser2007; Mont, Reference Mont2014; Porterfield and Tracey, Reference Porterfield and Tracey2003). The “health selection” explanation states that childhood disability can cause child poverty since the disability entails higher costs, posing a burden on the household budget (Brown and Clark, Reference Brown and Clark2017; Stabile and Allin, Reference Stabile and Allin2012). Families with disabled children are confronted with higher direct costs to pay for the child’s medical and care needs. Moreover, they face indirect costs in terms of forgone labour earnings, as caring for disabled children requires more time than for non-disabled children, impeding parental employment, especially of mothers. For Belgium too, the presence of both direct and indirect costs has been reported for disabled children (Van Landeghem et al., Reference Van Landeghem, Breda, Mestdagh, Ghysels and Debacker2007; Vinck and Brekke, Reference Vinck and Brekke2020, Vinck and Van Lancker, Reference Vinck and Van Lancker2020). If one would account for the additional direct costs, the already greater poverty risk of disabled children in Flanders would increase substantially (Debacker, Reference Debacker, Ghysels and Debacker2007). Moreover, it has been shown that child poverty is strongly determined by the level of employment participation of the household children are living in (Gornick and Jäntti, Reference Gornick and Jäntti2012) and that Belgium occupies an exceptional position in this respect (Vandenbroucke and Vinck, Reference Vandenbroucke and Vinck2013). Almost consistently over the last decade, Belgium has the second highest relative share of children living in households where nobody works among the income-poor children in a European comparative perspective; only Ireland performs worse (EUROSTAT, 2020a, 2020b, 2020c). Yet, it is still unclear what role the indirect costs precisely play in the Belgian poverty estimates among disabled children. That is our first contribution to the literature.
In contrast, the “social causation” explanation implies that poverty during childhood or prior to childbirth may cause disability due to the detrimental health effects that may result from limited access to (preventive) health care, poorer health behaviour, growing up in bad or dangerous living environments, or parenting behaviour that is considered to be less assisting, encouraging or consistent (Bolte et al., Reference Bolte, Tamburlini and Kohlhuber2010; Kiernan and Huerta, Reference Kiernan and Huerta2008; Maggi et al., Reference Maggi, Irwin, Siddiqi and Hertzman2010; Power et al., Reference Power, Li and Manor2000). For example, Delobel-Ayoub et al. (Reference Delobel-Ayoub, Ehlinger, Klapouszczak, Maffre, Raynaud, Delpierre and Arnaud2015) show that more deprived areas in south-western France have a higher prevalence of children with ASD or intellectual disabilities than less deprived areas. Blackburn et al. (Reference Blackburn, Spencer and Read2013) report for the UK that children who grew up in socioeconomic deprived households in their early years are more likely to have disabling chronic conditions later in childhood than their counterparts from more privileged households. In fact, the poverty risk of disabled children is strongly tied to processes of social stratification (Rothwell et al., Reference Rothwell, Gariépy, Elgar and Lach2019; Shahtahmasebi et al., Reference Shahtahmasebi, Emerson, Berridge and Lancaster2011). Disabled children more often live with lower educated parents, single parents, and other disabled household members (e.g. Bauman et al., Reference Bauman, Silver and Stein2006; Blackburn et al., Reference Blackburn, Spencer and Read2010). This is no different in Belgium (Van Landeghem et al., Reference Van Landeghem, Breda, Mestdagh, Ghysels and Debacker2007; Vinck and Van Lancker, Reference Vinck and Van Lancker2020). These three factors increase the family’s poverty risk independently of having a disabled child (Gornick and Jäntti, Reference Gornick and Jäntti2012; Grammenos, Reference Grammenos2018; Vinck et al., Reference Vinck, Van Lancker, Cantillon, Cantillon, Chzhen, Handa and Nolan2017), but, whether – and, if so, to what extent – they explain the poverty risk of disabled children in Belgium still has to be investigated. That is our second contribution to the literature.
Even though it is challenging to disentangle cause from effect in an empirical way, a mutually reinforcing relationship between childhood disability and child poverty might occur, yielding long-lasting negative consequences for the child’s development and opportunities throughout life (Elwan, Reference Elwan1999; McKinley Yoder and Cantrell, Reference McKinley Yoder and Cantrell2019; Mont, Reference Mont2014; Parish and Cloud, Reference Parish and Cloud2006). This adverse relationship can be cushioned by welfare programmes that increase the household’s income (Boat and Wu, Reference Boat and Wu2015; Luca and Sevak, Reference Luca and Sevak2019; Romig, Reference Romig2017), though they have to be evaluated in relation to the costs incurred by the child’s disability (Byrne, Reference Byrne2014). For Belgium, Van Landeghem et al. (Reference Van Landeghem, Breda, Mestdagh, Ghysels and Debacker2007) report that the difference in the equivalised disposable household income between families with disabled and non-disabled children is smaller than when the difference is investigated on the basis of the household’s income from employment only, suggesting that the social security system partially eliminates the inequalities. However, the authors do not provide evidence to pinpoint which component of the social security system succeeds in protecting the income of families with a disabled child. Moreover, to get insight into the poverty reducing impact of cash support systems among disabled children, it is crucial to take into account who actually receives the cash support, in particular how the receipt is related to parental employment and social background. To our knowledge, this remains to be unravelled. That is our third contribution to the literature.
Targeted cash support for families with (disabled) children in Belgium
Belgium is a federal state where responsibilities for social policies are (partly) decentralised. Until recently, cash support measures for families with (disabled) children were regulated at the federal level but, since 2014, they have mainly been decentralised to the regional level. Here, we describe the three main targeted cash support systems as they were in place in 2010 (the year of data collection).
The main cash support measure that is targeted at families with children is the regular child benefit. It is characterised by “targeting within universalism”, though the lion’s share of the budget is universally allocated (Van Lancker and Van Mechelen, Reference Van Lancker and Van Mechelen2015). Children under 18 and students aged 18 to 24 are eligible. The system is composed of a universal amount with age and birth order supplements, and a number of income-tested supplements for vulnerable groups (i.e. social assistance recipients, long-term unemployed, long-term sick and single parents).
For children with increased care needs, including disabled children, a supplement within the regular child benefit system exists: the supplemental child benefit. It is a non-means-tested cash benefit for children less than 21 years old whose disability is recognised by the Federal Public Service Social Security. Control doctors evaluate the severity of the disability and award a score on a 36-point scale using standardised criteria. The scale is made up of three pillars that intend to capture the consequences of the disability for the child’s (1) physical and mental health (maximum 6 points), (2) self-reliance in daily life (maximum 12 points), and (3) family (maximum 18 points). Higher scores correspond to a higher benefit amount, ranging from € 80 to more than € 500 per month. For more information on the recognition procedure, see Vinck et al. (Reference Vinck, Lebeer and Van Lancker2019).
Within the personal income tax system, a refundable tax credit for dependent children exists. For each dependent child in the household, the tax allowance (the amount that is exempt from personal income taxes) of one parent is increased. If the parent’s taxable income is lower than the sum of the tax allowances and tax credits, the unused part of the increased tax allowance becomes refundable, limited to € 390 per dependent child per year. Children who receive the supplemental child benefit and who have at least four points on the first pillar are counted as dependent twice.
Data, variables and methods
Administrative data are used to answer two central questions: do disabled children face an increased poverty risk in Belgium, and what role do parental employment, social background and targeted cash support jointly play in this story? The dataset links microdata from the Datawarehouse Labour Market and Social Protection (DWH LM&SP) from December 31st, 2010 to the Belgian Census of January 1st, 2011. The DWH LM&SP brings together administrative data from Belgian social security agencies and the National Register on individuals’ personal and household characteristics, including their place of residence, income received from different sources, employment participation, date and place of birth, disability status, and household composition. Information on the educational level is taken from the Census. Disabled children are operationalised as children receiving the supplemental child benefit (2.1% of Belgian children under 18 in 2010). A random sample of 50% of children under 21 who lived in Belgium and received the supplemental child benefit on December 31st, 2010 and a randomly drawn control group of children under 21 who did not receive the supplemental child benefit of similar size are acquired.
Child poverty is defined in accordance with the European headline at-risk-of-poverty indicator, as the share of children under 18 living in a household with an equivalised net disposable household income below a poverty line set at 60% of the national median equivalised net disposable household income. We draw on the Belgian sample of the EU Statistics on Income and Living Conditions for income year 2010 (BE-SILC, 2011) to set the poverty threshold. The OECD-modified equivalence scale is used to make incomes comparable across households of different sizes (Hagenaars et al., Reference Hagenaars, de Vos and Zaidi1994). Yet, this equivalisation does not correct for other variations in needs, such as the additional costs incurred by families when they are confronted with increased medical and care needs. Unfortunately, neither previous research nor the data at hand allow to take these increased out-of-pocket costs into account, but their potential presence should be kept in mind when interpreting the results. Both a poverty headcount ratio (hereafter income poverty risk) and poverty gap ratio are applied.
A three-phase analytical strategy is performed to investigate the link between child income poverty and childhood disability. First, the household’s equivalised net disposable household income and accompanying income poverty risk are estimated for disabled and non-disabled children. Therefore, the gross taxable income information available in the DWH LM&SP is used. This is the income after social security contributions are paid but before taxes are withdrawn. Information is available for the income received from employment, self-employment, pensions, unemployment benefits, sickness and invalidity benefits, disability benefits, social assistance and child benefits (the latter are simulated). To go from an individual’s gross taxable income to its household’s equivalised net disposable income, the withholding tax schedule is employed. These are advance payments to the final personal income taxation, taking only its essential aspects into consideration. For detailed information on the simulation process, see Appendix 1.
Second, a multivariate logistic regression is used to examine whether the correlations between child poverty and family characteristics differ for disabled and non-disabled children, controlling for the region of residence (Flanders/Brussels/Wallonia) and the child’s age. To serve that purpose, interaction effects between the child’s disability status (0/1, one referring to children who receive the supplemental child benefit) and each of the family characteristics (in terms of parental employment and social background) are included in the model. Parental employment is measured jointly by an indicator labelled “household work intensity”. This is the ratio between the total number of months worked (expressed in full-time equivalents) by all working-age household members (18-59 year olds, excluding students 18-24) and the total number of months that they could, in theory, have worked. The ratio goes from zero to one, with zero meaning that none of the working-age household members participated in paid employment, while one indicates that they worked full-time for the full yearFootnote 1 . The indicator is categorised into very low (0-0.2), low (0.2-0.45), medium (0.45-0.55), high (0.55-0.85) and very high (0.85-1) work intensity.
Regarding the social background, the role of household composition, parental education, parental migration background and the presence of other household members with a recognised disability is investigated. For the household composition, the household type (single parents versus two parents) as well as the number of children under 18 present in the household (less than three versus three or more) are included. The International Standard Classification of Education (ISCED) is used to operationalise the parents’ educational level, differentiating between parents with low (ISCED 0-2: lower secondary education or less), medium (ISCED 3-4: secondary education) and high educational qualifications (ISCED 5-6: tertiary education). The highest educational level of one of the parents is taken as the household value. For the migration background, a distinction is made between parents born in Belgium, other European Union countries (EU27) and non-EU27 countries. When one parent is born in Belgium or in another EU27 country, the household is considered to have a Belgian or EU27 migration background respectively. The household is assigned a non-EU27 migration background if the parents are born in a non-EU27 country. Finally, consistent with the operationalisation of childhood disability, the disability of other household members is identified by the receipt of a disability-specific benefit. A dummy variable indicates whether at least one other household member receives the supplemental child benefit (for under 21) or a disability benefit for individuals aged over 21. An administrative recognition is needed for the latter too, but, contrary to the supplemental child benefit, the receipt of the benefit is also conditioned on a means test.
The poverty reducing impact of the cash support systems for disabled and non-disabled children is tested in a final step. Therefore, the first and second analytical step are repeated for three alternative scenarios when the main cash support systems are, simultaneously and separately, excluded from the net disposable income. Three components of income protection for families with disabled and non-disabled children are considered: the regular child benefit (CB), the supplemental child benefit (SCB) and the refundable tax credit (TC). The first scenario subtracts the three cash support systems from the household’s income (− CB − SCB − TC), the second includes only the regular child benefit (+ CB − SCB − TC), and the third additionally adds the supplemental child benefit (+ CB + SCB − TC). For all scenarios, it is examined whether the cash support systems alter the income poverty rate and gap as well as the associations that exist between child poverty, childhood disability and the family characteristics compared to the baseline when all three cash support systems are included (+ CB + SCB + TC).
The analyses focus on children under 18 in accordance with the child poverty definition. Children whose parents have zero income on any of the income components (excluding child benefits) are disregarded from the analyses as it cannot be assessed with certainty that they truly have no income. They could have no known labour income within the Belgian personal income taxation since they work as outbound workers, are employed at a European or other international organisation, or receive a non-taxable scholarship. Or, they could solely be living off other income sources than the ones related to (current and past) employment (e.g. income from moveable or immovable property). This reduces the sample with 19%Footnote 2 , resulting in 18,486 disabled and 16,961 non-disabled children. A population weight is applied to both samples. The total samples are used to estimate the overall income poverty rate and gap in the first and third analytical step as well as for the descriptive analyses included in Appendix 2. The logistic regression model in the second and third analytical step omits children who have missing information on any of the variables included (resulting in 17,677 disabled and 16,206 non-disabled children). Sensitivity checks with the 50% and 70% poverty thresholds (Appendix 4) and without applying the population weight (Appendix 5) generally yield the same conclusions.
Results
Income poverty estimates and determinants among disabled and non-disabled children
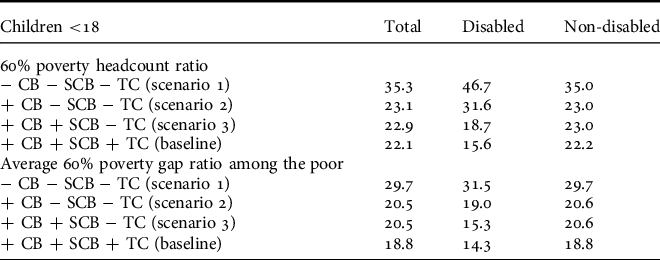
Table 1 shows that 22.1% of children under 18 in Belgium live at risk of income poverty with an average depth of poverty of 18.8%Footnote 3 . Disabled children face a smaller income poverty risk (15.6%) and gap (14.3%) compared to non-disabled children (22.2% and 18.8% respectively).
60% income poverty estimates, children under 18, disabled versus non-disabled, %, Belgium, 2010

Source: own calculations based on DWH LM&SP (2010).
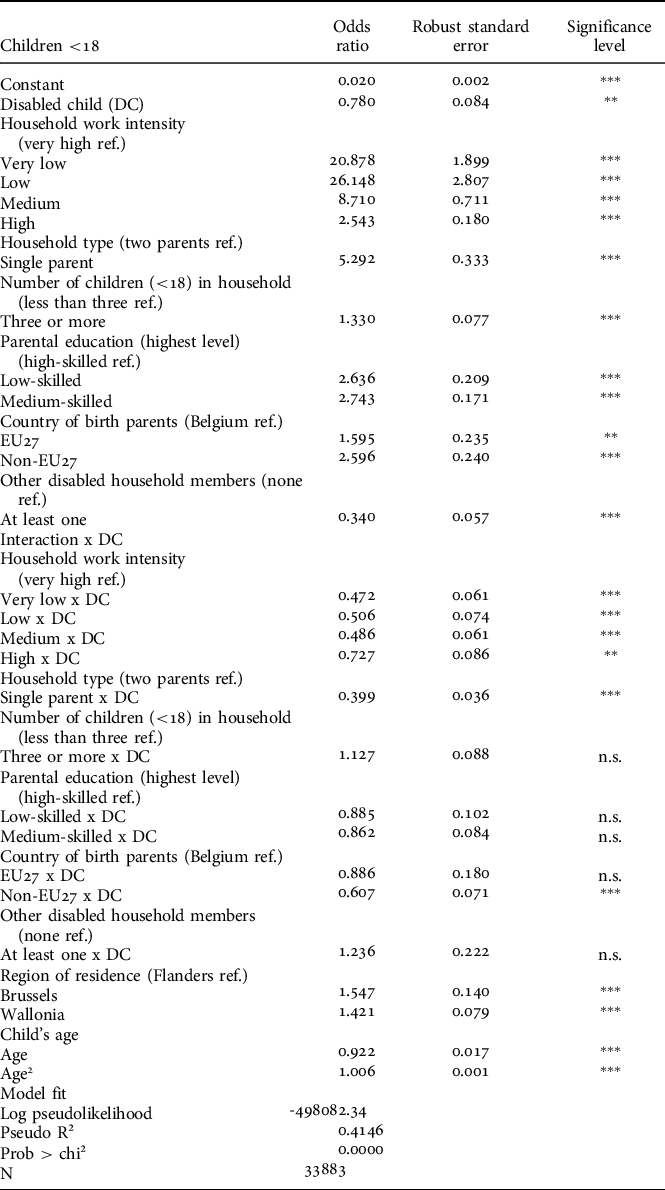
Also when their family’s employment participation and social background are controlled for, disabled children have a lower income poverty risk compared to non-disabled children (odds ratio smaller than one in Table 2). Moreover, in line with the social policy literature on child poverty, Table 2 shows that positive correlations exist between the child’s income poverty risk on the one hand, and lower parental employment and a disadvantaged social background on the other, for disabled and non-disabled children alike (odds ratios of the main effects are larger than one). Children who live in households with lower work intensity (versus very high work intensity), headed by a single parent (versus two parents), with three or more children (versus less than three), with low- or medium-skilled parents (versus high-skilled), and parents who are born outside Belgium (versus within Belgium), experience a higher income poverty risk than their respective reference groups. Only for the presence of other disabled household members the reverse is true (odds ratio smaller than one). Yet, for some of these associations, the strength differs between disabled and non-disabled children. Weaker associations are reported for disabled children with respect to the household’s work intensity, the household type and the parental non-EU27 migration background (compared to being born in Belgium). This is apparent from the multiplication of the main effects of the family characteristics and their interaction effects with childhood disability. If this multiplication brings the association closer to the value of one, the correlation is weaker for disabled than for non-disabled children. For example, the increased income poverty risk of children living with a single parent (compared to two parents) is larger for non-disabled children (among them, the odds are 5.292 times higher) than for disabled children (among them, the odds are 2.114 times as large (5.292 multiplied by 0.399)). For the number of children in the household, the parental educational level, the presence of other disabled household members and the parental EU27 migration background (compared to being born in Belgium), no significant differences between disabled and non-disabled children are found. Figure 1 visualises these results. It presents the relationship between the predicted income poverty risk and each family characteristic as marginal effects, for disabled and non-disabled children separately, keeping all other variables in the logistic regression model at their mean value.
Logistic regression on 60% income poverty risk, children under 18, Belgium, 2010

Source: own calculations based on DWH LM&SP (2010) and Census (2011).
Notes: not living at-risk-of poverty is the baseline. *p<0.05, **p<0.01, ***p<0.001, n.s. not significant.
Marginal effects of family characteristics on predicted 60% income poverty risk, children under 18, disabled versus non-disabled, Belgium, 2010
Source: own calculations based on DWH LM&SP (2010) and Census (2011).
Notes: marginal effects are shown for each interaction effect of Table 2, at mean values for the remaining variables. 95% confidence intervals show that, in each situation, disabled children have a lower predicted probability to live in income poverty than non-disabled children. Household work intensity is categorised into very low (0-0.2, VLWI), low (0.2-0.45, LWI), medium (0.45-0.55, MWI), high (0.55-0.85, HWI) and very high (0.85-1, VHWI) subgroups. n.s. the slopes of the lines (w.r.t. the reference) do not differ significantly between disabled children and non-disabled children, * the slopes differ significantly.

Poverty reducing impact of cash support systems
Given that parents of disabled children work less, earn less, and have a disadvantaged social background in Belgium (Vinck and Brekke, Reference Vinck and Brekke2020, Vinck and Van Lancker, Reference Vinck and Van Lancker2020), the lower income poverty risk of these children compared to non-disabled children is a counterintuitive result. One possible explanation is that the cash support systems succeed in mitigating the concurrence of childhood disability and child poverty proven in previous case studies in other countries. In this section, we unravel which cash support system(s) provide(s) adequate income protection to families with disabled children, taking into account who actually receives the support. The first order effect is calculated, meaning that no account is taken of how parents might adjust their labour market participation to compensate for the loss of income in the absence of cash support.
When the income poverty rate and gap are estimated without including the three main cash support systems, the picture changes (Table 3). In the scenario where the regular child benefit, supplemental child benefit and refundable tax credit are simultaneously excluded from the household’s income, the child income poverty risk would increase with 60% (from 22.1% in the baseline to 35.3% in scenario 1), but the increase would be stronger among disabled than among non-disabled children (+199% versus +58%). In fact, disabled children would run a higher income poverty risk than non-disabled children (46.7% versus 35.0%). Each cash supplement has a considerable poverty reducing impact for the children who receive them. The regular child benefit is important for disabled and non-disabled children alike: it decreases their poverty rate with 32% and 34% respectively (comparing scenario 1 and 2). However, if that would be the only cash supplement granted, disabled children would still run a higher poverty risk (31.6% versus 23.0%). Only once the supplemental child benefit is taken into account, the poverty risk of disabled children drops below that of non-disabled children (18.7% versus 23.0%). Including the refundable tax credit reduces the poverty risk further (comparing scenario 3 to the baseline), more for disabled than for non-disabled children (-16% versus -3%). The same lessons can be learned from the average poverty gap.
60% income poverty estimates, with and without cash support, children under 18, disabled versus non-disabled, %, Belgium, 2010

Appendix 3 further investigates the impact of the targeted cash support on children’s position in the income distribution. It confirms that the impact is greater for disabled than non-disabled children. In addition to the importance of lifting children out of poverty, each cash support system has a considerable upward impact for children living just above the poverty threshold. The impact is smaller higher up in the income distribution.
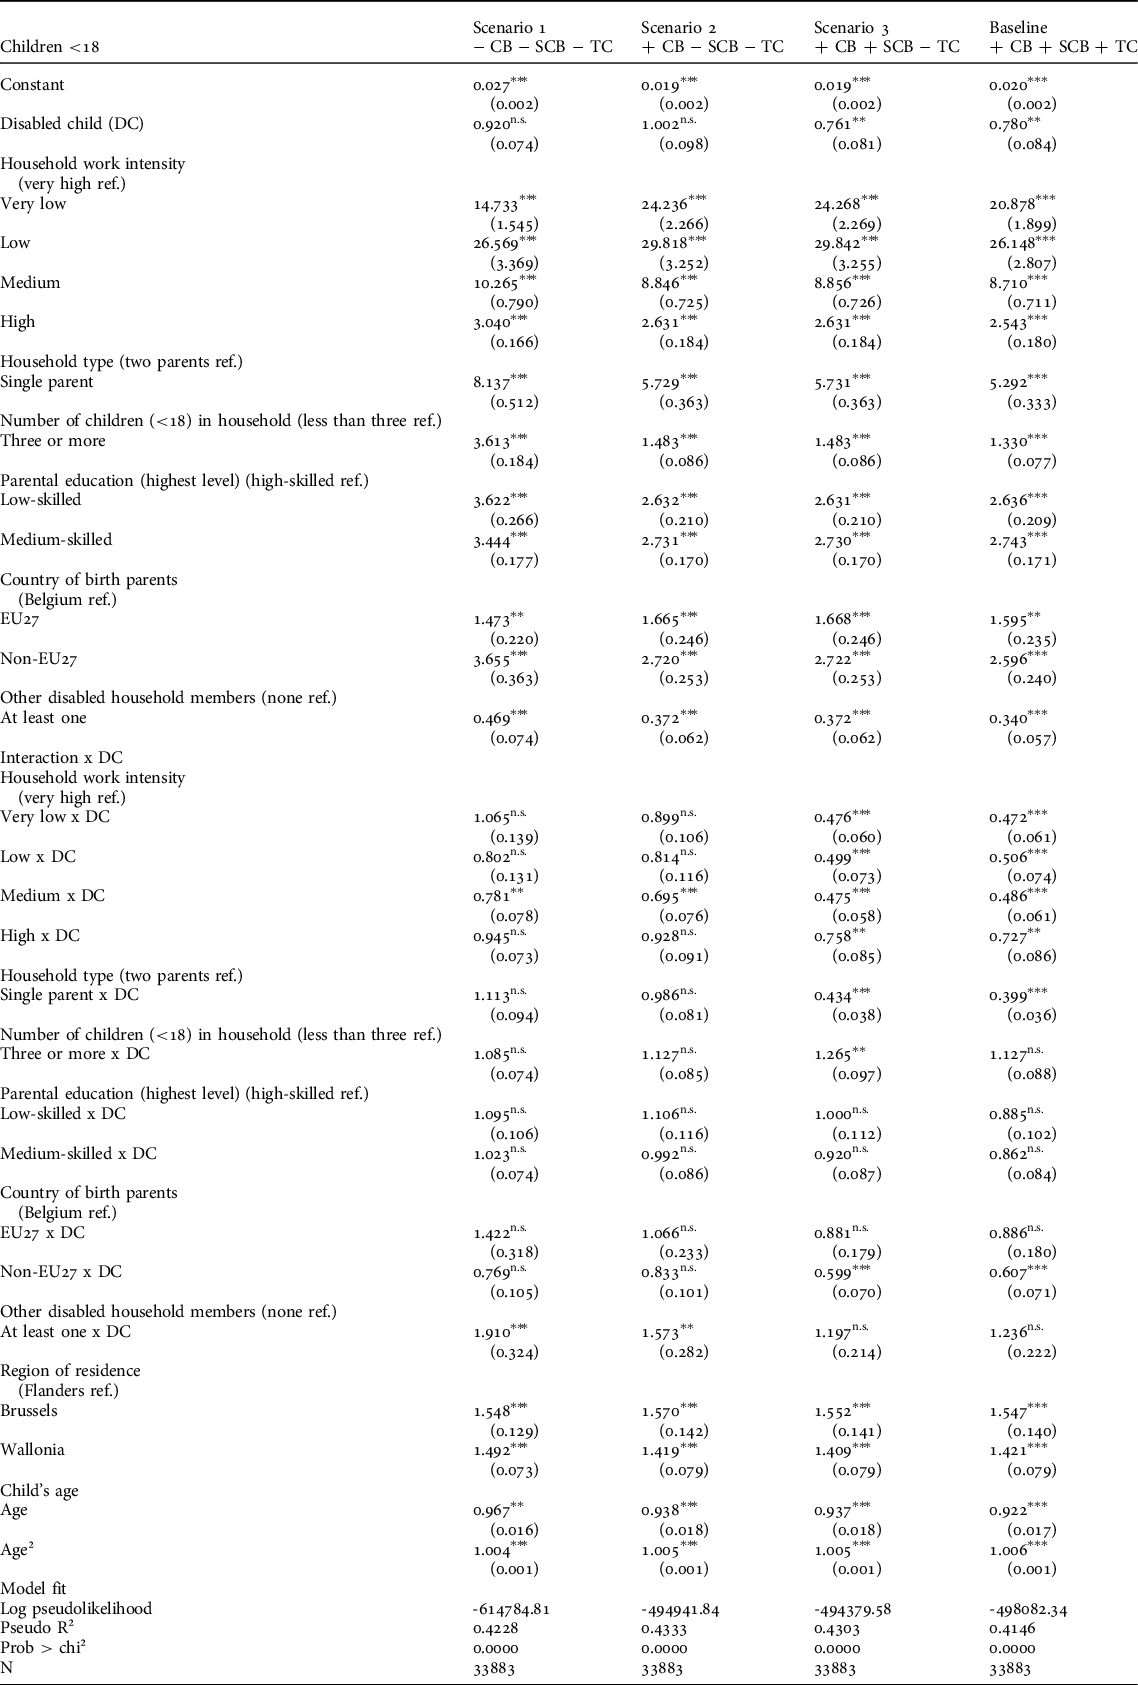
Once parental employment and social background are controlled for (Table 4), the income poverty risk would no longer differ significantly between disabled and non-disabled children when the three main cash support systems are excluded from their household’s income (scenario 1) or when only the regular child benefit is included (scenario 2). In other words, their parents’ lower employment and disadvantaged social background explain the higher income poverty risk for disabled children in the first and second scenario in Table 3. Moreover, none of the associations between the family characteristics and the income poverty risk vary in a significant way between disabled and non-disabled children (the interaction effects of scenario 1 and 2 in Table 4).
Logistic regression on 60% income poverty risk, with and without cash support, children under 18, odds ratios, Belgium, 2010

The story changes once the remaining cash support systems are taken into account (scenario 3 and baseline). Table 4 confirms their strong poverty reducing impact for disabled children. After adding the supplemental child benefit (scenario 3) and the refundable tax credit (baseline), the income poverty risk among disabled children is significantly lower than among non-disabled children. This can be explained by the profile of those who receive the supplemental child benefit: they are more likely to live in poverty due to their lower parental employment and disadvantaged social background (Vinck and Van Lancker, Reference Vinck and Van Lancker2020). Here it is evident from the interaction effects. Once the supplemental child benefit and the refundable tax credit are integrated into the household’s income the associations between the child’s income poverty risk and the family characteristics are mitigated. The correlations with parental employment, household type and parental non-EU27 migration background are now significantly less strong for disabled children.
Figure 2 visualises the poverty reducing impact of the cash support systems. For each scenario, it presents the relationship between the child’s disability status and the predicted income poverty risk as marginal effects, keeping all other variables in the logistic regression at their mean value (black and grey lines, shown on the left axis). Moreover, it shows the weighted average of the equivalised cash support that income-poor households with children receive in each scenario, differentiating between the cash support systems and between disabled and non-disabled children (bars, shown on the right axis). Three lessons can be learned. First, families with disabled children get, on average, higher regular child benefits than families with non-disabled children (see Appendix 6 for a detailed analysis). Second, also the tax credit they get refunded is higher as disabled children are counted as dependent twice. Third, the supplemental child benefit is indispensable in protecting the household’s income for disabled children. In fact, it succeeds in halving their income poverty risk.
Marginal effect of child’s disability status on predicted 60% income poverty risk (left axis) and mean equivalised cash support among the poor (right axis), with and without cash support, children under 18, Belgium, 2010
Source: own calculations based on DWH LM&SP (2010) and Census (2011).
Notes: Predicted child poverty risks are shown as marginal effects of child’s disability status (left axis), at mean values for the remaining variables of Table 4. Mean equivalised cash support is shown for poor disabled and non-disabled children, by component and population weighted (right axis). Population of poor children changes in each scenario.

Discussion and conclusion
This article investigates whether childhood disability coincides with child poverty while the interplay between parental employment, social background and targeted cash support is taken into account. To do so, a case study on Belgium is conducted making use of unique and large-scale register data.
The analyses are limited in three ways. First, the employed income-based poverty indicator disregards the expenditures families have to make. It only takes the family’s income into account. Also, by using the OECD-modified equivalence scale to make these incomes comparable across households, it is indirectly supposed that the same standard of living applies to families with the same equivalised income, regardless of whether they have a disabled child or not. Yet, it is likely that an equally high income cannot be converted into an equally high standard of living as families with disabled children face higher out-of-pocket costs to pay for the children’s additional medical and care needs. Based on this, it can be expected that the poverty estimates provided in this article are lower-bound estimates of their real standard of living. To properly understand the standard of living among families with a disabled children, additional indicators are needed which take these increased costs incurred by the child’s disability into account. Previous studies on disabled adults have attempted to do so and have (1) included the extra costs in poverty estimates and (2) assessed to what extent these costs are covered by (governmental) support (e.g. Loyalka et al., Reference Loyalka, Liu, Chen and Zheng2014; Mont and Cuong, Reference Mont and Cuong2011; Morris and Zaidi, Reference Morris and Zaidi2020; Palmer et al., Reference Palmer, Williams and McPake2019; Saunders, Reference Saunders2007; Zaidi and Burchardt, Reference Zaidi and Burchardt2005). For disabled children, comparable exercises remain to be done.
The presented poverty risks are underestimated in another way too. The data allow to consider only children who receive the supplemental child benefit as disabled. However, this benefit is subject to non-take-up. Vinck et al. (Reference Vinck, Lebeer and Van Lancker2019) estimate that at least 10% of disabled children are not recognised for the supplemental child benefit and hence do not receive the extra money. Future research should look into the income situation, the corresponding poverty risk and the joint impact of parental employment, social background and receipt of other cash support among disabled children who are missed by the benefit. The available research for Flanders suggests that for this group the income poverty risk would be higher than for non-disabled children (Debacker, Reference Debacker, Ghysels and Debacker2007), but how it correlates with potential confounding factors and what impact other cash support systems have on their income poverty risk still has to be investigated.
Third, given the cross-sectional nature of the data, it is not possible to discern the causal mechanisms between childhood disability and child poverty. The potential presence of reverse causation (i.e. social causation explanation) could actually overestimate the presented poverty risks, as part of the observed correlation can be explained by previous poverty spells. Exploring the associations on longitudinal data (as Rothwell et al., Reference Rothwell, Gariépy, Elgar and Lach2019) or employing an instrumental variable approach would allow to get causal purchase on the issue.
Keeping these limitations in mind, the results suggest that disabled children have a lower income poverty risk than non-disabled children, even though their parents often work less and hold a disadvantaged social background. This can be explained by the targeted cash support these families receive. If they would only receive the regular child benefit, disabled children would run an equally high income poverty risk than non-disabled children once their family characteristics are controlled for. The supplemental child benefit has a strong poverty reducing impact for disabled children. In fact, it succeeds to halve their income poverty risk. This can be explained by the profile of the children who receive the benefit: they initially run an increased poverty risk due to their parents’ lower employment and disadvantaged social background (Vinck and Van Lancker, Reference Vinck and Van Lancker2020). Hence, the associations between income poverty among children and some of the explanatory factors are significantly weaker for disabled than for non-disabled children. This is true for children who live in households with lower employment, headed by single parents, and where the parents are born outside the EU27 (versus at least one parent being born in Belgium). For the number of children in the household, parental educational level, presence of other disabled household members and parents with an EU27 migration background (compared to being born in Belgium), no significant differences between disabled and non-disabled children are found.
One important policy implication can be derived from this. The supplemental child benefit clearly succeeds in protecting the incomes of families with a disabled child, even when their lower levels of employment and disadvantaged social background are taken into account. In fact, it mitigates the relationship between the income poverty risk among children and the explanatory factors identified in the literature for the families who receive the benefit. However, a substantial group of disabled children does not receive the supplemental child benefit. Hence, more could be achieved if the non-take-up would be addressed, in particular among the most vulnerable children.
Competing interests
The author declares none
Acknowledgements
The author is thankful to two anonymous reviewers, Wim Van Lancker and Bea Cantillon for their critical feedback on an earlier version of the manuscript and to participants of the FISS 2019 conference for their much appreciated comments and suggestions.
Funding
This work was supported by the Research Foundation Flanders (FWO, grant 1113818N).
Supplementary material
To view supplementary material for this article, please visit https://doi.org/10.1017/S0047279421000398