Implications
Ruminant meat often has a negative image for health because of its fat content and its composition. A way to improve the fatty acid composition of the meat is to supplement feed with unsaturated vegetable oils such as olive or soybean oil, thereby making it healthier for the consumer and improving the commercial value of the beef.
Introduction
The fattening of beef cattle using ad libitum access to cereal concentrates and straw is a production system used in Spain and other countries in southern Europe (including Portugal and central and southern Italy) where the availability of good quality forage is limited. In such a system, the consumption of concentrate makes up >90% of the total ration (Faleiro et al., Reference Faleiro, González, Blanch, Cavini, Castells, Ruíz de la Torre, Manteca, Calsamiglia and Ferret2011). As a result, the profitability of the production system depends largely on reducing the fattening time. This implies using concentrates with a high energy density, which is achieved by adding fats, with the most common being palm oil. As a result, the meat has an unfavourable ratio of polyunsaturated fatty acids (PUFA)/saturated fatty acids (SFA) for consumers, compared with that of animals reared in extensive grazing systems (De La Fuente et al., Reference De La Fuente, Diaz, Alvarez, Oliver, Furnols, Sañudo, Campo, Montossi, Nute and Cañeque2009). There is currently much interest in adding value to the beef by reducing the SFA content and increasing the levels of some specific fatty acids (FAs) that may be beneficial for human health, such as oleic acid, CLA and n-3 PUFA (Shingfield et al., Reference Shingfield, Bonnet and Scollan2013). However, because the chemical composition of the meat is directly linked to its quality, modifying the FA profile of intramuscular fat could affect its sensory properties (Oliver et al., Reference Oliver, Nute, Font, Furnols, San Julián, Campo, Sañudo, Cañeque, Guerrero, Alvarez, Díaz, Branscheid, Wicke and Montossi2006).
Oleic acid is susceptible to isomerization in the rumen, resulting in the formation of a variety of trans-monoene isomers (Mosley et al., Reference Mosley, Powell, Riley and Jenkins2002; McKain et al., Reference McKain, Shingfield and Wallace2010). These isomers could be transferred to milk fat or meat fat. A small number of studies carried out with olive oil in dairy sheep (Pérez Alba et al., Reference Pérez Alba, De Souza Cavalcanti, Pérez Hernández, Martínez Marín and Fernández Marín1997; Gómez-Cortés et al., Reference Gómez-Cortés, Frutos, Mantecón, Juárez, De La Fuente and Hervás2008; Gallardo et al., Reference Gallardo, Gómez-Cortés, Mantecón, Juárez, Manso and De La Fuente2014), feedlot lambs (Manso et al., Reference Manso, Bodas, Castro, Jimeno and Mantecón2009) and suckling lambs (Manso et al., Reference Manso, Bodas, Vieira, Mantecón and Castro2011; Gallardo et al., Reference Gallardo, Gómez-Cortés, Mantecón, Juárez, Manso and De La Fuente2014) have reported an increase in oleic acid, a substantial increase in a wide variety of trans-monoene isomers and an increase in c9,t11-18:2 in milk and meat. Spain is the world’s most important producer of olive oil, and when it is refined for human consumption a large quantity of by-products are formed, which are often used in animal feeds. The Spanish ruminant feed market currently offers a by-product obtained from the manufacture of olive oil with a high oleic acid content. This product (OLIFAT) is marketed in the form of calcium soap and is widely used in Spain and Portugal for the feeding of ruminants. As far as is known, no studies have been carried out on the effect of adding olive oil when steers are fattened ad libitum with cereal concentrate and straw.
The most common method of enhancing the CLA content of ruminant meat and dairy products is to provide the animals with additional dietary sources rich in linoleic and linolenic acids for use as substrates for ruminal biohydrogenation. PUFA content is also increased when they are fed with PUFA-rich oils. Soybean oil and linseed oil are the two major sources available for ruminant feeding that are rich in linoleic and linolenic acids. However, because the availability of linseed oil in Europe is very limited in diets for ruminants, soybean oil is commonly used as a source of PUFA (Confederación Española de Fabricantes de Alimentos Compuestos para Animales, 2014).
Unprotected oils are seldom used in ruminant diets because they may impair ruminal fermentation, which leads to reduced animal production (Jenkins, Reference Jenkins1993). However, recent research in dairy ewes (Gómez-Cortés et al., Reference Gómez-Cortés, Frutos, Mantecón, Juárez, De La Fuente and Hervás2008; Castro et al., Reference Castro, Manso, Jimeno, Del Alamo and Mantecón2009) and steers (Ludden et al., Reference Ludden, Kucuk, Rule and Hess2009) has shown that diets supplemented with moderate amounts of unprotected oils modify the FA profile of milk and meat without adverse effects on digestion and animal performance. Hydrogenated palm oil (HIDROFAT) is a solid fat, inert in the rumen, made up of FAs of palm oil that undergo a process of hydrogenation, during which their degree of saturation increases. In Spain, HIDROFAT is commonly used to fatten steers that are being fed ad libitum with cereal concentrate and straw. The aim of this study was to evaluate the performance and quality of the carcass and meat of steers whose diets had been supplemented with different vegetable oils commonly used in the compound feed industry in Spain.
Material and methods
Animals and experimental diets
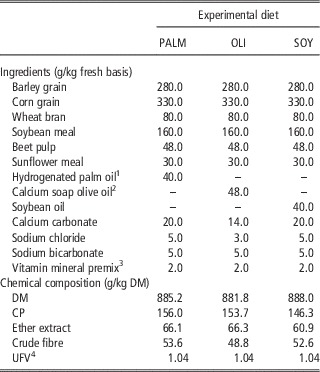
All animal handling practices followed Directive 2010/ 63/EU of the European Parliament and the Council on the Protection of Animals used for experimental and other scientific purposes. To carry out this study, 240 pure bred ‘Blonde d’Aquitaine’ steers of the same age, with an average BW of 293.7±38.88 kg, were used. The steers were selected from farms that used the same feeding system and were taken to a farm where the experiment took place. At the arrival, animals were grouped randomly into 24 batches (10 steers/batch) that were randomly assigned to one of the three experimental treatments (eight batches per treatment): PALM, with 4% of hydrogenated palm oil (Hidrofat© Nutrición Internacional, S.L., Madrid, Spain), OLI, with 4.8% of calcium soap of olive oil, which provides a 4% oil level in the feed (Olifat© Anupal, S.L. Zaragoza, Spain) and SOY, with 4% soybean oil. The diets were formulated to be isoenergetic and isonitrogenous and to provide the same amount of ether extract (EE). Steers were offered concentrates and barley straw ad libitum in separate feeders. Both concentrate and straw were available throughout the day.
To determine the chemical composition of each experimental concentrate, 10 samples of 100 g were taken from different areas of the vehicle that brought the feed to the farm. These samples were pooled to form a homogeneous mixture, which was analysed for dry matter (DM) (AOAC official method 934.01), ash (AOAC official method 942.05), Kjeldahl nitrogen (AOAC official method 941.04), crude fibre (AOAC official method 962.09) and EE (AOAC official method 920.39).
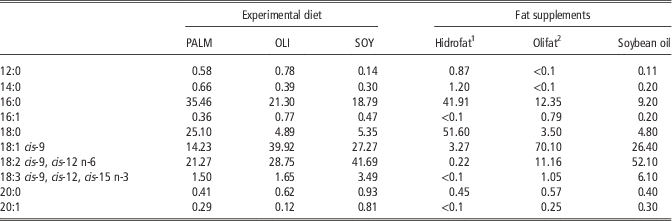
Determination of FA content of the feed was performed according to the One Step extraction and quantification procedure proposed by Sukhija and Palmquist (Reference Sukhija and Palmquist1988). Methyl esters of FAs were analysed by gas chromatography using an HP-6890 Hewlett-Packard (Avondale, PA, USA) apparatus equipped with a flame ionisation detector and a capillary column HP-Innowax (100×0.32 mm×0.25 polyethylene glycol).
The ingredients and the chemical composition of the experimental diets are shown in Table 1. Table 2 shows the FA composition of the experimental diets and fat supplements.
Ingredients and chemical composition of the experimental concentrates containing hydrogenated palm oil (PALM), calcium soap olive oil (OLI) and soybean oil (SOY)

DM=dry matter.
1 Hydrogenated palm oil fatty acids (Hidrofat©; Nutrition International, S.L., Madrid, Spain).
2 Calcium soap olive oil fatty acids (Olifat©; Anupal, S.L. Zaragoza, Spain).
3 Vitamin mineral premix (NUTEMIX®; NUTEGA, Madrid, Spain) provided (per kg of premix): Mg, 57.5 g; Zn, 31.25 g; Mn, 10 g; S, 75 g; Fe, 6 g; Co, 0.25 g; Se, 0.05 g; vitamin A, 4 000 000 IU; vitamin D3, 1 125 000 IU; vitamin E 17.5 g; vitamin B1, 1 g; vitamin B2, 0.5 g and vitamin B12, 2.5 g.
4 UFV: feed unit for maintenance and meat production. Estimated from INRA (2007).
Fatty acid composition (% of total fatty acids) of the experimental concentrates containing hydrogenated palm oil (PALM), calcium soap olive oil (OLI) and soybean oil (SOY), and fat supplements (Hidrofat, Olifat and soybean oil)

1 Hydrogenated palm oil fatty acids (Hidrofat©; Nutrition International, S.L., Madrid, Spain).
2 Calcium soap olive oil fatty acids (Olifat©; Anupal, S.L. Zaragoza, Spain).
Experimental procedure
The 24 batches of animals were housed in 24 covered feed lots with concrete floors and cereal straw bedding. The size of each lot was 5×10 m, and each had a 2-m long hopper feeder (1000 kg capacity) for concentrate, a 6 m feeder for straw and a 2-m long drinker area. After a 15-day period of adaptation to the experimental feeds, the consumption of concentrate during the experimental period (30 weeks) was noted. The experimental concentrates were added weekly and the quantity of concentrate offered in each feeder was recorded. Measurements of the quantity of feed remaining in the feeder were taken every 15 days. The quantity of concentrate consumed in each feed lot was the difference between the concentrate provided and that remaining in the hopper. The straw consumed was not recorded.
The steers were weighed individually (0900 h) using a TRU-TEST scale (model XR3000B, Grupanor-Cercampo, S.A., Madrid, Spain). Three BWs were recorded: (1) at the end of the adaptation period (day 0), (2) half way through the fattening period (day 100) and (3) at the end of the experimental period when the animals were sent to slaughter (day 209). Calculation of the concentrate conversion ratio (total concentrate ingested/BW gain during the experimental period, kg/kg) was based on concentrate consumption and weight gain. The steers were transported to a commercial abattoir where they were slaughtered following standard slaughtering procedures. Transportation did not exceed 2 h.
Slaughter measurements and sampling
After slaughter, hot carcass weight was recorded and carcass yield was calculated as the ratio between hot carcass weight and BW 24 h before slaughter. Carcasses were subjectively classified 24 h after slaughter, for conformation and degree of fatness under EU standards (OJEU, 2007). The conformation score was graded on a scale ranging from 1 (very poor conformation) to 18 (very good conformation) and the fatness score measured on a scale from 1 (very low fat) to 15 (very high fat). The meat pH was measured 24 h postmortem in the longissimus dorsi muscle between the L4 and L5 using a penetration electrode adapted to a portable pH meter (Crison-507, Crison Instruments S.A.; Alella, Spain). For the meat quality analysis, a steer was randomly selected from each batch and the 6th rib on the left half carcass was dissected. The longissimus dorsi muscle was subsequently separated from the fat and bone, and divided into four portions, which were placed in aluminium bags, vacuum packaged and frozen at −30°C until analysis. Samples were thawed at 4°C for 24 h in their bags before carrying out the corresponding analysis.
Meat quality
Colour, texture, chemical composition and lipid oxidation
Commission International de l’Eclairage colour values L*, a*, b* were measured in the longissimus dorsi muscle with a Minolta CM 2600d reflectometer-colorimeter (I.T.A. Aquateknica, SA Valencia, Spain) (Illuminant: D65; visual angle: 10º). The colour coordinates are expressed as L* (lightness), a* (redness index) and b* (yellowness index). Chroma (C*) and hue (h*) were calculated as C*=(a*2+b*2)1/2 and h*=tan−1(b*/a*), respectively. The texture analysis was conducted using a piece of meat cooked in water at 75°C for 30 min. A Mod TA.XT2 Texture Analyser (Stable Micro Systems, Ltd, Surrey, UK) fitted with a Warner–Bratzler cutter was used. Eight to 10 prisms (1×1 cm in cross section) cut parallel to the direction of the muscle fibre were obtained from each piece of meat. The parameters measured were maximum shear force (kg/cm2) (Møller, Reference Møller1980), and the total work performed to cut the sample or the area under the curve obtained (kg/s cm2) (Ariño et al., Reference Ariño, Hernandez and Blasco2006). The chemical composition of the meat was determined on longissimus dorsi muscle samples, which were analysed for moisture (AOAC official method 950.46), CP (AOAC official method 981.10), fat (official method 960.39) and ash (AOAC official method 920.153). The susceptibility of muscle tissue homogenates to iron-induced lipid oxidation was determined by a method proposed by López-Bote et al. (Reference López-Bote, Daza, Soares and Berges2001).
Analysis of intramuscular fat
FA methyl esters of freeze-dried longissimus dorsi muscle were formed in duplicate according to the method proposed by Lee et al. (Reference Lee, Tweed, Kim and Scollan2012) and analysed by gas chromatography as described for the FAs from the feed.
Sensory analysis
To perform the analysis of the organoleptic characteristics of the meat, the selection and training of panellists was required following the directions of the ISO standard 8586-1: 1993. Nine people were selected (four women and five men), aged 24 to 50 years. They were trained to familiarise them with sensory techniques and improve their sensory capabilities and memory until reaching a reliable and accurate assessment. After training, the sensory profile was developed to define the product. The profile sheet was composed of the following attributes: odour intensity (assessed by taking two or three short breaths over the vapour emanating from the sample when opening the wrapping foil), hardness (texture characteristic related to tenderness assessed on the third or fourth mastication of the sample), juiciness (wetness felt in the mouth from the water released from the sample and the secreted saliva, assessed after four chews), chewiness (assessment of the time or number of chews required to swallow the sample), fibrosity (assessment of the amount of bits of meat remaining in the mouth after eating), flavour (sample aroma and flavour intensity assessed while chewing), overall acceptability (assessment of the overall quality perceived from the sample as a whole, as objectively as possible). These sensory characteristics, compiled and refined by the panel during the training sessions, were rated on an unstructured line scale (0 to 100 mm), where a score of 0 was very low and 100 was very high (Diaz et al., Reference Diaz, Cañeque, Sanchez, Lauzurica, Perez, Fernandez, Alvarez and De la Fuente2011). Samples were thawed at 4°C, 24 h before each session. The steaks were wrapped in aluminium foil and cooked in an electric convection oven pre-heated for 10 min at a temperature of 180°C. The temperature inside the steak was controlled with a Digi-Sense temperature probe (Fisher Scientific, S.L., Madrid, Spain). The samples were removed from the oven when they reached an internal temperature of 70°C. Each steak was cut into 1.5×2 cm samples. These portions of meat from each animal were wrapped in aluminium foil and identified with a three digit alphanumeric code. Prepared samples were kept on stoves to prevent cooling for the duration of the session. Four sessions were conducted in a test room with nine individual standardized cabins (ISO 8589:1988) and under a red light to mask the different product shades, at 1000 h and lasting ~1 h. In each session the judge assessed the sensory profile of six animals, two animals per treatment. The six samples were given to each judge in each session in random order. At the beginning of the session and before each sample, tasters ate a piece of bread without salt and rinsed their mouths with mineral water. The course of the sessions was always performed in the same manner.
Statistical analysis
A prior analysis of the normality and homogeneity of variance of all variables was performed using the Shapiro–Wilks test with the UNIVARIATE procedure and the Bartlett’s test with the ANOVA procedure for residues. All the variables met the two assumptions.
The results were analysed according to a completely randomised design using ANOVA with PROC GLM, SAS statistical package version 9.1 (SAS Inst Inc., Cary, NC, USA).
To study the two variables concentrate intake and concentrate conversion ratio, the batch (n=24) was taken as the experimental unit, and for variables related to meat quality, the steer selected from each batch (n=24) was used. The model used was:
 $$Y_{{ij}}= {\equals}\mu {\plus}T_{i} {\plus}{\varepsilon}_{{j(i)}} $$
where Y ij is the jth observation in the ith level of factor treatment (T), μ the overall mean response, T i the effect due to the ith level of factor treatment (T) and ε j(i) the residual error of the jth observation in the ith level of factor treatment (T).
For other variables used to study growth performance and those for carcass characteristics, the experimental unit was the steer (n=240). The model used was:
 $$Y_{{ijk}} ={\equals}\mu {\plus}T_{i} {\plus}B_{j} {\plus}{\varepsilon}_{{k(ij)}} $$
where Y ijk is the kth observation in the ith level of factor treatment (T) and the jth level of factor batch (B), μ the overall mean response, T i the effect due to the ith level of factor treatment (T), B j the effect due to the jth level of factor batch (B) and ε k(ij) the residual error of the kth observation in the ith level of factor treatment (T) and the jth level of factor batch (B).
Initial BW was included as a covariate in the model used to analyse steer growth during fattening. The model used was:
 $$Y_{{ijk}} ={\equals}\beta \left( {ILW_{{ijk}} {\minus}\,{\rm ILW}\ldots} \right){\plus}\mu {\plus}T_{i} {\plus}B_{j} {\plus}{\varepsilon}_{{k(ij)}} $$
where Y ijk is the kth observation in the ith level of factor treatment (T) and the jth level of factor batch (B), β the regression coefficient of the covariate initial BW, ILW ijk the kth initial live weight in the ith level of factor treatment (T) and the jth level of factor batch (B), ILW… the average initial live weight for all treatments and batches, μ the overall mean response, T i the effect due to the ith level of factor treatment (T), B j the effect due to the jth level of factor batch (B) and ε k(ij) the residual error of the kth observation in the ith level of factor treatment (T) and the jth level of factor batch (B).
Significant differences were established where P<0.05. Values of P<0.1 are discussed as trends. The differences between the means of the different treatments were established following the LSD method. Principal component analysis (PCA) was carried out based on data for meat quality (colour, texture, chemical composition, FA and sensory analysis) using the SAS/PRINCOMP procedure (SAS Inst Inc.). For PCA, data were standardized to a mean of zero and a variance of one.
Results and discussion
Animal performance and carcass characteristics
The experimental feeds were formulated to be isoenergetic and isonitrogenous and to provide the same quantity of EE (the calculated composition for the three experimental feeds was 890 g DM/kg wet matter, 157 g CP/kg DM, 65 g EE/kg DM and 1.04 UFV/DM). Nevertheless, based on the chemical analysis of the concentrates, there was a slight deviation in the soybean oil feed in the concentration of CP and EE (Table 1).
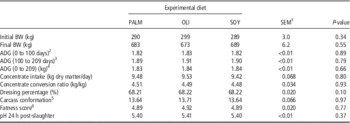
The type of oil added to the concentrate did not influence (P>0.05) final BW, average daily gain (ADG), concentrate intake and concentrate conversion ratio (concentrate/gain ratio). Moreover, no differences (P>0.05) were found in carcass weight, conformation, fatness or pH 24 h after slaughter (Table 3). It is generally accepted that including unsaturated fats in ruminant rations leads to a decrease in the digestion of structural carbohydrates in the rumen, and that the reduction is less when protected fats are used, such as calcium soaps or hydrogenated fats (Doreau and Chilliard, Reference Doreau and Chilliard1997). A lower productive output with the SOY treatment, compared with PALM and OLI, was therefore to be expected. In agreement with this study, Ludden et al. (Reference Ludden, Kucuk, Rule and Hess2009) noted no differences in concentrate intake, ADG, concentrate conversion ratio, carcass yield, fatness or conformation when 5% soybean oil was added to concentrate for steers. However, Engle et al. (Reference Engle, Spears, Fellner and Odle2000) observed a lower concentrate intake and a lower ADG when 4% soybean oil was added for finishing steers. In a review of data on the use of fats in steer fattening, Clinquart et al. (Reference Clinquart, Micol, Brundseaux, Dufrasne and Istasse1995) found that incorporation levels below 5% do not affect ruminal digestion or productive output, irrespective of the type of fat used or how the fats are pre-treated. Doreau and Chilliard (Reference Doreau and Chilliard1997) indicated that the reduced digestibility of organic matter when unsaturated fats are added is due to a poorer utilisation of the fibrous fraction, without modification of starch digestion. It has been demonstrated that lipids have a negative effect on bacterial growth. This action is more pronounced with PUFA than with SFA and is especially marked on cellulolytic strains (Galbraith et al., Reference Galbraith, Miller, Paton and Thompson1971). Another effect of fat supplementation is the decrease in the protozoal population, which contributes to cellulolysis (Doreau and Ferlay, Reference Doreau and Ferlay1995). The level of fat included (4%) and the low input of fibre in the experimental feeds could explain why the current study showed no effect on growth performance and carcass characteristics.
Performance and carcass characteristics of steers fed diets containing hydrogenated palm oil (PALM), calcium soap olive oil (OLI) and soybean oil (SOY)

1 Pooled SEM.
2 Average daily gain: BW day 100 to BW day 0.
3 Average daily gain: BW day 209 to BW day 100.
4 Average daily gain: BW day 209 to BW day 0.
5 Measured with an 18-point scale (1: very poor conformation, 18: very good conformation).
6 Measured with a 15-point scale (1: very low fat, 15: very high fat).
Meat quality
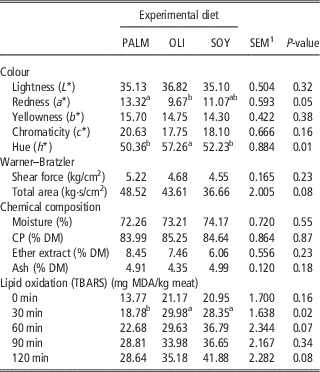
The mean values of colour, texture and chemical composition of meat and lipid oxidation (Thiobarbituric acid reactive substances, TBARS) are shown in Table 4.
Meat colour, texture, chemical composition and lipid oxidation of beef steers fed diets containing hydrogenated palm oil (PALM), calcium soap olive oil (OLI) and soybean oil (SOY)

DM=dry matter; TBARS=thiobarbituric acid reactive substances; MDA=malonaldehyde.
1 Pooled SEM.
a,bValues within a row with different superscripts differ significantly at P<0.05.
Meat from OLI steers had the lowest a* (redness) value (P=0.05) and the highest h* (hue) value (P=0.01), meaning that the meat of steers eating olive oil is more brownish red in colour. The colour of the meat depends on the animal’s age, weight, exercise, nutrition and meat pH (Priolo et al., Reference Priolo, Micol and Agabriel2001). In this study, all these factors, except nutrition, were the same in all experimental groups. The results suggest that olive oil produced meat with a brownish red colour that was more intense than in steers that had received palm or soybean oil. No reason could be found for this. As far as is known, the only other analysis of the effect of olive oil on meat colour was carried out on sheep (Vieira et al., Reference Vieira, Fernández-Diez, Mateo, Bodas, Soto and Manso2012) to study the influence of feeding ewes with palm, olive, soybean or linseed oil during lactation. The results, unlike those of this study, showed a tendency towards higher a* values in meat from lactating lambs whose mothers had consumed olive oil.
In the current study, the type of oil did not (P>0.05) affect the shear force itself. However, a trend of a lower total area value was noted in the meat of SOY steers (P=0.08), which is associated with more tender meat. These results were similar to those of Hernández-Calva et al. (Reference Hernández-Calva, He, Juárez, Aalhus, Dugan and McAllister2011), who found no differences in the values of shear force after supplementing feeds with flax seed in finishing cull cows.
The meat from the OLI and SOY treatments had higher TBARS values than the PALM, but the differences were only statistically significant at 30 min (P<0.05). At 60 min (P=0.07) and 120 min (P=0.08) there was a tendency for the values to be higher. These results suggest that lipid oxidation of meat was higher in steers fed olive and soybean oil than in those fed with palm oil. Monounsaturated fatty acids (MUFA) and PUFA are more susceptible to oxidation than SFA (Wood et al., Reference Wood, Richardson, Nute, Fisher, Campo, Kasapidou, Sheard and Enser2003) and it is therefore not surprising to observe increased TBARS values in meat from steers offered olive oil or soybean oil, which have higher MUFA and PUFA levels, respectively, than the PALM treatment. These results are similar to those of McNiven et al. (Reference McNiven, Duynisveld, Charmley and Mitchell2004), who report more oxidation in meat from steers fed with toasted soybean seeds compared with those fed with palm oil.
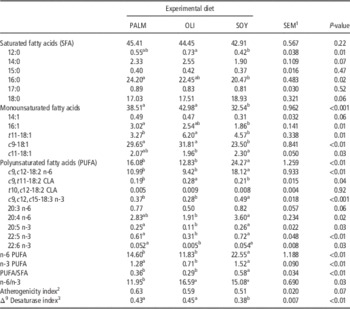
The FA composition of intramuscular fat is shown in Table 5. There were no differences in total SFA of intramuscular fat. However, the content of 12:0 (P<0.05) was lower and 14:0 tended (P=0.07) to be lower in the SOY treatment compared with the OLI treatment, while the PALM treatment gave intermediate values. Similar results have been reported by Manso et al. (Reference Manso, Bodas, Vieira, Mantecón and Castro2011) in suckling lambs whose mothers had consumed palm oil, olive oil or soy oil. The content of 16:0 was higher (P<0.05) in the fat of PALM steers compared with SOY steers. McNiven et al. (Reference McNiven, Duynisveld, Charmley and Mitchell2004) and Cabezas et al. (Reference Cabezas, Castro and Jimeno2012) also found higher percentages of 16:0 in the intramuscular fat of steers fed with palm oil compared with animals fed with extruded soybeans or soybean oil, respectively. In the current study, the higher content of 16:0 in PALM meat fat compared with SOY meat fat can be attributed to the considerable amount of this FA in the PALM diet (Table 2), and to the fact that 16:0 does not suffer changes in the digestive tract (Scollan et al., Reference Scollan, Choi, Kurt, Fisher, Enser and Wood2001). The content of 18:0 (P=0.06) tended to be higher in fat from the steers that consumed soybean oil compared with PALM. The greater concentration of C18:0 observed in the meat of steers fed the SOY diets compared with that of steers given the PALM diet may be due to the total ruminal biohydrogenation of part of the unsaturated dietary C18 and the lower activity of the Δ9 desaturase enzyme in the SOY treatment (Table 5). This enzyme partly converts the 18:0 into c9-18:1 in the adipose tissue (Demeyer and Doreau, Reference Demeyer and Doreau1999) and its activity is inhibited by PUFAs (Ntambi, Reference Ntambi1999), which were more abundant in the SOY treatment. Similar results have been reported by Dhiman et al. (Reference Dhiman, Zaman, Olson, Bingham, Ure and Pariza2005) with 4% soybean oil, and Madron et al. (Reference Madron, Peterson, Dwyer, Corl, Baumgard, Beermann and Bauman2002) with extruded whole seed soybean. Although the OLI diet provides a greater amount of c9-18:1 than the PALM diet (Table 2), the content of this FA in the OLI meat fat did not differ from that of the PALM meat fat. These results could be explained by the abundance of 18:0 in the PALM diet, which reaches the adipose tissue and, as mentioned previously, is partly converted into c9-18:1 via Δ9 desaturase, while the c9-18:1 provided by the OLI diet is susceptible to isomerization in the rumen and the formation of several trans-monoenes isomers (Mosley et al., Reference Mosley, Powell, Riley and Jenkins2002; McKain et al., Reference McKain, Shingfield and Wallace2010).
Intramuscular fatty acid composition (% identified fatty acids) of beef steers fed diets containing hydrogenated palm oil (PALM), calcium soap olive oil (OLI) and soybean oil (SOY)

1 Pooled SEM.
2 Atherogenicit index (12:0+(4×14:0)+16:0)/(MUFA+PUFA) (Ulbricht and Southgate, Reference Ulbricht and Southgate1991).
3 Δ9 Desaturase index (14:1+16:1+18:1)/(14:1+16:1+18:1+14:0+16:0+18:0) (Noci et al., Reference Noci, French, Monahan and Moloney2007).
a,bMeans within rows with different superscript differ significantly (P<0.05).
The intramuscular fat of steers fed with OLI had higher (P<0.01) concentrations of t11-18:1 and c9,t11-18:2 than that of steers fed with palm oil or soybean oil. In the rumen, c9,t11-18:2 is produced during biohydrogenation of c9,c12-18:2n-6 (Griinari and Bauman, Reference Griinari and Bauman1999). In vitro studies have shown that during the biohydrogenation of oleic acid, small amounts of t11-18:1 are also produced (Mosley et al., Reference Mosley, Powell, Riley and Jenkins2002; McKain et al., Reference McKain, Shingfield and Wallace2010). The c9,t11-18:2 present in adipose tissue comes from ruminal biohydrogenation of c9,c12-18:2n-6 (Griinari and Bauman, Reference Griinari and Bauman1999) and from the endogenous synthesis from t11-18:1. Pavan and Duckett (Reference Pavan and Duckett2007) indicate that in the adipose tissue of steers, 80% of c9,t11-18:2 derives from the desaturation of t11-18:1. As a result, the endogenous synthesis of c9,t11-18:2 by Δ9 desaturase activity is strictly connected to the content in t11-18:1. Similar results have been reported by Jenkins (Reference Jenkins2000) in steers fed with rapeseed oil rich in oleic acid, in which an increase in the t11-18:1 content from 1.72% to 4.22% was observed. Likewise, Pérez Alba et al. (1997) and Gallardo et al. (Reference Gallardo, Gómez-Cortés, Mantecón, Juárez, Manso and De La Fuente2014) reported a drastic increase in the content of trans-18:1 and t11-18:1 isomers, respectively, in dairy sheep that were also offered calcium soap of olive oil. However, Hristov et al. (Reference Hristov, Kennington, McGuire and Hunt2005), in a study comparing sunflower oil rich in linoleic acid (76.5% linoleic acid) and sunflower oil rich in oleic acid (76.5% oleic acid) in concentrate lot steers, found no differences in the content of t11-18:1 or c9,t11-18:2. The observed increase in the content of trans-18:1 isomers when supplementing with oils rich in oleic acid could be due to the fact that oleic acid can interfere with the biohydrogenation of linoleic acid, leading to an accumulation of trans-18:1 (Mosley et al., Reference Mosley, Powell, Riley and Jenkins2002). Due to the ability of Δ9 desaturase in human tissue to transform t11-18:1 into c9,t11-18:2 (Turpeinen et al., Reference Turpeinen, Mutanen, Aro, Salminen, Basu and Palmquist2002), the increase in the t11-18:1 content in meat implies an improvement of its lipid profile.
Despite the higher content of c9,c12-18:2n-6 and c9,c12,c15-18:3n-3 in the SOY feed, compared with the PALM, there were no significant differences in the t11-18:1 and c9,t11-18:2 content in the meat. These results contradict other studies that report higher levels of t11-18:1 and c9,t11-18:2 after the addition of oils rich in linoleic and linolenic acids (Madron et al., Reference Madron, Peterson, Dwyer, Corl, Baumgard, Beermann and Bauman2002; McNiven et al., Reference McNiven, Duynisveld, Charmley and Mitchell2004; Erjaei et al., Reference Erjaei, Zali, Ganjkhanloo, Dehghan-Banadaky, Tufarelli and Laudadio2012). However, the results of this study are supported by other studies, such as those of Engle et al. (Reference Engle, Spears, Fellner and Odle2000) and Beaulieu et al. (Reference Beaulieu, Drackley and Merchen2002), who used 4% and 5% soybean oil supplements, respectively, and did not observe any increase in the c9,t11-18:2 content. Similarly, Raes et al. (Reference Raes, Haak, Balcaen, Claeys, Demeyer and De Smet2004) found no significant differences in the t11-18:1 or c9,t11-18:2 content in the meat of steers when comparing a diet containing flax seed and a diet supplemented with a bypass fat rich in C16:0 and C18:0. The reason for the lack of a significant increase of c9,t11-18:2 in the intramuscular fat after the addition of oils rich in 18:2 and 18:3 is not clear. The above-mentioned authors (Raes et al., Reference Raes, Haak, Balcaen, Claeys, Demeyer and De Smet2004) suggest that it is due to lower activity of the Δ9 desaturase, which could affect the endogenous production of c9,t11-18:2. In this trial and others that showed no increase in c9,t11-18:2, the animals were fed with a diet based on concentrate, while in studies showing increased c9,t11-18:2, steers were fed on forage and concentrate. Some authors have obtained an increase in the c9,t11-18:2 content in steer meat by increasing the proportion of forage in the ration (McGuire et al., Reference McGuire, Duckett, Andrae, Giesy and Hunt1998; French et al., Reference French, Stanton, Lawless, O’Riordan, Monahan, Caffrey and Moloney2000). In another trial using steers, Griswold et al. (Reference Griswold, Apgar, Robinson, Jacobson, Johnson and Woody2003) observed that supplementing finishing steers with 4% soybean oil based on concentrate and forage (80:20) decreased the c9,t11-18:2 content compared with the same diet without soybean oil. Production of c9,t11-18:2 and t11-18:1 takes place during the isomerization and biohydrogenation of PUFA in the rumen (Griinari and Bauman, Reference Griinari and Bauman1999). Isomerization and biohydrogenation are strongly affected by ruminal pH (Besa et al., Reference Bessa, Santos-Silva, Ribeiro and Portugal2000). It has been found that a high concentrate diet decreases ruminal pH below 6, thereby reducing the isomerization and hydrogenation of PUFA. This lower isomerization is due to a decrease in the lipolytic activity of the microbial population (Latham et al., Reference Latham, Storry and Sharp1972), since the isomerization of PUFA requires a free carboxylic group on the FA (Jenkins, Reference Jenkins1993). Thus, the ratio between forage and concentrate in the ration can influence both ruminal production of t11-18:1 and c9,t11-18:2, and the efficiency of oil supplementation for increasing meat content.
Feeding steers soybean oil increased the content of c9,c12-18:2n-6 (P=0.002), c9,c12,c15-18:3n-3 (P<0.001), total PUFA (P=0.004) and the PUFA/SFA ratio (P=0.005). Previous studies show an increase in PUFA content when feeding steers with PUFA-rich oils (McNiven et al., Reference McNiven, Duynisveld, Charmley and Mitchell2004 and Reference McNiven, Duynisveld, Turner and Mitchell2011; Noci et al., Reference Noci, French, Monahan and Moloney2007; Erjaei et al., Reference Erjaei, Zali, Ganjkhanloo, Dehghan-Banadaky, Tufarelli and Laudadio2012). This means that the meat of steers fed with soybean oil contains intramuscular fat with a healthier PUFA/SFA ratio from a human health point of view. However, due to the high content of n-6 PUFA of the SOY meat and low content of n-3 PUFA of the OLI meat, the more favourable n-6/n-3 PUFA ratio in terms of human health can be found in the fat of the PALM treatment steers. Ulbricht and Southgate (Reference Ulbricht and Southgate1991) established an index which they called the atherogenicity index ((12:0+(4×14:0)+16:0)/(MUFA+PUFA)), which is defined as the ratio between the content of FAs capable of increasing the levels of serum cholesterol (12:0, 14:0 and 16:0) and the FAs with a protective action (MUFA and PUFA). 14:0 has greater influence in this index due to the experimental evidence portraying it as the main cause of increases in serum cholesterol. According to the values obtained for the atherogenicity index, the intramuscular fat of steers consuming soybean oil (0.51) in the diet tended to be better (P=0.07) than that of steers fed with palm oil (0.63), while those consuming olive oil presented an intermediate value (0.59).
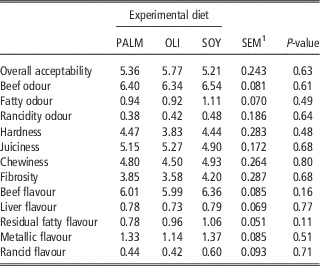
The sensory analysis results are shown in Table 6. There were no significant differences (P>0.05) in the parameters studied in the sensory analysis: odour, texture, flavour and overall acceptability of the meat. Gibb et al. (Reference Gibb, Owens, Mir, Mir, Ivan and McAllister2004) detected no significant difference in the odour of meat from diets supplemented with sunflower oil. However, some authors suggest that the FA composition of the diet can alter the type of volatile compounds produced by meat and thus modify its aroma (Elmore et al., Reference Elmore, Warren, Mottram, Scollan, Enser and Richardson2004). The panel of tasters noted no differences in the hardness (P>0.05) of the meat (Table 6), although steers fed with soybean oil had a lower total area value (Table 4), which is associated with more tender meat. Gibb et al. (Reference Gibb, Owens, Mir, Mir, Ivan and McAllister2004) observed no significant difference in toughness values between animals supplemented with sunflower seed rich in oleic and linoleic acid. McNiven et al. (Reference McNiven, Duynisveld, Turner and Mitchell2011), in agreement with the current study, observed no differences in the sensory characteristics of the meat of steers supplemented with vegetable oils rich in unsaturated FAs (rapeseed, soy or linseed).
Eating quality of grilled longissimus dorsi steaks (1 to 10 scale) of beef steers fed diets containing hydrogenated palm oil (PALM), calcium soap olive oil (OLI) and soybean oil (SOY)

1 Pooled SEM.
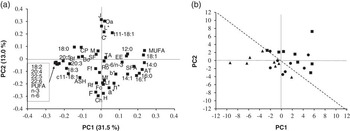
Karlsson (Reference Karlsson1992) proposed that when a large number of measures used to assess meat quality (physical, chemical and sensory characteristics) were correlated, they could be replaced by fewer measures without a significant loss of information. The use of PCA was recommended in order to reduce a whole set of correlated variables of meat quality to uncorrelated linear functions of the original variables. In this respect, the PCA of the meat characteristics are shown in Figure 1a. The analysis shows that about 31.5% of the total variation is explained by the first principal component, 44.5% by the first two principal components and 55.5% by the first three principal components. In other words, 55.5% of the total variance in the 45 considered variables can be condensed into three new variables (PCs). Destefanis et al. (Reference Destefanis, Barge, Brugiapaglia and Tassone2000) reported that 18 variables of beef quality can be condensed into three, since the three new variables obtained explain 62.6% of the variability.
(a) Projection of meat characteristics in the plane defined by two principal components (PC): fatty acids (12:0 to 22:6, PUFA, MUFA, SFA, n-3, n-6, n-6/n-3) atherogenicity index (AT), beef odour (Bo), fatty odour (Fo) rancidity odour (Ro), hardness (H), juiciness (J), chewiness (Ch), fibrosity (F), beef flavour (Bf), liver flavour (Lf), residual fatty flavour (Ff), metallic flavour (Mf), rancid flavour (Rf), overall acceptability (Oa), shear force (SF), total area (TA), lightness (L*), redness (a*), yellowness (b*), chromaticity (c*), hue (h*), ether extract (EE), CP, ash (ASH) and moisture (M). (b) Projection of the observation of the three groups studied in the plane defined by two principal components: ●, PALM (palm oil); ■, OLI (olive oil); ▲, SOY (soybean oil). PUFA=polyunsaturated fatty acids; MUFA=monounsaturated fatty acids; SFA=saturated fatty acids.

In the present study, the first 11 principal components explain 90% of the total variation in the characteristics of the meat (physical, chemical and sensory characteristics). The first principal component (PC1) was defined by the content of FAs 14:0, 16:0, c9-18:1, MUFAs and atherogenicity index, on the right side, which were positively correlated, and c9,c12-18:2n-6, 20:4-n-6, 22:5n-3, 22:6n-3, n-3 PUFA and n-6 PUFAs on the left, which were positively correlated between themselves, but negatively correlated with the variables located on the right side of the figure. All the variables defining PC1 are located away from the origin of the first PC (Figure 1a). In a PC analysis of FAs in beef, De la Fuente et al. (Reference De La Fuente, Diaz, Alvarez, Oliver, Furnols, Sañudo, Campo, Montossi, Nute and Cañeque2009) also reported this distribution of FAs in the projection of the first two principal components: 14:0, 16:0, 18:1 and MUFA on the right side of the projection, which were negatively correlated with 18:2, 20:4 and PUFA located on the left side of the figure.
The sensory characteristics were strongly represented in PC2. Therefore, juiciness and overall acceptability of the meat, and the colour parameters L* and c* are located away from the origin of the second PC in the upper part of the figure, and in the opposite direction, chewiness, fibrosity and hardness, negatively correlated with juiciness and overall acceptability, at the bottom of the figure. This agrees with Cañeque et al. (Reference Cañeque, Pérez, Velasco, Díaz, Lauzurica, Álvarez, Ruiz de Huidobro, Onega and De La Fuente2004) who reported that meat colour and eating quality explained a large part of the observed variation in meat quality in lambs. Based on the overall results of different analyses, PCA has proved to be a very useful method for identifying both the most effective variables and the relationships between them. In fact, PCA allows an instant visual identification of the variables that are correlated with each other, and their direction. Plotting these two factors on a Cartesian axis (Figure 1b) revealed that, on the whole, the meat produced by the OLIVE diet could be discriminated from that of the SOY diet. The meat from steers consuming olive oil is above the line that bisects the quadrants 2 and 4, where MUFAs, 14:0, 16:0, the atherogenicity index, EE, juiciness, overall acceptability of meat, c* and L* are located. The meat of steers consuming soybean oil, however, is at the bottom of said line, where PUFAs, rancid odour, fatty odour, fatty flavour, hardness, chewiness and fibrosity are located. The meat of steers consuming palm oil is between these two groups. The results from this statistical approach reinforce the differences previously described between the three groups studied, where modification of the diet to include unsaturated vegetable oils (olive and soybean oils) produces meat with different quality parameters.
Conclusions
This study shows that the addition of olive oil or soybean oil to the diet of steers improves the nutritional profile of meat FAs, either by increasing the t11-18:1 and c9, t11-18:2 in the case of olive oil, or by increasing the total PUFA and decreasing the index of atherogenicity in the case of soybean oil. The results of the PCA enable meat from steers that have consumed FAs from olive oil to be differentiated from that of those that have consumed soybean oil. It can be concluded that a 4% addition of different vegetable oils (palm, olive and soybean oils) in diets for fattening steers does not affect the growth performance or carcass quality, but considerably modifies the FAs profile and some of the meat quality.
Acknowledgement
The authors acknowledge the support and very helpful comments of Dr Juan Mingot (UPM, Madrid, Spain) and Dr Maria Teresa Diaz (INIA, Madrid, Spain).