Introduction
The Federal Emergency Management Agency (FEMA) defines disasters as “natural catastrophes, technological accidents, or human caused events that have resulted in severe damage, death, and/or multiple injuries.” 1 FEMA-declared disasters include major disaster declarations, emergency declarations, and fire management assistance declarations/fire suppression authorizations. From 2000 to 2016, the United States averaged 58 FEMA major disaster declarations annually. 2 During this same period, Hawaii experienced 11 FEMA major disaster declarations, including severe storms, flooding, landslides, tsunami waves, an earthquake, and a volcanic eruption. In the past 20 years, major disasters have occurred more frequently in the United States, reinforcing the need for disaster preparation to mitigate damage and harm. 2–4
Disasters can compound and exacerbate social vulnerabilities. Reference Morrow5,Reference Nour6 According to the Pandemic and All-Hazards Preparedness and Advancing Innovation Act of 2019, pregnant and postpartum women are considered a population with special clinical needs. 7 Following a disaster, shelters may be established that expose individuals to crowded, stressful environments. Basic resources such as clean water, nutritious foods, diapers, and safe sleeping areas may not be readily available but are especially important for pregnant and breastfeeding women and their infants. Reference Callaghan, Rasmussen and Jamieson8–Reference Larrance, Anastario and Lawry10 Public health and medical services may be interrupted due to damaged infrastructure, power outages, and lack of trained personnel. Reference Harville, Xiong and Buekens11 Depending on the type of disaster, there may be increased risk for environmental or infectious disease exposures, physical injuries, and mental health conditions. Reference Fergusson, Horwood, Boden and Mulder12–Reference Xiong, Harville and Mattison14 Studies have reported stress, Reference Mendez-Figueroa, Tolcher and Abdollah Shamshirsaz15 anxiety, and depression among pregnant and postpartum women following a disaster. Reference Ehrlich, Harville and Xiong16–Reference Zahran, Peek and Snodgrass18 Negative impacts of a disaster can persist long after a disaster has occurred. After a disaster, some reports describe increased incidence of negative birth outcomes such as preterm birth and low birth weight infants, although findings are inconsistent. Reference Antipova and Curtis19–Reference Harville, Xiong and Buekens23
Vulnerable populations, such as pregnant and postpartum women, may have a slow recovery after a disaster because of socioeconomic disadvantages, limited financial resources, and poor social support. Reference Morrow5,Reference Nour6,Reference Callaghan, Rasmussen and Jamieson8,Reference Giarratano, Barcelona, Savage and Harville17,Reference Zahran, Peek and Snodgrass18 Preparedness is associated with reduced vulnerability. Reference Yahmed and Koob3,4 FEMA describes preparedness as an awareness of hazards and understanding of how to protect oneself and one’s family against hazards such as disasters. 24 Baseline measures of preparedness can inform public health education campaigns to increase preparedness and help in planning to meet the population’s needs during a disaster. Disaster preparedness guidance for pregnant and postpartum women is readily available on the Internet; however, limited information is available on the prevalence of preparedness among this population. Reference Zilversmit, Sappenfield, Zotti and McGehee25–29 It may be difficult to estimate baseline measures of preparedness among pregnant and postpartum women through traditional population-based sampling since they are a small percentage of the general population. Reference Horney, Zotti, Williams and Hsia30 The Pregnancy Risk Assessment Monitoring System (PRAMS) is an annual survey conducted by states and the US Centers for Disease Control and Prevention (CDC) which can be used to estimate baseline preparedness among women who recently had a live birth. PRAMS assesses maternal behaviors, attitudes, and experiences throughout pregnancy, including before and shortly after giving birth. 31 Currently, 47 states and 4 other jurisdictions participate in PRAMS, representing approximately 83% of US live births. 31 An analysis of one 2009 Arkansas PRAMS emergency preparedness question provided the first prevalence estimate of postpartum women having an emergency preparedness plan. Reference Zilversmit, Sappenfield, Zotti and McGehee25 The question lacked specificity as it did not capture what the plan entailed, and provided limited information for health departments to target preparedness education. Reference Zilversmit, Sappenfield, Zotti and McGehee25 In 2016, PRAMS introduced an 8-part supplemental question to assess disaster preparedness. 32 This 8-part question was adapted from FEMA’s Introducing the Public Readiness Index and Citizen Corps 2009 National Survey and the Behavioral Risk Factor Surveillance System’s General Preparedness module. 33,34 Hawaii was 1 of 2 states to use the new supplemental emergency preparedness question on its 2016 PRAMS questionnaire and was the only state to meet the PRAMS reporting threshold. Using the 2016 PRAMS data, we assessed the prevalence of emergency preparedness behaviors among women who recently had a live birth in Hawaii. To look at characteristics associated with preparedness, we used factor analysis to distill the 8 preparedness behaviors into correlated preparedness factors.
Methods
Data Collection
PRAMS is a state, population-based sample of women who recently had a live birth. State birth certificate files are used to select approximately 200 women each month in Hawaii. The surveys are self-reported and follow the systematic PRAMS methodology, previously described by Shulman et al. Reference Shulman, D’Angelo and Harrison35 Women receive the survey approximately 2 months after delivery. Contact is made initially by mail and then by phone. In Hawaii, PRAMS is only offered in English. Those who participate receive a US $10 gift card to a local food market. Consent by mail is implied by returning a completed questionnaire; verbal consent is provided by phone. The protocol is reviewed and approved by the Institutional Review Boards of the CDC and the Hawaii State Department of Health.
Variables
The 8 pretested, standardized emergency preparedness questions on the Hawaii PRAMS questionnaire include the following:
-
1. I have an emergency meeting place for family members (other than my home).
-
2. My family and I have practiced what to do in case of a disaster.
-
3. I have a plan for how my family and I would keep in touch if we were separated.
-
4. I have an evacuation plan if I need to leave my home and community.
-
5. I have an evacuation plan for my child or children in case of a disaster (permission for day care or school to release my child to another adult).
-
6. I have copies of important documents like birth certificates and insurance policies in a safe place outside of my home.
-
7. I have emergency supplies in my home for my family such as enough extra water, food, and medicine to last for at least 7 days.
-
8. I have emergency supplies that I keep in my car, at work, or at home to take with me if I have to leave quickly.
Women are asked to “check no if it is not something you have done to prepare for a disaster or yes if it is.” 32
Data from the Hawaii birth certificate included maternal age, maternal education, marital status, urban or rural residence, maternal race, and participation in the Special Supplemental Nutrition Program for Women Infants and Children (WIC) during pregnancy. Age was collapsed into 5 categories: 19 years or less, 20 to 24 years, 25 to 29 years, 30 to 34 years, and 35 years or greater. Education was categorized as less than a high school diploma, high school diploma or equivalent, some college, and baccalaureate degree or higher. The urban or rural residence variable was established by county, and Maui was classified as rural according to the 2012 Census classification. Race was categorized by the racial categories specific to Hawaiian birth certificates: White, Native Hawaiian, Filipino, Japanese, Other Pacific Islander, and Other. Anyone selecting Native Hawaiian or part-Hawaiian was grouped into the Native Hawaiian race. Other Pacific Islander included those selecting the category, plus Samoans and Guamanians. All other races were categorized as “Other,” consistent with methods described by Sorenson et al. Reference Sorensen, Wood and Prince36
Information obtained from PRAMS included current health insurance at the time of survey, total income, and family size. Insurance status was categorized into 3 options: private, public, or none. Individuals who indicated having both private and public insurance were categorized as having private insurance. Military insurance was captured as a separate option on the survey and categorized as private for the analysis. Total income captured the reported household income 12 months prior to the birth, and family size was defined as the number of individuals living on the total income in the 12 months prior to the live birth. Family sizes of 5 or greater were collapsed into a single category. A variable categorizing income as a percent of the federal poverty level (FPL) was developed from total income and family size, compared to the January 2016 poverty guidelines for Hawaii issued by the Federal Register of the Department of Health and Human Services. 37 Four FPL groups are reported: less than or equal to 100%, 101-185%, 186-300%, and greater than 300% FPL, consistent with federal programming eligibility and the Hawaii PRAMS trends report. 37,38
Statistical Analysis
The sample is weighted to be representative of the state by accounting for sampling stratification, nonresponse, and noncoverage. The sample is stratified initially by county (Honolulu, Maui, Hawaii, and Kauai) and within Honolulu County, by birthweight. All reported percentages are weighted.
A factor analysis was performed to assess underlying factors among the 8 emergency preparedness behaviors. The data set was converted to a tetrachoric correlation matrix, and a factor analysis was performed using the maximum likelihood estimate and varimax rotation. The overall measure of sampling adequacy was 0.91, suggesting the factor analysis could be used for these data. Reference Kaiser39
The data analysis was performed in SAS-callable SUDAAN 11.0 (SAS v9.4) (RTI Int., Research Triangle Park, NC; SAS Inst., Cary, NC) to account for weighted data and complex survey methods. Multivariable logistic regression models were used to estimate predicted marginal prevalence ratios to assess characteristics of women associated with emergency preparedness behaviors. White was the referent category for race, otherwise the subcategory with the greatest proportion of women was used as the referent category. Variables included in the model were established a priori from existing literature and included age, education, marital status, urban or rural residence, race, insurance status, family size, FPL, and use of WIC during pregnancy.
Results
Study Characteristics
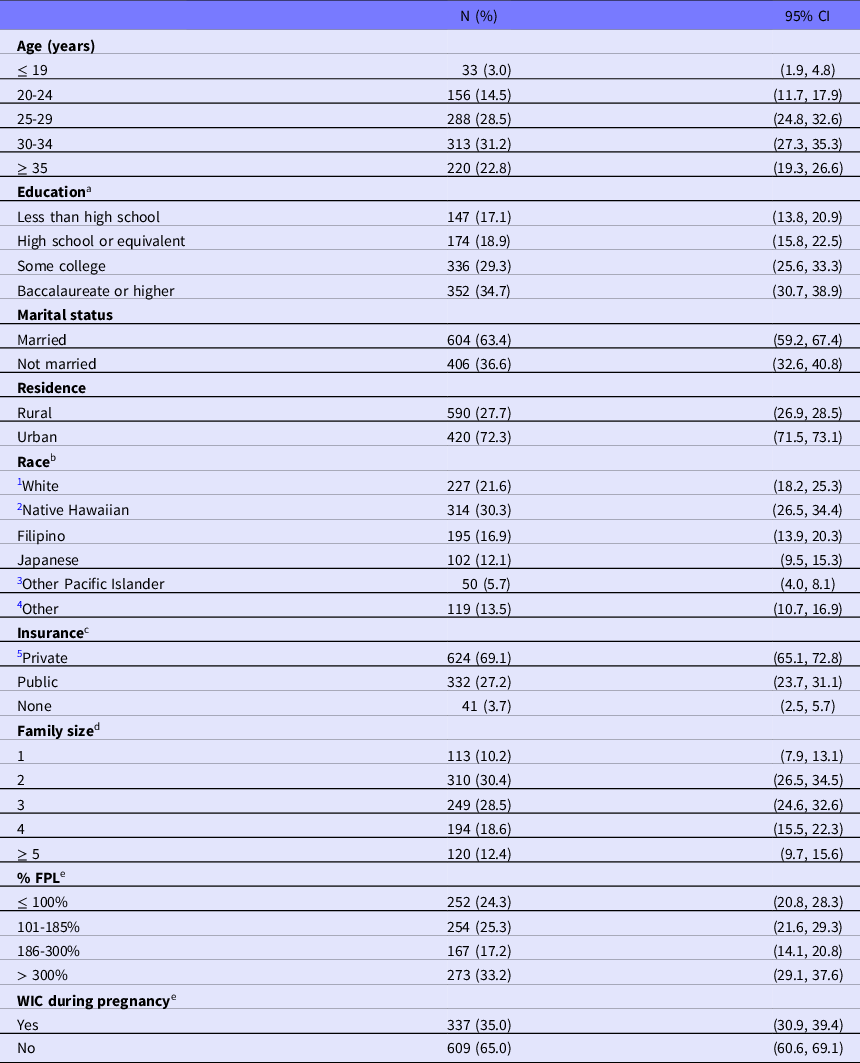
In 2016, 1999 women were contacted for PRAMS in Hawaii and 1076 responded (weighted response rate, 56.3%). The final sample for this analysis included 1010 women; 66 were excluded for not answering any of the emergency preparedness questions. Table 1 presents the demographic characteristics of the 1010 women included in this analysis.
Demographic characteristics of women with a recent live birth in Hawaii, 2016 Hawaii PRAMS (N = 1010)

Notes: Reported sample sizes are unweighted and reported percentages are weighted.
FPL, federal poverty level; PRAMS, Pregnancy Risk Assessment Monitoring System; and WIC, Special Supplemental Nutrition Program for Women, Infants, and Children.
a. N = 1009
b. N = 1007
c. N = 997
d. N = 986
e. N = 946
1. Includes Portuguese
2. Includes mixed race Native Hawaiians
3. Includes Samoan, Guamanian, and Other Pacific Islander
4. Includes American Indian, Alaska Native, Asian Indian, Black, Chinese, Cuban, Mexican, Mixed Race, other Asian, Puerto Rican, and other
5. Includes military health care
6. Family size describes number of individuals living on total income in the 12 months prior to the birth.
7. Percent FPL determined by reported household income and number of individuals living on that income 12 months prior to birth, compared to the January 2016 poverty guidelines for Hawaii issued by the Federal Register of the Department of Health and Human Services.
The largest proportion of respondents for each demographic characteristic were ages 30–34 (31.2%), had completed a baccalaureate degree or higher (34.7%), were married (63.4%), lived in an urban area (72.3%), were Native Hawaiian race (30.3%), had private insurance at the time of the survey (69.1%), including themselves had a family size of 2 (30.4%), had an income greater than 300% FPL (33.2%) in the 12 months before the birth, and did not use WIC during their pregnancy (65.0%).
Preparedness Behaviors
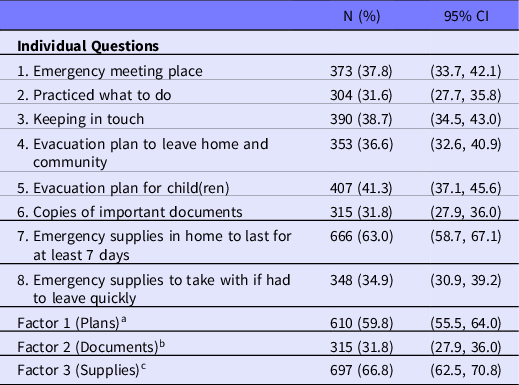
Among the 1010 women with a recent live birth, 79.3% (n = 826) reported at least 1 preparedness behavior, and 11.2% (n = 96) reported all 8. Having emergency supplies was the most commonly reported behavior with 63.0% (95% CI: 58.7-67.1%) of women having enough supplies at home for at least 7 days, followed by 41.3% (95% CI: 37.1-45.6%) having an evacuation plan for their child(ren). Less than 40% of women reported other preparedness behaviors: having an emergency meeting place (37.8%, 95% CI: 33.7-42.1%); practicing what to do in case of a disaster (31.6%, 95% CI: 27.7-35.8%); having a plan to keep in touch with family if separated (38.7%, 95% CI: 34.5-43.0%); having an evacuation plan to leave home (36.6%, 95% CI: 32.6-40.9%); having copies of important documents (31.8%, 95% CI: 27.9-36.0%); and having emergency supplies to take during an evacuation (34.9%, 95% CI: 30.9-39.2%) (Table 2).
Prevalence of disaster preparedness behaviors among women with a recent live birth in Hawaii, 2016 Hawaii PRAMS (N = 1010)

Notes: Reported sample sizes are unweighted and reported percentages are weighted.
a Answered yes to at least 1 behavior among: have an emergency meeting place, have practiced what to do in case of a disaster, have a plan for how family would keep in touch if separated, have an evacuation plan if she needed to leave her home and community, and have an evacuation plan for her child(ren) in case of disaster.
b Answered yes to having copies of important documents in a safe place outside of the home.
c Answered yes to having emergency supplies in the home for at least 7 days and/or having emergency supplies to take with if she had to leave quickly.
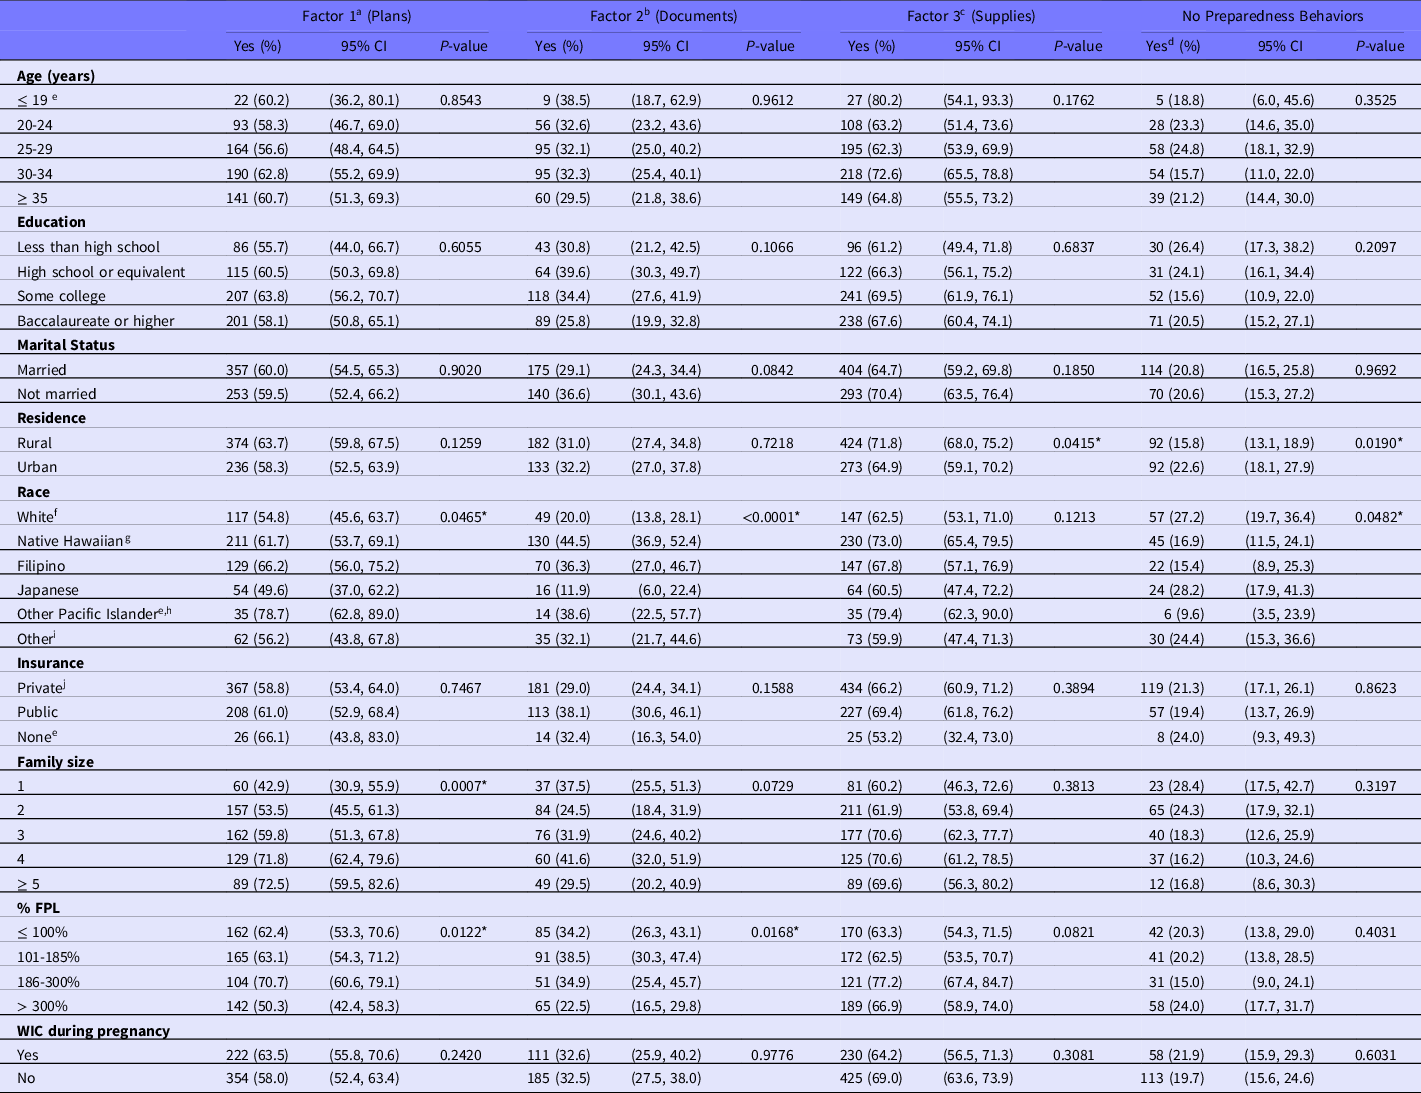
Among 20.7% (n = 184) of women reporting zero preparedness behaviors, significant differences were observed in urban or rural residence and race. Twenty-three percent of women living in an urban area and 16% of women living in a rural area reported zero preparedness behaviors (P = 0.019). Of the 6 races reported, Japanese women had the highest proportion reporting zero preparedness behaviors, whereas Other Pacific Islander women had the lowest proportion reporting zero preparedness behaviors. Reporting of zero preparedness behaviors did not vary by education, marital status, insurance, family size, FPL, or WIC participation (Table 3).
Women with a recent live birth in Hawaii with emergency preparedness behaviors by demographic category, 2016 Hawaii PRAMS

Notes: Reported sample sizes are unweighted and reported percentages are weighted. Percentages describe women in category subgroup (from Table 1) having preparedness factor.
FPL, federal poverty level; PRAMS, Pregnancy Risk Assessment Monitoring System; and WIC, Special Supplemental Nutrition Program for Women, Infants, and Children.
a Answered yes to at least 1 behavior among: have an emergency meeting place, have practiced what to do in case of a disaster, have a plan for how family would keep in touch if separated, have an evacuation plan if she needed to leave her home and community, and have an evacuation plan for her child(ren) in case of disaster.
b Answered yes to having copies of important documents in a safe place outside of the home.
c Answered yes to having emergency supplies in the home for at least 7 days and/or having emergency supplies to take with if she had to leave quickly.
d Women reporting no preparedness behaviors
e Subgroup contains 30-59 respondents, results should be interpreted with caution
f Includes Portuguese
g Includes mixed race Native Hawaiians
h Includes Samoan, Guamanian, and Other Pacific Islander
i Includes American Indian, Alaska Native, Asian Indian, Black, Chinese, Cuban, Mexican, Mixed Race, other Asian, Puerto Rican, and other
j Includes military health care
* Significant at alpha = 0.05 for Wald chi-square test
We assessed factor loading plots and determined the 8 preparedness behaviors could be described by 3 factors (Supplemental Figures 1–3). The first factor, having emergency plans, captured women that responded yes to at least 1 of the behaviors: emergency meeting place, practiced what to do, plan to keep in touch, plan for themselves to evacuate, or an evacuation plan for their child(ren). The second factor included women who responded yes to having copies of important documents, and the third factor included women who had emergency supplies for at least 7 days and/or had emergency supplies prepared if they had to leave quickly.
Within the sample, 59.8% (95% CI: 55.5-64.0%) of women had emergency plans; 31.8% (95% CI: 27.9-36.0%) had copies of important documents; and 66.8% (95% CI: 62.5-70.8%) had emergency supplies (see Table 2). Having emergency plans varied by race; among Other Pacific Islander women, 78.7% (95% CI: 62.8-89.0%) reported an emergency planning behavior compared to 49.6% (95% CI: 37.0-62.2%) of Japanese women. Emergency planning also varied by family size and percent of the FPL. More than 70% of women with a family size of 4 or greater reported having emergency plans, whereas 53.5% (95% CI: 45.5-61.3%) of women with a family size of 2 reported these behaviors. Among women with an income of 186-300% FPL, 70.7% (95% CI: 60.6-79.1%) reported having emergency plans, whereas 50.3% (95% CI: 42.4-58.3%) of women with an income more than 300% FPL reported emergency planning behaviors. Demographic characteristics among women reporting having copies of important documents varied significantly by race and FPL. Having copies of important documents was most commonly reported among Native Hawaiians (44.5%, 95% CI: 36.9-52.4%). In contrast, 11.9% (95% CI: 6.0-22.4%) of Japanese women reported having copies of important documents. A greater percent of women living at 101-185% FPL (38.5%, 95% CI: 30.3-47.4%) had copies of important documents compared to 22.5% (95% CI: 16.5-29.8%) of women living at more than 300% FPL. Reporting of emergency supplies varied by urban or rural residence. More than 71% (95% CI: 68.0-75.2%) of women living in a rural residence and 64.9% (95% CI: 59.1-70.2%) of women living in an urban residence had emergency supplies (see Table 3).
Models
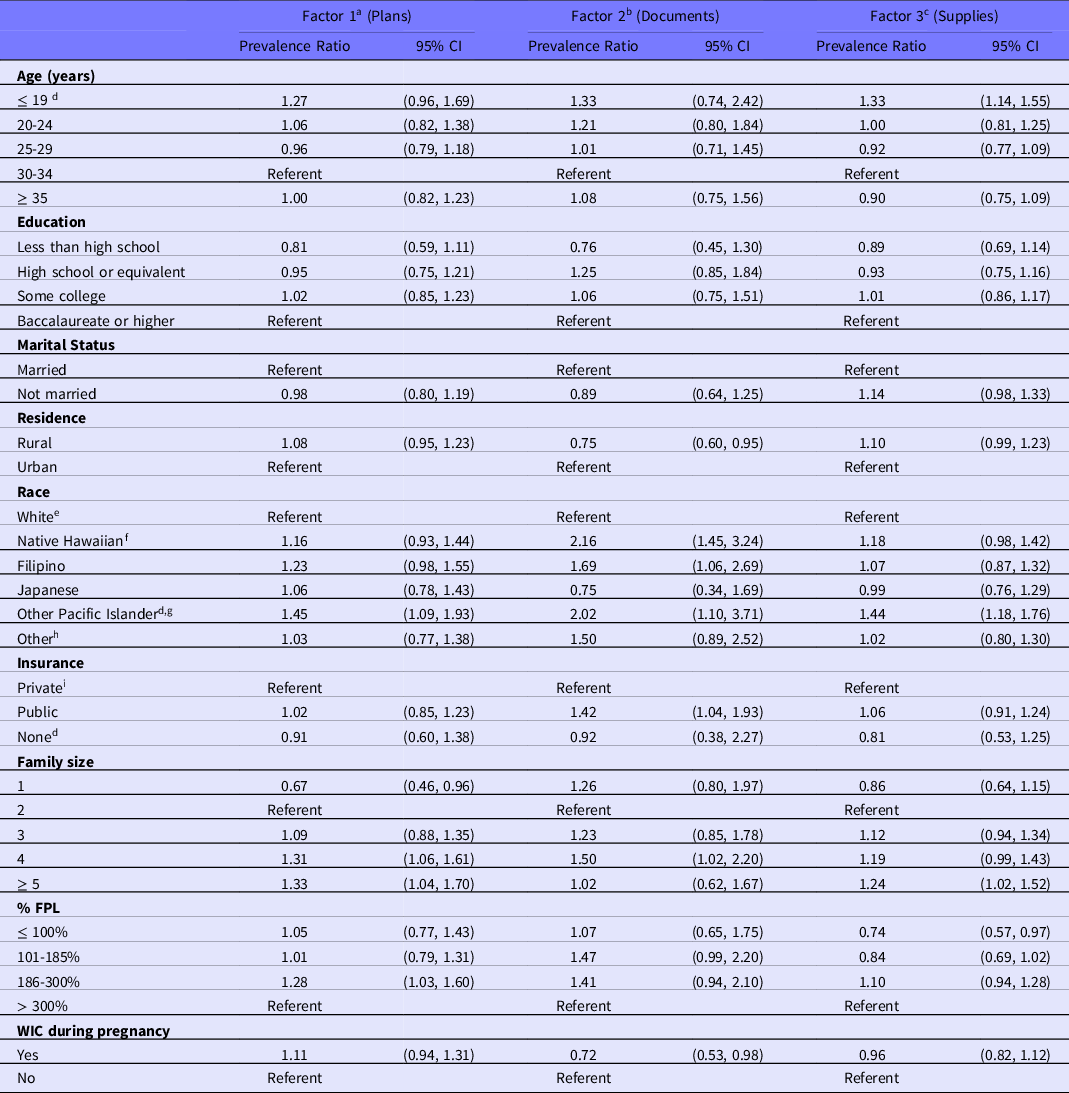
The results of the multivariable analysis are presented in Table 4. Results from women 19 years old and younger, Other Pacific Islander, and those with no insurance at the time of survey, should be interpreted with caution as their sample size was small (30-59 respondents). Education and marital status were not associated with any preparedness factors. The prevalence of completing at least 1 planning emergency preparedness behavior differed significantly by race, family size, and poverty level. Other Pacific Islander women were 45% more likely to report having emergency plans compared to White women (adjusted prevalence ratio [aPR] 1.45, 95% CI: 1.09-1.93). Women with a family size of 1 were 33% (aPR 0.67, 95% CI: 0.46-0.96) less likely to report having emergency plans compared to women with a family size of 2. In contrast, having emergency plans is more common among women with a family size of 4 (aPR 1.31, 95% CI: 1.06-1.61) and 5 or more (aPR 1.33, 95% CI: 1.04-1.70) compared to those with a family size of 2. Compared to women with an income above 300% FPL, those with an income between 186 and 300% FPL were 28% (aPR 1.28, 95% CI: 1.03-1.60) more likely to have emergency plans.
Multivariable logistic regression of the characteristics of women with a recent live birth and presence of emergency preparedness behavior factors, 2016 Hawaii PRAMS

Notes: Reported prevalence ratios are adjusted for all variables included in models.
FPL, federal poverty level; PRAMS, Pregnancy Risk Assessment Monitoring System; and WIC, Special Supplemental Nutrition Program for Women, Infants, and Children.
a Answered yes to at least 1 behavior among: have an emergency meeting place, have practiced what to do in case of a disaster, have a plan for how family would keep in touch if separated, have an evacuation plan if she needed to leave her home and community, and have an evacuation plan for her child(ren) in case of disaster.
b Answered yes to having copies of important documents in a safe place outside of the home.
c Answered yes to having emergency supplies in the home for at least 7 days and/or having emergency supplies to take with if she had to leave quickly.
d Subgroup contains 30-59 respondents, results should be interpreted with caution
e Includes Portuguese
f Includes mixed race Native Hawaiians
g Includes Samoan, Guamanian, and Other Pacific Islander
h Includes American Indian, Alaska Native, Asian Indian, Black, Chinese, Cuban, Mexican, Mixed Race, other Asian, Puerto Rican, and other
i Includes military health care
Having copies of important documents significantly differed in the adjusted models by residence, race, insurance status, family size, and WIC participation. This behavior was less common among women living in a rural residence compared to women living in an urban residence (aPR 0.75, 95% CI: 0.60-0.95), and among women who used WIC during pregnancy compared to those who did not (aPR 0.72, 95% CI: 0.53-0.98). Native Hawaiian (aPR 2.16, 95% CI: 1.45-3.24), Filipino (aPR 1.69, 95% CI: 1.06-2.69), and Other Pacific Islander women (aPR 2.02, 95% CI: 1.10-3.71) were more likely than White women to have copies of important documents. Additionally, having copies of important documents was more common among women with public insurance compared to women with private insurance (aPR 1.42, 95% CI: 1.04-1.93), and among women with a family size of 4 compared to women with a family size of 2 (aPR 1.50, 95% CI: 1.02-2.20).
Significant differences were noted by age, race, family size, and FPL in the adjusted model for emergency supplies. Women 19 years old and younger were 33% more likely to have emergency supplies compared with women 30–34 years old (aPR 1.33, 95% CI: 1.14-1.55). Having emergency supplies was also more likely among Other Pacific Islander women compared to White women (aPR 1.44, 95% CI: 1.18-1.76), and women with a family size of 5 or more, compared to those with a family size of 2 (aPR 1.24, 95% CI: 1.02-1.52). Women with an income at or less than 100% FPL were 26% (aPR 0.74, 95% CI: 0.57-0.97) less likely to have emergency supplies compared to women with an income of more than 300% FPL.
Discussion
Analysis of the 2016 Hawaii PRAMS data shows that the 8 preparedness behaviors can be generalized into 3 factors: having emergency plans, having copies of important documents, and having emergency supplies. About 80% of women participated in at least 1 preparedness behavior, and each behavior displayed at least 30% participation.
In this study, race and family size were associated with all 3 emergency preparedness behavior factors in the adjusted models. Race and ethnicity have previously been shown to be important predictors of preparedness, although no consensus exists between the direction of association of race and preparedness in current literature. Reference Zilversmit, Sappenfield, Zotti and McGehee25,Reference DeBastiani, Strine and Vagi40–Reference Bethel, Burke and Britt44 An assessment of the 2006-2010 Behavioral Risk Factor Surveillance System general preparedness module found that black and Hispanic respondents were more likely to have a 3-day supply of water and an evacuation plan prepared compared to White respondents; however, White respondents were more likely to have a 3-day supply of food, battery-operated radio, and medication. Reference Bethel, Burke and Britt44 Among a nationally representative sample of households in the United States completing an online survey to assess predictors of disaster preparedness and compliance, the authors found that non-White individuals were more likely to have emergency plans. Reference Murphy, Cody and Frank42 In our analysis, Other Pacific Islander women reported higher participation in all 3 factors than White women. Although the sample size of Other Pacific Islander women was small, PRAMS methodology is designed to be representative of the state. Other Pacific Islanders are a minority group in the United States; however, many reside within Hawaii, making Hawaii an ideal state to assess behaviors among Other Pacific Islander women with a recent live birth. 45
Family size was significantly associated with each factor in multivariable analyses. A family size of 1 was associated with a lower likelihood of having emergency plans compared to a family size of 2. Compared to women with a family size of 2, family sizes of 4 or more were associated with increased likelihood of having emergency plans, a family size of 4 was associated with a higher likelihood of having copies of important documents, and a family size of 5 or more was associated with a higher likelihood of having emergency supplies. A study by Zilversmit et al. Reference Zilversmit, Sappenfield, Zotti and McGehee25 observed that families with 5 or more members were 30% more likely to have an emergency plan compared to families of 1 to 4 members when assessing the presence of an emergency plan among postpartum women in Arkansas. A focus group discussing household emergency preparedness among homeowners found children in the home promote preparedness for 2 reasons: it is a way for parents to protect their children, and preparedness is a result of increased involvement in community activities that prompt preparedness behaviors. Reference Diekman, Kearney, O’Neil and Mack43
In this study, FPL was assessed because it provides information about family-level income. The scale used in this study is consistent with government programming cutoffs and prior Hawaii PRAMS reports. Women with an income at or below 100% FPL were less likely to have emergency supplies compared to women with an income greater than 300% FPL, but there were no differences between these groups for emergency plans or copies of important documents. Women with an income 186–300% FPL were more likely to have emergency plans than women with an income greater than 300% FPL. Data from the 2016 Styles survey suggest among adults in the United States, cost is a barrier to emergency preparedness, while discounts to buy preparedness supplies are noted as a motivator for emergency preparedness. Reference Kruger, Chen and Heitfeld46 For a household with limited means, buying surplus supplies in case of an emergency may be economically burdensome.
The second factor, having copies of important documents, was associated with residence, current insurance status, and participation in WIC. Women living in rural areas of Hawaii were less likely to report having copies of important documents in a safe location outside of the home compared to women with an urban residence. A rural area may have fewer options for safe storage of important documents outside of the home. Having copies of important documents was 42% more likely among women with public insurance, compared to women with private insurance. Use of WIC was associated with a lower prevalence of having copies of important documents, compared to those not using WIC. Participation in WIC during pregnancy requires a woman to be classified as having a nutritional risk by a health professional, and have an income at or below 185% FPL. 47 However, in this study, FPL was not a significant predictor of having copies of important documents.
Younger age was significantly associated with having emergency supplies. Women less than 19 years old were 33% more likely to have supplies for an emergency compared to women aged 30–34. In contrast, a study among Florida residents identified those ages 40–70 were more prepared than other respondents. Reference Baker41
Limitations
Results from our study show some consistency with other preparedness reports, although limited literature on disaster preparedness among postpartum women is available. Our study identified minimal demographic differences with preparedness behaviors among women with a recent live birth in Hawaii, suggesting disaster preparedness interventions should target all pregnant and postpartum women. Among mailed surveys, shorter questionnaires are associated with higher response rates. Reference Edwards, Roberts and Clarke48,Reference Yammarino, Skinner and Childers49 Therefore, reducing this 8-part preparedness question to 3 parts identified through factor analysis may be feasible. This study is limited by self-reported data so misclassification and reporting bias may be present. Furthermore, dichotomous answer options do not capture levels of preparedness nor specify a time frame to consider when responding. For example, a woman may respond that she and her family have practiced what to do in case of a disaster; however, the access and functional needs of the family may have changed since they last practiced what to do, and new hazards may need to be considered. Additionally, this 8-part preparedness question only captures if the respondent has a plan. It is unknown whether these plans are known by other family members, including children. This analysis is limited as Hawaii PRAMS does not collect information on social support and nontangible resources; however, these have been described as a strong predictor of preparedness. Reference Ehrlich, Harville and Xiong16,Reference Giarratano, Barcelona, Savage and Harville17,Reference Murphy, Cody and Frank42,Reference Kim, Pant and Yamashita50,Reference Levac and Toal-Sullivan51
Conclusion
This study provides a measure of emergency preparedness among women with a recent live birth in Hawaii and is the first to describe a methodology to analyze the 8-part PRAMS emergency preparedness question. If other states observe similar factor analysis results of these 8 preparedness behaviors, this PRAMS question could be reformatted to 3 parts, capturing general trends in preparedness behaviors. Fewer questions may increase the use of this question by jurisdictions, and participant response rates may improve. Additionally, these results can inform Hawaii’s efforts to increasing disaster preparedness among postpartum women and families in Hawaii. Furthermore, tracking the prevalence of preparedness behaviors measured in this PRAMS question over time will allow the state of Hawaii to measure the effect of interventions to increase preparedness.
Supplementary material
To view supplementary material for this article, please visit https://doi.org/10.1017/dmp.2021.274
Data Availability Statement
Data are available through request at: https://www.cdc.gov/prams/prams-data/researchers.htm. SAS-callable SUDAAN code is available upon request.
Author Contributions
All authors have reviewed, contributed significantly to, and approved the manuscript.
Funding Statement
CDC provides annual funding to participating PRAMS sites through a cooperative agreement.
Conflict(s) of Interest
The authors declared no potential conflicts of interest with respect to the research, authorship, and/or publication of this paper.
Ethical Standards
Human Subject Research #2233.
Disclaimer
The findings and conclusions in this report are those of the authors and do not necessarily represent the official position of the Centers for Disease Control and Prevention. All survey respondents provided verbal consent via phone or implied consent by returning a completed questionnaire. All authors have consented for publication.