


Introduction
Over the last ten years, our team systematically investigated the mineralogy of the actively operated Murzinskoe gold deposit located in the Krasnoshchyokovskiy District of the Altai Krai in Western Siberia, Russia (51°35’44’’ N, 82°36’34’’ E). During this period, more than 250 mineral species were identified by instrumental methods including more than 150 minerals of supergene origin (various sulfides, oxides, carbonates, nitrates, sulfates, chromates, arsenates, phosphates, vanadates and silicates). Alunite supergroup minerals are distributed widely here. As known, the alunite supergroup comprises trigonal sulfates, phosphates, and arsenates with the general formula DG 3(TO4)2(OH)6, where the D site can be populated by large cations (K+, Na+, Tl+, Ag+, NH4+, H3O+, Ca2+, Sr2+, Ba2+, Pb2+, REE 3+, Bi3+, Th4+), H2O molecules, or vacancies; G are octahedrally coordinated intermediate field strength cations (Al3+, Fe3+, V3+, Ga3+, Cu2+, Zn2+); and T are tetrahedrally coordinated S6+, P5+, As5+ (Bayliss et al., Reference Bayliss, Kolitsch, Nickel and Pring2010; Pekov et al., Reference Pekov, Lykova, Chukanov, Kabalov and Zyryanova2012). In 2024, the alunite supergroup was supplemented by two members with hereto unknown species defining cations: the first one is karlseifertite, Pb(Ga2Ge)(AsO4)2(OH)6 with octahedrally coordinated Ge4+ (Kampf et al., Reference Kampf, Désor and Ma2024) and the second one is stibiosegnitite with octahedrally coordinated Sb5+. A detailed description of the latter mineral is given in this paper.
Initially we identified ten alunite supergroup members in the oxidized ores of the Murzinskoe deposit: beaverite-(Cu), beudantite, corkite, florencite-(Ce), hinsdalite, hidalgoite, kintoreite, philipsbornite, plumbogummite and segnitite. However, chemical analyses of the latter, one of the most abundant arsenates at the deposit, revealed a significant amount of Sb in some of the samples. X-ray diffraction data did not suggest any intergrowth between segnitite and a Sb-rich phase (e.g. a member of the roméite group). On the other hand, previous studies reported that Sb can be incorporated in the structures of some alunite-supergroup minerals such as dussertite (Kolitsch et al., Reference Kolitsch, Slade, Tiekink and Pring1999) and segnitite (Mills et al., Reference Mills, Etschmann, Kampf, Poirier and Newville2014; Pekov et al., Reference Pekov, Khanin, Yapaskurt, Pakunova and Ekimenkova2015) and that all, or almost all, Sb has an oxidation state of 5+ and occupies octahedral, rather than tetrahedral sites. Detailed examination of segnitite from the Murzinskoe gold deposit using X-ray photoelectronic spectroscopy (XPS) and single-crystal X-ray diffraction (SCXRD) analysis confirmed the early conclusions of colleagues, showing unambiguously the pentavalent state of Sb and its incorporation into the octahedral sites with partial substitution of trivalent and divalent cations (e.g. Fe3+, Al, Cu and Zn).
Considering the nomenclature of the alunite supergroup (Bayliss et al., Reference Bayliss, Kolitsch, Nickel and Pring2010) and the application of the dominant-valency rules to complex mineral compositions (Bosi et al., Reference Bosi, Hatert, Hålenius, Pasero, Miyawaki and Mills2019a), we submitted a proposal (IMA 2024-065) for the new mineral species with the ideal formula Pb(Fe3+2.5Sb5+0.5)(AsO4)2(OH)6 that was approved by the Commission on New Minerals, Nomenclature and Classification of the International Mineralogical Association (IMA-CNMNC) in early December, 2024 along with its name stibiosegnitite and symbol Ssgt (Kasatkin et al., Reference Kasatkin, Zubkova, Škoda, Chukanov, Nestola, Gurzhiy, Agakhanov, Belakovskiy and Lednev2025). The name of the mineral reflects its close relationship with segnitite from which it can be obtained via the coupled heterovalent substitution Fe3+0.5 + (AsO3OH)2– → Sb5+0.5 + (AsO4)3–. The holotype specimen is deposited in the systematic collection of the Fersman Mineralogical Museum of the Russian Academy of Sciences, Moscow, with the catalogue number 98807.
Occurrence and mineral assemblage
The Murzinskoe deposit was discovered in 1740 and was from time-to-time mined for copper, gold and silver in 1740–1850, 1910–1914 and 1935–1950 (Gusev, Reference Gusev2014). In the middle of the 20th century, the workings ceased due to unprofitability and the deposit was mothballed. In 1987 the geological exploration resumed. Since 1993, the deposit has been mined for gold by the prospector company ‘Poisk’ as an open pit.
Geologically, the Murzinskoe deposit is confined to the Main Fault of the Akimovskaya zone, along which Lower Devonian sandstones, siltstones and limestones, Lower Silurian terrigenous beds and Middle Devonian rhyolites, dacites and andesites come into contact. A rubbly ochreous argillaceous weathering crust, which dates back to the Cretaceous–Palaeogene, runs along the fault. The formation of the deposit took place in three main stages: (1) formation of skarns; (2) formation of hydrothermal quartz veins; (3) formation of a supergene zone (weathering crust and oxidation zone). The main rocks of the deposit are garnet-diopside and garnet-epidote skarns, as well as epidosites forming lenticular bodies. Skarns and epidosites are intersected by quartz veins with ore mineralization (chalcopyrite, sphalerite, pyrite, arsenopyrite, galena, minerals of the tetrahedrite group, chalcocite, covellite, gold etc.). The oxidation zone is well developed; its depth reaches 130 m. Main minerals here are chrysocolla, malachite, azurite and goethite. More detailed geological information about the deposit can be found elsewhere (Babich et al., Reference Babich, Zadorozhnyi, Gas’kov, Akimtsev and Naumov2006; Gas’kov et al., Reference Gas’kov, Borisenko, Babich and Naumov2010; Murzin et al., Reference Murzin, Alyamkin and Ivanov2015; Gusev and Tabakaeva, Reference Gusev and Tabakaeva2017; Gusev and Gusev, Reference Gusev and Gusev2018; Kasatkin et al., Reference Kasatkin, Zubkova, Gurzhiy, Škoda, Nestola, Agakhanov, Chukanov, Belakovskiy and Všianský2024a, Reference Kasatkin, Lednev and Milshina2024b).
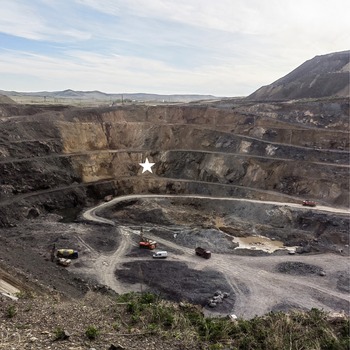
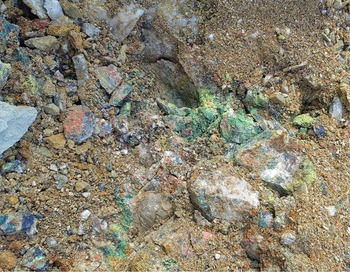
The first specimens of stibiosegnitite, including the holotype sample, have been found in March 2024 in the Phosphatno-Arsenatnaya vein, at the 245 m level of the Southern area of the open pit operated at the Murzinskoe gold deposit (Fig. 1). This quartz-sulfide vein was first examined mineralogically in December 2023 by one of the authors (V.S.L.) and revealed a very rich mineralization of various supergene minerals. Most of them are phosphates and arsenates occurring as components of abundant multicoloured microcrystalline crusts covering areas of several dozen cm2 on quartz matrix which led us to call this vein ‘Phosphatno-Arsenatnaya’ (Fig. 2). The vein is located in the SW part of the Southern open pit of the deposit. It is hosted by red clays and intensely foliated mudstones and dips vertically (80°) to the west from 249 m to 230 m a.s.l. The vein is 20 m long and the thickness of its productive part bearing supergene mineralization varies from 1 to 8 m. The detailed description of the Phosphatno-Arsenatnaya vein, its geological features and, especially, mineralogy is reported by Kasatkin et al. (Reference Kasatkin, Lednev and Milshina2024b). Additional specimens of stibiosegnitite were collected in September–November 2024 below the Phosphatno-Arsenatnaya vein, i.e. at 218 m and 205 m levels of the same open pit.
Open pit of the Murzinskoe gold deposit, southern area. The location of the Phosphatno-Arsenatnaya vein is marked by a white star. April 2024. Photo by Vladimir S. Lednev.

Figure 1 Long description
The image shows an open pit mine with terraced layers. Several vehicles are visible on the lower levels. A white star marks the location of the vein within the pit. The surrounding landscape includes hills and a cloudy sky.
Multicoloured crusts of supergene minerals at the Phosphatno-Arsenatnaya vein in situ. Field of view 1 × 1 m. March 2024. Photo by Vladimir S. Lednev.

Figure 2 Long description
The image shows rocky ground with loose, granular soil and scattered stones. Several rock surfaces have crusty mineral deposits in irregular patches. One patch is green and other patches are white. Small fragments and pebbles are spread across the frame, with larger rock pieces clustered near the left side and across the centre.
At the Phosphatno-Arsenatnaya vein stibiosegnitite is associated with numerous supergene minerals, namely azurite, bayldonite, beudantite, bismutite, chalcocite, covellite, gartrellite, goethite, iodargyrite, kintoreite, malachite, phosphohedyphane, pseudomalachite and segnitite. Primary minerals include quartz, arsenopyrite, bismuth, chalcopyrite, galena, gold, tennantite-(Fe) and tennantite-(Zn). At the lower levels of the deposit stibiosegnitite is associated with azurite, chrysocolla, malachite and quartz (represented by both veiny and supergene generations).
Stibiosegnitite is the second new mineral discovered at the Murzinskoe deposit after lednevite, Cu[PO3(OH)]·H2O (Kasatkin et al., Reference Kasatkin, Zubkova, Gurzhiy, Škoda, Nestola, Agakhanov, Chukanov, Belakovskiy and Všianský2024a).
General appearance, physical properties and optical data
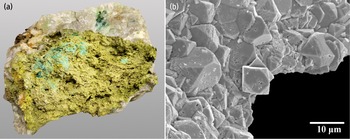
In the holotype specimen, stibiosegnitite forms pseudo-cuboctahedral crystals (which most likely represents a combination of two rhombohedra and a basal pinacoid) up to 0.02 mm grouped in compact aggregates forming thick crust 8 × 6 cm in area on quartz-limonite matrix in association with malachite and pseudomalachite (Fig. 3a,b). In other specimens stibiosegnitite forms spherulites up to 1 mm, rhombohedral crystals up to 0.8 mm and crusts up to 2 mm thick of various colours covering areas up to 10 cm2 on quartz-limonite matrix.
(a) Stibiosegnitite aggregates (olive-green) on quartz with pseudomalachite (bluish-green on stibiosegnitite) and malachite (green on quartz). Holotype sample. 8 × 8 × 6 cm. Photo by Maria D. Milshina. (b) Crust of stibiosegnitite pseudo-cuboctahedral crystals; fragment of holotype sample. Scanning electron microscopy image, SE mode.

Figure 3 Long description
Image A shows an irregular rock fragment of yellow green stibiosegnitite on white quartz. Small patches of pseudomalachite and malachite are visible. The image B is a greyscale SEM image of a crust of stibiosegnitite. The crystals are pseudo-cuboctahedral and tightly packed. Each crystal is between 10-20 microns wide.
The most common colour of stibiosegnitite (including the holotype) is olive-green, greenish-yellow is less common while orange and brown colours are rare. The new mineral has a greenish-yellow streak. It is brittle, cleavage is distinct on {001} and the fracture is uneven. Its crystals are transparent with adamantine lustre while aggregates are translucent and dull earthy. No fluorescence is observed under ultraviolet light. Mohs’ hardness is ∼4 based on scratch tests. The density of stibiosegnitite could not be measured due to the absence of suitable heavy liquids. A density value calculated using the empirical formula and unit-cell volume obtained from the SCXRD data is 4.760 g·cm–3.
In transmitted plane-polarized light stibiosegnitite is uniaxial (–) and nonpleochroic, with ω = 1.935(10) and ε = 1.920(10).
The Gladstone-Dale compatibility index (Mandarino, Reference Mandarino1981) is 0.015 (superior) using the empirical formula and the unit-cell parameters determined from the SCXRD data.
Spectroscopic data
Infrared spectroscopy
In order to obtain infrared (IR) absorption spectra of stibiosegnitite and Sb-free segnitite from Kamariza Mine, Greece (for comparison), powdered samples were mixed with KBr pre-dried at 120°C, formed into a transparent pellet by pressurizing the mix at 10 tons in a hydraulic jack for 3 min, and analysed using an ALPHA FTIR spectrometer (Bruker Optics) with a resolution of 4 cm–1. A total of 16 scans were obtained for each spectrum. The IR spectrum of a pellet of pure KBr was used as a reference blank.
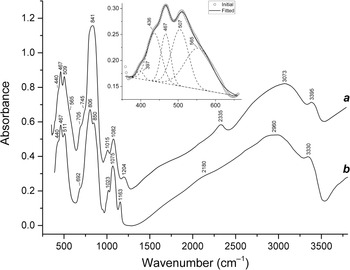
The IR spectrum of stibiosegnitite (curve ‘a’ in Fig. 4) contains distinct bands in the ranges of O–H stretching vibrations (2300–3400 cm–1), asymmetric stretching vibrations of admixed distorted PO43– anions, F 2(ν3) mode (1010–1210 cm–1), As–O stretching vibrations partly involving the Sb–O bond (∼840 cm–1) as well as overlapping bands of Fe3+–O stretching and O–P–O bending vibrations and mixed resonance modes (Fe3+–O stretching + O–As–O bending) (400–600 cm–1). The band assignment was made using data from Farmer (Reference Farmer1974), Nakamoto (Reference Nakamoto2008, Reference Nakamoto2009) and Chukanov and Chervonnyi (Reference Chukanov and Chervonnyi2016).
Powder infrared spectra of (a) stibiosegnitite and (b) Sb-free segnitite with the empirical formula (Pb0.85Na0.11K0.01)(Fe2.42Zn0.26Mg0.24Al0.05Cu0.01)(AsO4)2.00(OH,H2O)6 from association with arseniosiderite at the Kamariza mine, Lavrion mining district, Attikí Prefecture, Greece drawn using data by Chukanov et al. (Reference Chukanov2014); the mineral identification was confirmed by powder X-ray diffraction (personal communication by I.V. Pekov). The inset shows the convolution of the IR spectrum of stibiosegnitite in the low-frequency region.

Figure 4 Long description
Powder infrared spectra of (a) stibiosegnitite and (b) Sb-free segnitite. A line plot shows two spectra labelled a and b. The x-axis is labelled Wavenumber (cm superscript minus 1). The y-axis is labelled Absorbance. The x-axis shows labelled ticks at 500, 1000, 1500, 2000, 2500, 3000 and 3500. The y-axis shows labelled ticks at 0.0, 0.2, 0.4, 0.6, 0.8, 1.0 and 1.2. An inset plot shows a zoomed low-wavenumber region with multiple overlaid curves and a legend with two entries labeled “Initial” and “Fitted”. The peaks are described and assigned in the text.
The assignment of other bands can be made based on the comparison of the IR spectra of stibiosegnitite and Sb-free segnitite (curve ‘b’ in Fig. 4). Taking into account a high force strength of the Sb–O bond, the absorbance maximum at 841 cm–1 may correspond to As–O stretching vibrations of the fragment As–O–Sb. This absorbance maximum is absent in the IR spectrum of Sb-free segnitite. The shoulders at 692–705 and 745 cm–1 are tentatively assigned to the Fe3+–O–H and Sb–O–H bending modes.
There is only one OH– site in the structure of stibiosegnitite. Thus, overlapping bands in the range 2400–3400 cm–1 can be ascribed to O–H stretching vibrations in different local situations involving the Fe3+–OH and Sb–OH fragments. The band at 2335 cm–1 is typical for acid arsenates and indicates the possibility of the dynamic equilibrium Sb–OH+δ + AsO43– ↔ Sb–O + HAsO42–. This phenomenon is common for basic arsenates and phosphates of transitional elements (Chukanov and Chervonnyi, Reference Chukanov and Chervonnyi2016). Protonation is possible for the free O1 vertex of the AsO4 tetrahedron which is the acceptor of the hydrogen bond O3–H3···O1 (see below).
Raman spectroscopy
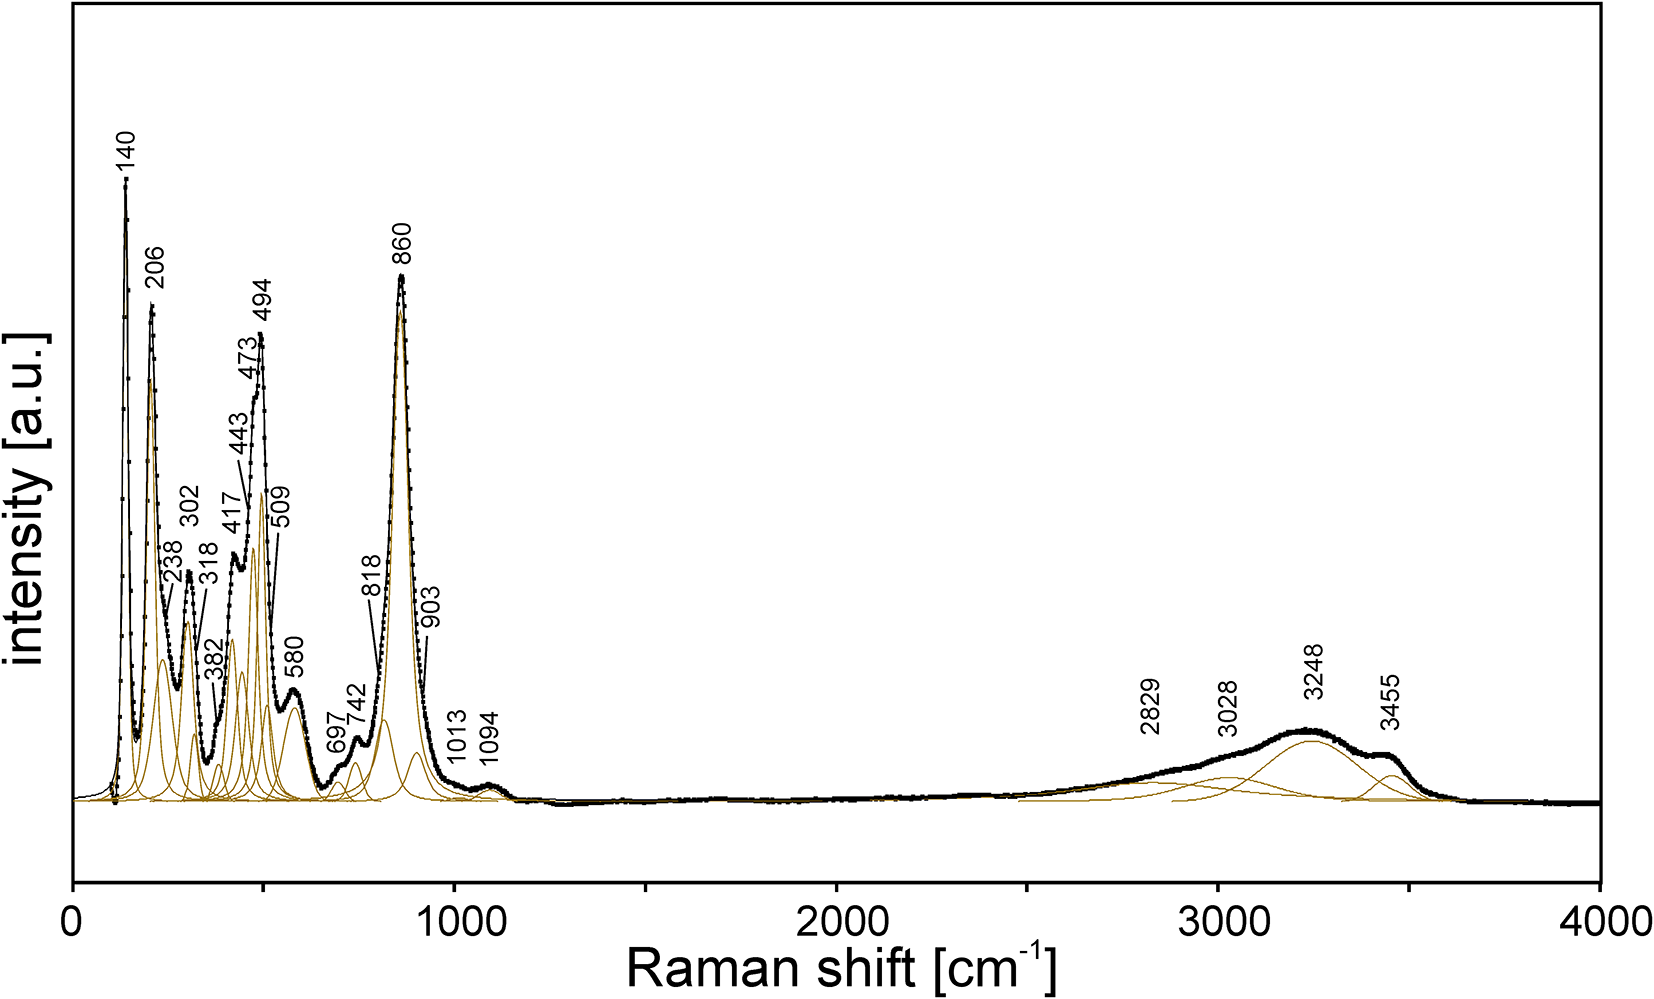
The Raman spectrum of stibiosegnitite (Fig. 5) was obtained by means of a Horiba Labram HR Evolution spectrometer. This dispersive, edge-filter-based system is equipped with an Olympus BX 41 optical microscope, a diffraction grating with 600 grooves per millimetre, and a Peltier-cooled, Si-based charge-coupled device (CCD) detector. The Raman signal was excited by a 532 nm laser. The laser beam energy of 42 mW was attenuated to 10% using a neutral density filter. The Raman signal was collected in the range of 50–4000 cm–1 with a 100× objective and the system being operated in confocal mode, beam diameter was ∼0.9 μm and the axial resolution ∼3 μm. Time acquisition was 60 s per spectral window, 5 accumulations and 7 spectral windows were applied to cover the 100–4000 cm–1 range. Under these conditions, no thermally induced damage of the analysed area was observed after the measurement. Wavenumber calibration was done using the Rayleigh line and low-pressure Ne-lamp emissions. The wavenumber accuracy was ∼0.5 cm–1, and the spectral resolution was ∼2 cm–1. Band fitting was done after appropriate background correction, assuming combined Lorentzian-Gaussian band shapes using Voigt function (PeakFit; Jandel Scientific Software).
The Raman spectra of stibiosegnitite excited by 532 nm laser in the 100–4000 cm–1 region. The measured spectrum is shown by dots. The curve matched to dots is a result of spectral fit as a sum of individual Voigt peaks shown below the curve.

Figure 5 Long description
The Raman spectrum of stibiosegnitite is displayed with intensity in arbitrary units on the y-axis and Raman shift in cm⁻¹ on the x-axis, ranging from 0 to 4000 cm⁻¹. Many sharp peaks are visible below 1200 cm⁻¹. A broad band is observed between 3000 and 3500 cm⁻¹¹. The measured spectrum is shown by dots and the curve matched to dots is a result of spectral fit as a sum of individual Voigt peaks. The peaks are assigned and discussed in the text.
There is a good agreement between the IR and Raman spectra of stibiosegnitite. The assignment of the Raman bands is as follows.
Bands in the ranges 2800–3500, 1000–1100 and 810–910 cm–1 correspond to O–H, asymmetric P–O stretching and symmetric As–O stretching modes, respectively. The bands at 697 and 742 cm–1 may be due to the Fe3+–O–H and Sb–O–H bending modes. Numerous overlapping bands in the range 380–600 cm–1 correspond to Fe3+–O stretching and O–P–O bending vibrations and mixed resonance modes (Fe3+–O stretching + O–As–O bending). Bands below 320 cm–1 are assigned to lattice modes involving translations and rotations of the AsO43– and PO43– tetrahedra.
Unlike the Raman spectrum of segnitite (Frost et al., Reference Frost, Weier, Martens and Mills2005), the Raman spectrum of stibiosegnitite does not contain the band 848 cm–1 assigned by the authors of the cited paper to the asymmetric As–O stretching mode. Taking into account that this mode is inactive for the symmetric AsO4 tetrahedron, the assignment of the Raman band at 848 cm–1 to symmetric As–O stretching vibrations seems more probable. In this case, the shift of this band towards 860 cm–1 could be explained by the partial substitution of Fe3+ with a higher force-strength cation Sb5+.
X-ray photoelectron spectroscopy
X-ray photoelectron spectroscopy (XPS) measurements were performed on an Escalab 250Xi photoelectron spectrometer equipped with an AlKα monochromatic radiation source (photon energy 1486.6 eV). The spectrometer was calibrated against the Au 4 f7/2 line (binding energy 84.0 eV). The spectra were recorded in the constant transmission energy mode at 50 eV with an XPS spot size of 650 μm. The total energy resolution of the experiment was ∼0.3 eV. The studies were carried out at room temperature in an ultrahigh vacuum of the order of 1·10–9 mbar. To remove the sample charge, a combined ion-electronic charge compensation system was used.
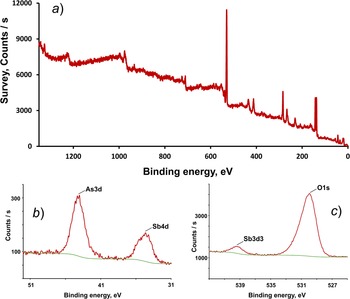
The XPS spectrum (Fig. 6) shows distinct signals at 34.71, 43.99, 137.57, 530.02 and 539.33 eV, which are attributed to the Sb 4d, As 3d, Pb 4f, O 1s and Sb 3d3/2 peaks (Naumkin et al., Reference Naumkin, Kraut-Vass, Gaarenstroom and Powell2023). The most intense Sb 3d5/2 peak is overlapped by the O 1s peak. The Sb peaks at 34.71 and 539.33 eV and the absence of shoulders and broadening, indicate Sb5+ oxidation state with no detectable presence of Sb3+, whose peaks should be arranged at lower energies, for instance, at ca. 33.7 and 538.3 for Sb 4d and Sb 3d3/2, respectively (Garbassi, Reference Garbassi1980; Delobel et al., Reference Delobel, Baussart, Leroy, Grimblot and Gengembre1983; Deepthi et al., Reference Deepthi, Ramesh, Kodiyath, Murphin Kumar, Dakshanamoorthy and Abe2017; Zhang et al., Reference Zhang, Wang, Jia, Chong, Li, Zhang and Wang2024).
The XPS spectra: (a) survey spectra; (b) Sb 4d region; (c) Sb 3d region.

Figure 6 Long description
A) A line graph. The x-axis is labelled “Binding energy, eV” with tick labels at 1200, 1000, 800, 600, 400, 200 and 0. The y-axis is labelled “Survey, Counts per s” with tick labels at 0, 3000, 6000, 9000 and 12000. A red trace starts near 9000 counts per s at about 1200 eV, decreases with small fluctuations. The trace continues downward toward about 600 eV, then shows a tall narrow peak near about 500 eV reaching close to 12000 counts per s. After this peak, the trace drops to around 3000 counts per s and continues downward with several smaller narrow peaks between about 400 eV and 0 eV, 137.57 is the Pb 4f peak, ending near 0 counts per s at 0 eV. b) The x-axis is labelled “Binding energy, eV” with tick labels at 51, 41 and 31. The y-axis is labelled “Counts per s” with tick labels at 0 and 1000. A red trace shows a prominent peak labelled “As3d” at 43.99 eV, rising above the 1000 counts per s tick. A smaller peak labeled “Sb 4d” is at 34.71 eV. A green line runs near the lower part of the plot as a baseline. c) A line graph. The x-axis is labelled “Binding energy, eV” with tick labels at 539, 535, 531 and 527. The y-axis is labelled “Counts per s” with tick labels at 1000 and 3000. A red trace shows a smaller feature labeled “Sb3 d3” near about 539.33 eV and a larger peak labelled “O 1s” at 530.02 that rises above the 3000 counts per s tick.
Chemical data
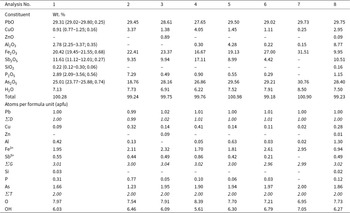
Quantitative chemical analyses of the holotype specimen were carried out with a Cameca SX 100 electron microprobe instrument (WDS mode, 15 kV, 4 nA, 2 μm beam diameter) at the Department of Geological Sciences, Faculty of Science, Masaryk University, Brno, Czech Republic. Analysed elements, analytical X-ray lines, analysing crystals (in parentheses) and standards were as follows: PbMα (LPET) – alamosite; CuKα (LLIF) – chalcopyrite; AlKα (TAP) and FeKα (LLIF) – almandine; SbLβ (PET) – Sb; SiKα (TAP) – wollastonite; PKα (LPET) – fluorapatite and AsLα (TAP) – lammerite. The crystal structure, IR and Raman spectroscopy data confirm the presence of OH groups and the absence of B–O, C–O and N–O bonds in the mineral. Contents of other elements with atomic numbers higher than that of carbon are below detection limits. The H2O content was calculated from the H content determined by CHNS-analysis carried out using a Thermo Flash 2000 organic elemental analyser. Analytical data (for 10 spot analyses) are given in Table 1, an. 1. The empirical formula calculated on the basis of 14 O atoms per formula unit (apfu), is: Pb1.00(Fe3+1.95Al0.42Cu0.09Sb5+0.55)Σ3.01(As1.66P0.31Si0.03)Σ2.00O7.97(OH)6.03. The simplified formula is Pb(Fe3+,Sb5+,Al)3[(As,P)O4]2(OH)6. The ideal formula is Pb(Fe3+2.5Sb5+0.5)(AsO4)2(OH)6 which requires PbO 28.34, Fe2O3 25.35, Sb2O5 10.27, As2O5 29.18, H2O 6.86, total 100 wt.%.
Chemical composition of stibiosegnitite and related minerals

Table 1 Long description
Eight chemical analyses report oxide weight percent totals and calculated atoms per formula unit for stibiosegnitite (1 to 5) and related segnitite-type samples (6 to 8). They are similar and the formula is discussed in the text. Differences are:. Analysis 7 has no Sb2O5 so is described as Sb free segnitite. Aluminium oxide is low or below detection limit (up to ~ 4 wt%) for Sb segnitite but 8.77 wt percent for analysis 8 which is the Al analogue. Sample 2 has lower 8.76 As2O3 while the others are around 28-30 wt%. Sample 2 has 7wt% P2O5 while the others are < 3 wt%.
Analysis numbers: 1 – stibiosegnitite, holotype specimen from Phosphatno-Arsenatnaya vein (ranges; stand.dev. – in parentheses); 2–4 – stibiosegnitite from Phosphatno-Arsenatnaya vein, various samples; 5 – stibiosegnitite from 218 m level; 6 – Sb-bearing segnitite from Phosphatno-Arsenatnaya vein; 7 – Sb-free segnitite from Phosphatno-Arsenatnaya vein; 8 – Al-analogue of stibiosegnitite from 205 m level.
Notes: All Sb is considered as Sb5+ based on XPS data. The H2O content in the holotype specimen (an. 1) is calculated from 0.792 wt.% H determined by CHNS-analysis. The H2O content and O/OH ratio in formulas of other samples (an. 2–8) are calculated based on charge balance constraints. Dashes indicate element concentrations below the electron microprobe detection limit. ΣD = Pb, ΣG = Cu+Zn+Al+Fe3++Sb5+, ΣT = Si+P+As. All formulas are calculated on the basis of the total number of atoms at tetrahedral sites T equal to 2 and 14 O atoms including oxygen of the OH groups.
Additional chemical analyses of stibiosegnitite and related minerals from the Murzinskoe deposit are provided in Table 1, an. 2–8.
The available amount of the mineral allowed some chemical tests demonstrating that stibiosegnitite does not react with water or dilute and concentrated acids (HCl, H2SO4, H3PO4) at room temperature.
X-ray crystallography
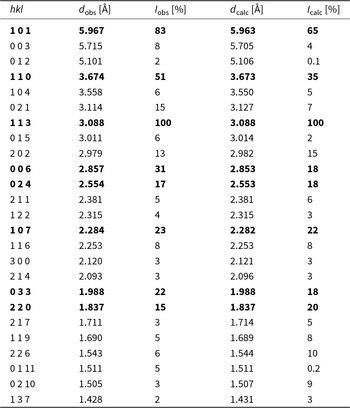
Powder X-ray diffraction (PXRD) data were collected using a X’Pert-Pro (Malvern Panalytical) working with a cobalt anode (CoKα radiation) between 3.008 and 84.965° in 2θ and a step size of 0.017°. The generator setting was 40 kV and 40 mA. The exposure time was ∼100 seconds per step. The data were reduced using HighScore Plus software (version 3.0e) (Malvern Panalytical). PXRD data of stibiosegnitite are given in Table 2 in comparison to those calculated from the SCXRD data. The unit-cell parameters from PXRD data were calculated using the HighScore Plus software (Malvern Panalytical) adopting the McMaille method included in the HighScore Plus software package. The McMaille powder pattern indexing adopts a Monte Carlo (random) search in pseudo direct space from Le Bail. It is a very fast method for high symmetry compounds and it works on the whole profile reconstituted from the peak list and therefore is insensitive to trace impurity peaks. Calculated parameters of the hexagonal unit cell are: a = 7.341(2), c = 17.128(5) Å, V = 799.30(4) Å3 and Z = 3.
Powder X-ray diffraction data for stibiosegnitite*

Table 2 Long description
Powder X-ray diffraction peak list for stibiosegnitite compares observed and calculated d-spacings in angstroms and relative intensities in percent for indexed reflections. The strongest peaks in the order I, d, hkl are: 100, 3.088, 113; 83, 5.961, 101; 51, 3.674, 110; 31, 2.857, 006; 23, 2.284, 107; 22, 1.988, 033; 17, 2.554, 024; 15, 1.837, 220.
* Only observed peaks with intensity ≥ 2% of relative intensity are reported up to d ≈ 1.40 Å. The strongest reflections are given in boldtype. The data were calculated using STOE WinXPOW software.
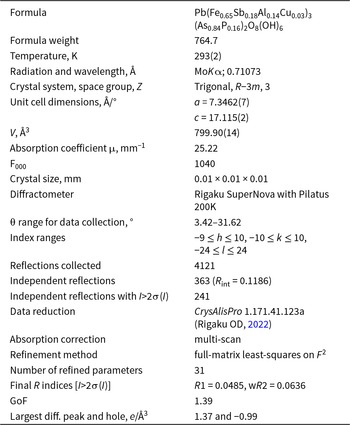
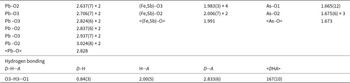
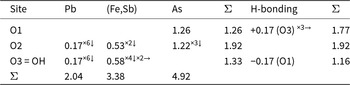
In order to collect SCXRD data, a very small crystal of holotype stibiosegnitite, 0.01 × 0.01 × 0.01 mm, was mounted on a glass fibre and examined with a Supernova Rigaku-Oxford Diffraction diffractometer equipped with a micro-source of MoKα radiation and a Pilatus 200K Dectris detector. The data were collected by 915 frames over 17 runs; the exposure time was 55 seconds per frame. The data were processed by CrysAlisPro 1.171.41.123a software (Rigaku OD, Reference Rigaku2022). Crystal data, data collection information and structure refinement details are given in Table 3, coordinates and displacement parameters of atoms in Table 4, selected interatomic distances in Table 5 and bond-valence sums in Table 6. The crystallographic information file has been deposited in the Inorganic Crystal Structure Database (ICSD) and can be obtained by quoting the CSD 2456580 via www.ccdc.cam.ac.uk/structures/, and also is available as Supplementary material (see below).
Single-crystal X-ray diffraction data collection information and structure refinement parameters for stibiosegnitite

Table 3 Long description
The table summarizes single-crystal X-ray diffraction data collection and structure refinement parameters for stibiosegnitite at about 293 K using Mo K alpha radiation with wavelength 0.71073 angstrom. The crystal is trigonal in space group R minus 3 m with Z of 3, and unit-cell parameters a 7.3462 angstrom and c 17.115 angstrom, giving a cell volume of 799.90 cubic angstrom. Data were collected on a Rigaku SuperNova with a Pilatus 200K detector over a theta range from 3.42 to 31.62 degrees, with index limits spanning h minus 9 to 10, k minus 10 to 10, and l minus 24 to 24. A total of 4121 reflections were measured, yielding 363 independent reflections with an internal agreement value of 0.1186; 241 of these had intensities more than twice their uncertainty. Absorption was handled by a multi-scan correction; the absorption coefficient is 25.22 per millimeter and the crystal was 0.01 x 0.01 x 0.01 mm. Refinement used full-matrix least-squares on F squared with 31 refined parameters, producing final residuals for the stronger reflections of R1 0.0485 and weighted R2 0.0636, with a goodness of fit of 1.39. The largest residual electron-density features are 1.37 and minus 0.99 electrons per cubic angstrom.
Notes: Weighting scheme w =1/[σ2(I) + 0.0004(I)2].
Atom positions, displacement parameters (U, Å2), and site occupancies for stibiosegnitite

Table 4 Long description
The table reports fractional atomic coordinates (x, y, z) and atomic displacement parameters for sites Pb, As, Fe, O1, O2, O3 and H3 in stibiosegnitite. The data is available in the crystallographic information file.
Notes: Site occupancies: Pb = Pb0.1667, As = As0.838(13)P0.162(13), Fe = Fe0.887(9)Sb0.113(9);
* U iso.
Selected bond lengths (Å) and angles (°) for stibiosegnitite

Table 5 Long description
The table lists selected interatomic distances and hydrogen bond geometry for stibiosegnitite, reporting bond lengths in angstroms and angles in degrees, with some values repeated by multiplicity. The data is available in the crystallographic information file.
Bond valence calculations for stibiosegnitite

Table 6 Long description
The table reports bond valence contributions from lead, the mixed iron antimony site, and arsenic to three oxygen sites, plus adjustments from hydrogen bonding. For O1, only arsenic contributes 1.26, and adding a positive hydrogen bonding contribution of 0.17 from O3 counted three times raises the final total to 1.77. O2 receives contributions from lead 0.17 , from the mixed iron antimony site 0.53, and from arsenic 1.22 , giving a total of 1.92 with no hydrogen bonding adjustment. O3, labelled as hydroxyl, receives lead 0.17 and the mixed iron antimony site 0.58 counted two times, giving 1.33 before hydrogen bonding; a negative hydrogen bonding contribution of 0.17 from O1 lowers the final total to 1.16. Column totals across all oxygen sites are 2.04 for lead, 3.38 for the mixed iron antimony site, and 4.92 for arsenic.
Notes: Parameters were taken from Gagné and Hawthorne (Reference Gagné and Hawthorne2015) and from Ferraris and Ivaldi (Reference Ferraris and Ivaldi1988) for H-bonding. The values were calculated taking into account the assigned occupancy of (Fe,Sb) and As sites (see Table 3). For the Pb site, the values were calculated not taking into account its split character.
Crystal structure
The crystal structure of stibiosegnitite was solved from SCXRD data and refined with the use of the JANA2006 software package (Petříček et al., Reference Petříček, Dušek and Palatinus2006) to R 1 = 0.0485 for 241 independent reflections with I > 2σ(I). The Pb site is moved from the origin that is typical for Pb species of the alunite supergroup (Mills et al., Reference Mills, Etschmann, Kampf, Poirier and Newville2014 and references therein), and Pb2+ is coordinated by distorted 12-fold polyhedra due to the stereochemical activity of the 6s 2 lone-pair electrons of the Pb2+ (Mills, Reference Mills2007). The refined number of electrons with pure Fe at the octahedral site and pure As at the tetrahedral site showed that the octahedral site contains any heavier admixture while the As site should be lighter. Therefore during further refinement Sb5+ was allocated to the Fe site and P to the As one. The octahedral site was refined as Fe vs Sb that gave the ratio Fe0.887(9)Sb0.113(9) corresponding to the eref value 28.75. According to the refined number of electrons and the chemical data this site was assumed to be occupied by Fe3+0.65Sb0.18Al0.14Cu0.02 that corresponds to ecalc = 28.77. Bond valence calculations for the (Fe,Sb5+) site gave the value 3.38 valence units which also reflects the increased average valency of cations occurring at this site.
Kolitsch et al. (Reference Kolitsch, Slade, Tiekink and Pring1999) reported the alunite-type structure of “antimonian dussertite”, Ba(Fe3+2.52Sb5+0.48)Σ3(AsO4)2(OH,H2O)6, unambiguously demonstrating by structure refinement and electron microprobe data that all antimony is pentavalent and substitutes Fe3+ rather than As5+. The authors of the cited work provided detailed crystal-chemical analysis of the studied sample comparing ionic radii of Sb5+ (0.60 Å), Sb3+ (0.76 Å) and Fe3+ (0.645 Å) in octahedral coordination that showed that the Sb5+ ion would not be accommodated easily into the [IV]As5+ site as the radius of [IV]As5+ is 0.335 Å. Moreover, a further confirmation that Sb5+ enters the octahedral Fe3+ site but not the tetrahedral As5+ site was found based on the fact that, according to Brown (Reference Brown1988), the average coordination numbers of Sb5+ and Fe3+ in inorganic compounds are 6.05 and 5.69 Å, respectively, while this value for As5+ is equal to 4.41 Å (Kolitsch et al., Reference Kolitsch, Slade, Tiekink and Pring1999). Consequently, taking into account chemical, XPS and structural data and crystal chemical considerations we assume that all Sb in stibiosegnitite occupies the octahedral site. The tetrahedral site was refined as As vs P that resulted in the ratio As:P = 0.838(13):0.162(13) (in atomic units) which fits well the chemical data. The H atom of the OH group was located from the difference-Fourier synthesis and its positions were restricted to keep the O–H distance of 0.85(1) Å and U iso(H) = 1.2U eq(O). All the above considerations result in the structural formula Pb1.00(Fe3+0.65Sb5+0.18Al0.14Cu0.03)3(As0.84P0.16)2O8(OH)6.
Stibiosegnitite is characterized by the alunite-type structure (Fig. 7a) that consists of layers of vertex-sharing (Fe,Sb)O2(OH)4 octahedra and AsO4 tetrahedra with Pb sites located between the layers. The octahedra share all four vertices occupied by OH groups forming a planar kagomé network with three- and sixfold rings (Fig. 7b) usually described as so-called hexagonal tungsten bronze (HTB) layers (Mills et al., Reference Mills, Etschmann, Kampf, Poirier and Newville2014).
The crystal structure of stibiosegnitite (a) and heteropolyhedral layer in it (b). Pb atoms are shown with large pink spheres, As-centred tetrahedra are red, (Fe,Sb)-centred octahedra are green. H atoms are shown as small blue circles. The unit cell is outlined. Drawn using Diamond, Version 3.2k from Crystal Impact.

Figure 7 Long description
The image A shows the crystal structure of stibiosegnitite. Large pink spheres represent Pb atoms, while red tetrahedra are centred around As atoms. Green octahedra are centred around Fe and Sb atoms. Small blue circles indicate H atoms. The unit cell is outlined. The image B presents a view of the heteropolyhedral layer.
Discussion
According to the nomenclature of the alunite supergroup (Bayliss et al., Reference Bayliss, Kolitsch, Nickel and Pring2010) and accepted rules of chemical identification and classification of minerals (Bosi et al., Reference Bosi, Hatert, Hålenius, Pasero, Miyawaki and Mills2019a, Reference Bosi, Biagioni and Oberti2019b), stibiosegnitite, ideally Pb(Fe3+2.5Sb5+0.5)(AsO4)2(OH)6, is a new member of the dussertite group within the alunite supergroup. It is closely related to segnitite, ideally PbFe3+3(AsO4)(AsO3OH)(OH)6 (Birch et al., Reference Birch, Pring and Gatehouse1992) via the coupled heterovalent substitutions Fe3+0.5 +(AsO3OH)2– → Sb5+0.5 + (AsO4)3–. The site-total charge (STC) for the octahedrally coordinated G site of stibiosegnitite is +10 while in segnitite it is +9. Thus, in stibiosegnitite Sb5+ is a species-defining charge-balancing component. A sum of positive charges at the G site, equal to +9.50, represents a boundary between the two minerals. If this value is lower, then the composition falls into the segnitite field, if it is higher, then the composition corresponds to stibiosegnitite.
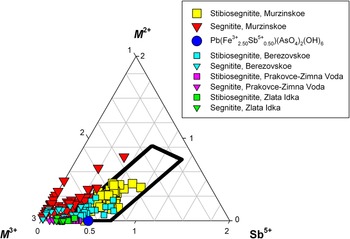
Our numerous electron microprobe analyses (108) show that in the oxidized ores of the Murzinskoe gold deposit segnitite and stibiosegnitite form a continuous solid-solution series (Fig. 8) extending from Sb-free segnitite (see, e.g. Table 1, an. 7) to the variety of stibiosegnitite richest in Sb containing 0.86 Sb apfu (Table 1, an. 4), through many intermediate compositions, with respect to the Sb content (e.g. Table 1, an. 2–3, 5–6). As bivalent cations (Cu, and to a lesser degree, Zn) almost always occupy octahedral sites in segnitite and stibiosegnitite, the formal compositional field of stibiosegnitite is relatively wide and corresponds to a parallelepiped in Fig. 8. Here, minerals were identified as segnitite or stibiosegnitite based on the chemical composition and calculated sum of positive charges at the G site. For example, the cation composition Fe3+2.11Al0.13Sb5+0.44Cu0.32 at the G site (Table 1, an. 2) gives a positive charge of +9.56 (2.11×3+0.13×3+0.44×5+0.32×2) and, thus, formally corresponds to stibiosegnitite. In an. 6 of Table 1 the sum of positive charges at the G site is 9.19 therefore this mineral is Sb-bearing segnitite. In total, 65 analyses of Murzinskoe material in Fig. 8 fall into the stibiosegnitite field and only 43 – into the segnitite one.
Ternary plot showing cations of mixed valence (in apfu) at the G site in minerals of the stibiosegnitite–segnitite series from different localities. The theoretical field of the stibiosegnitite compositions is surrounded by a black line. The composition corresponding to the ideal formula of stibiosegnitite is shown by a blue circle.

Figure 8 Long description
The ternary plot displays cation proportions in apfu for minerals in the stibiosegnitite–segnitite series. The axes are labelled M2 plus, M3 plus and Sb5 plus. The plot includes multiple datasets from different localities, distinguished by coloured markers: yellow squares for Stibiosegnitite, Murzinskoe; red downward triangles for Segnitite, Murzinskoe; blue circles for Pb(Fe3 plus 2.50 Sb5 plus 0.50)(AsO4)2(OH)6; cyan squares and triangles for Berezovskoe; magenta squares and triangles for Prakovce-Zimna Voda; green squares and triangles for Zlata Idka. The black outlined field represents the theoreticalregion for stibiosegnitite compositions. Most data points cluster near the lower-left region, indicating higher M3 plus and lower Sb5 plus proportions. The blue circle marks the ideal stibiosegnitite composition. The plot highlights compositional differences among localities, with Murzinskoe samples extending further into the stibiosegnitite field.
Although stibiosegnitite was approved by the CNMNC IMA as a new mineral species in early December 2024, chemically similar samples were described previously from other localities.
Pekov et al. (Reference Pekov, Khanin, Yapaskurt, Pakunova and Ekimenkova2015) reported on the extended system of solid solutions between beudantite and segnitite, including an Sb-bearing variety, from the oxidation zone of the Berezovskoe gold deposit, Middle Urals, Russia (Pekov et al., Reference Pekov, Khanin, Yapaskurt, Pakunova and Ekimenkova2015). The structure of Sb-bearing segnitite from this locality was not examined, however, the authors of the cited paper revealed the pentavalent state of Sb on the basis of statistical chemical data and placed this element at the octahedral site G. Within 44 electron microprobe analyses of segnitite, provided by them, 23 now correspond to stibiosegnitite and 21 to Sb-bearing segnitite (Fig. 8). The highest Sb2O5 content in the Berezovskoe mineral is 15.2 wt.% (0.76 Sb apfu) which was the highest Sb content observed in any alunite supergroup mineral at that time. In one sample of stibiosegnitite from Murzinskoe we measured an even higher Sb content, up to 17.1 wt.% Sb2O5 (0.86 Sb apfu) – see Table 1, an. 4.
Ondrejka et al. (Reference Ondrejka, Ferenc, Majzlan, Števko, Kopáčik, Voleková, Milovská, Göttlicher, Steininger, Mikuš, Uher, Biroň, Sejkora and Molnárová2023) described Sb-Bi-rich minerals of the philipsbornite–segnitite series from the oxidation zone at the Prakovce-Zimná Voda REE–U–Au quartz vein in Slovakia. The oxidation state of antimony was investigated by X-ray absorption spectroscopy and showed that all Sb is in pentavalent state. From 64 chemical analyses of “Sb-rich segnitite” the biggest majority (46) fall into the stibiosegnitite field (Fig. 8) with the highest Sb2O5 content of 8.40 wt.% (0.40 Sb apfu).
In the most recent paper Števko and Sejkora (Reference Števko and Sejkora2025) reported on “Sb-rich segnitite” from another Slovakian locality – the Zlatá Idka Ag-Au-Sb deposit in Spišsko-gemerské rudohorie Mts. Antimony contents in provided chemical analyses vary from 2.95 to 6.86 wt.% Sb2O5 (0.15 to 0.34 Sb apfu). As a result, 3 analyses from 12 given formally correspond to stibiosegnitite (Fig. 8).
Mills et al. (Reference Mills, Etschmann, Kampf, Poirier and Newville2014) refined the structure of “Sb-rich segnitite” from Black Pine Mine, Montana, USA with 8.37 wt.% Sb2O5 and the empirical formula Pb1.02H1.02(Fe3+2.36Sb5+0.41Cu2+0.27)Σ3.04(As5+1.78Sb3+0.07S6+0.02)Σ1.88O8(OH)6. The STC value for the G site of this mineral is +9.67 so it is closer to stibiosegnitite than to segnitite. However, uncertainties in the classification of their mineral remain due to the substantial deficit (1.88 instead of 2 apfu) of atoms at the T site which is balanced by 1.02 apfu of H+ that is proper for segnitite but not for stibiosegnitite.
Two other potentially new alunite-supergroup members with species-defining charge-balancing Sb5+ might exist. As noted above, Kolitsch et al. (Reference Kolitsch, Slade, Tiekink and Pring1999) reported on the structure of so-called “antimonian dussertite” with the formula Ba(Fe3+2.52Sb5+0.48)Σ3(AsO4)2(OH,H2O)6 from the Clara Mine, Oberwolfach, Germany. Now their mineral could be classified as a new species, a Ba-dominant analogue of stibiosegnitite. The second one is the Al-analogue of stibiosegnitite (“stibiophilipsbornite”) discovered by us in one of the samples from 205 m level of the Murzinskoe deposit (Table 1, an. 8). Unfortunately, the very small quantity of available material currently precludes its full characterization as a new mineral species.
Supplementary material
The supplementary material for this article can be found at https://doi.org/10.1180/mgm.2025.10150.
Acknowledgements
We thank Associate Editor, Reviewer Igor V. Pekov and two anonymous reviewers for constructive comments that improved the manuscript. This work in part of structural and crystal chemical analysis was supported by the Russian Science Foundation [grant No. 25-17-00005] (for N.V.Z.). The IR spectroscopy investigation and interpretation of the Raman spectrum were performed in accordance with the state task, registration number 124013100858-3 (for N.V.C.). X-ray photoelectron spectroscopy was carried out in the Research Centre of Physical methods of surface investigation of the St. Petersburg State University within the framework of project 125021902439-8.
Competing interests
The authors declare none.




 Open access

