Implications
Nitrous oxide (N2O) emissions from soil are one of the main components of greenhouse gases in the agricultural sector and animal excreta have been identified as a major source of these emissions. Our study showed that feeding forage rape reduced the N2O–N emission factor (EF3; N2O–N emitted during the 3-month measurement period as a per cent of animal excreta N applied) for sheep urine by about 60%, compared with feeding perennial ryegrass. This finding is significant for developing mitigation measures to reduce EF3 for animal urine. Further study needs to be conducted under different soil and climate conditions to confirm this finding.
Introduction
In New Zealand, agriculture is predominantly based on grazing systems and animal excreta deposited onto soils during grazing have been identified as a major source of N2O emissions (Ministry for the Environment, 2011). N2O is problematic as it contributes to global warming by its action as a greenhouse gas and it is also involved in the degradation of stratospheric ozone (McTaggart et al., Reference McTaggart, Parker, Swan, Clayton and Smith1997).
N2O emissions are generally higher in winter when soils are wet, and after grazing owing to the large amount of nitrogen (N) excreted in dung and urine (Luo et al., Reference Luo, Lindsey and Ledgard2008b and Reference Luo, Saggar, Bhandral, Bolan, Ledgard, Lindsey and Sun2008c; Schills et al., Reference Schils, Eriksen, Ledgard, ThV, Kuikman, Luo, Petersen and Velthof2013). Forage brassicas (Brassica spp.) are widely used in animal agriculture owing to their fast growth rates, high dry matter yield and high nutritional value (Belesky et al., Reference Belesky, Koch and Walker2007) compared with perennial grass pastures. Forage brassicas have less NDF and more non-structural carbohydrates than perennial ryegrass (Lolium perenne L.) (Sun et al., Reference Sun, Waghorn, Hoskin, Harrison, Muetzel and Pacheco2012). The greater readily fermentable carbohydrate content of brassicas compared with ryegrass has the potential to improve the efficiency of N utilisation in the rumen and consequently reduce N losses (Pacheco and Waghorn, Reference Pacheco and Waghorn2008). However, little data are available describing the partitioning of dietary N between urine and dung from animals fed forage brassica rape, and the quantification of N2O emissions from this urine and dung when applied to the soil.
The aim of this study was to measure N output in excreta (urine and dung) from sheep fed forage rape (B. napus subsp. oleifera L.) or perennial ryegrass, and to quantify N2O emissions when these excreta were applied to a perennial ryegrass/white clover pasture soil.
Material and methods
Animal experiment
A sheep metabolism study at the AgResearch Grasslands Research Centre in Palmerston North, New Zealand, approved by AgResearch Animal Ethics Committee (approval no. 12320), was used to collect urine and dung from sheep fed forage rape or ryegrass from paired plots (described in detail later). A total of 12 male Romney lambs aged 9 months and at 39.3±1.4 kg (mean±s.d.) liveweight were randomly allocated into two groups fed either forage rape or ryegrass. The experiment was conducted over two periods to allow coverage of the length of time for lamb finishing with forage rape in commercial operations (i.e. 3 to 4 months). The first period of the experiment included 41 days of acclimation to their respective forage types in a grazing situation, 3 days in indoor pens for acclimation to a confined indoor environment, 10 days in metabolism crates for further acclimation and 7 days of measurement as illustrated in Figure 1. Animals were subsequently released outdoors to graze the same forage type they had been grazing previously for another 38 days. The process was then repeated with the same animals on the same diets for the second period of the experiment, with 3 days in pens and 9 days in crates, followed by a further 7 days of measurement.
The schematic of animal experiment.

To minimise internal parasite burdens, all sheep were drenched on three occasions. On the first day of the experiment, each sheep received an oral drench consisting of 4 ml of anthelmintic preparation containing 8 mg abamectin, 320 mg levamisole, 20 mg cobalt and 4 mg selenium (Intervet Schering-Plough Animal Health Ltd, Wellington, New Zealand). Another two drenches were administered on the day they were transferred indoors during the two indoor periods of the experiment. On these two occasions each animal was given an oral drench of 9 ml anthelmintic preparation containing 9 mg of abamectin, 360 mg of levamisole and 204 mg of oxfendazole (Merial New Zealand Ltd, Auckland, New Zealand). According to the analysis of minerals in the forage, iodine, copper and sodium were supplemented. On the third day of the experiment, 1.5 ml of iodised peanut oil containing 390 mg of organically bound iodine (Flexidine; Bomac Export Limited Auckland, New Zealand) and 4 g of cupric oxide (CuO; Bayer New Zealand Limited, North shore, New Zealand) were administered intramuscularly and orally, respectively, to sheep in the forage rape group. Mineral enriched salt (sodium chloride) was freely available to all animals during the outdoor grazing periods and supplied at about 5 to 10 g/day per animal during the indoor period.
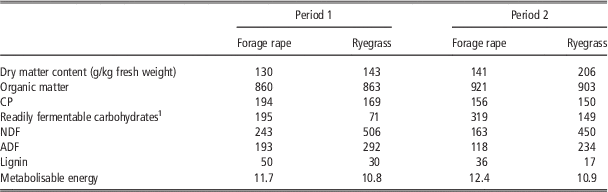
During the indoor periods of the experiment the animals were provided with fresh cut forage twice a day in equal amounts at 0900 and 1600 h and access to water ad libitum. The feeding allowance was set at 1.5 times the metabolisable energy (ME) maintenance requirement, calculated according to the Australian Agricultural Council (1990) standards. Feed allowance was calculated from animal liveweight, feeding level and the amount of ME in the forage. The latter was estimated using near IR reflectance spectroscopy (NIRS, model MPA; Bruker Optics, Ettlingen, Germany) as described by Sun et al. (Reference Sun, Waghorn, Hoskin, Harrison, Muetzel and Pacheco2010). Forage chemical composition during the two metabolism experiments is presented in Table 1.
Chemical composition (g/kg dry matter) and metabolisable energy (MJ/kg dry matter) of forage rape (Brassica napus subsp. oleifera L.) and perennial ryegrass (Lolium perenne L.)

NDF=neutral detergent fibre; ADF=acid detergent fibre.
1 Readily fermentable carbohydrates include hot water-soluble carbohydrates plus pectin.
Pure forage swards were established in paddocks at the AgResearch Grasslands Research Centre for providing feed for both the grazing and indoor experimental periods. Forage rape (var. Titan) was sown at a rate of 4.7 kg/ha together with diammonium phosphate at the rate of 140 kg/ha in a Manawatu fine sandy loam soil on 3 March 2011. On 5 May 2011, 200 kg/ha of superphosphate containing 93 g phosphorus/kg, 108 g sulphur/kg and 200 g calcium/kg (Ravensdown Limited, Hornby, New Zealand) and on 12 April 2011, 60 kg/ha of urea containing 460 g N/kg was applied. The first grazing of the paddock occurred on 9 May 2011. The permanent pasture, consisted of a ryegrass (Lolium perenne L. var. Ceres One50 containing endophyte AR1) sward, which had been established in autumn 2008, and subject to year-round rotational grazing thereafter.
During the two indoor experimental periods, forage was harvested daily in the morning (1030 to 1200 h) using a sickle bar mower set at a stubble height of ca. 10 cm for forage rape and ca. 5 cm for ryegrass. The forage rape was 18 weeks post planting at the beginning of the first measurement period and 26 weeks at the second period. Both forage rape and ryegrass were in a vegetative state during the two experimental periods. Harvested forage was stored in a cold room (4°C) until presented to the animals. The dry matter (DM) content of each forage type was determined daily in triplicate (ca. 200 g each sample) at 105°C for 24 h. One forage sample per forage type per day was collected daily, dried at 65°C for 48 h, pooled by period and by forage type and ground in a Wiley mill (Arthur H. Thomas Company, Philadelphia, PA, USA) through a 1 mm sieve for chemical analysis.
After the indoor acclimation, sheep were transferred to metabolism crates with a wire mesh floor. Harnesses and faecal bags were installed a day before collection. The crate was fitted with a stainless steel tray placed below the wire mesh in order to capture and collect urine into a plastic bucket. Each bucket had 100 ml of 6 M sulphuric acid added in advance, to prevent ammonia volatilisation and stirring of the contents was conducted twice daily (in the morning and in the afternoon). Uneaten forage (refusal), faecal and urine samples were collected once daily in the morning before feeding from all animals over the 7-day measurement period. Refusal samples were dried at 65°C for 48 h, weighed and pooled over the 7 days for each animal. Faecal samples were weighed and a 10% aliquot subsampled and stored at −20°C. Faecal subsamples were pooled over the 7 days for each animal, freeze-dried and then oven dried at 65°C for DM determination. Refusal and faecal samples were ground in a Wiley mill through a 1 mm sieve for determination of N concentration. Collected urine was weighed daily and a 50 ml aliquot sample was taken and then stored at −20°C. At the end of the experiment, daily urine samples from each individual animal were thawed and pooled according to the proportion of urine output each day and the N concentration determined.
Forage samples were analysed for NDF, ADF, ADL, total N, ash and readily fermentable carbohydrates including hot water-soluble carbohydrate and pectin (Table 1), using the same procedure as described in the study by Sun et al. (Reference Sun, Hoskin, Muetzel, Molano and Clark2011). CP was calculated from N concentration multiplied by 6.25. Organic matter was calculated by subtraction of the ash concentration.
Soil experiment
An experiment was established at the AgResearch Ruakura Farm near Hamilton, New Zealand (37°46′10″S, 175°18′21″E). The experimental site contained perennial ryegrass/white clover (Trifolium repens L.) pasture, on a poorly drained silt-loam Te Kowhai soil. The Te Kowhai soil is classified as a Typic Orthic Gley soil in the Soil Classification system (Hewitt, Reference Hewitt1998).
Urine and dung were collected separately from an identical (similar liveweight, same ages and diets) group of sheep in the indoor feeding facility during the second period of the above animal experiment and used to measure N2O emissions from excreta amended soils in a field plot experiment. Excreta (urine and dung) were collected from 24 sheep that had been fed forage rape for 15 weeks and from 18 sheep fed ryegrass for the same period of time. Collection was conducted twice a day before morning and afternoon feedings for 2 consecutive days. No acid was added to this urine. After each collection, the urine and dung were kept in sealed containers in a cool room (4°C) and after the final collection they were immediately transported to the experimental site in ice-filled insulated bins. The urine and dung were analysed again for N content just before application to account for any N loss during storage and transport. The N loading rates were calculated using these values.
The treatments, with four replicates of each, comprised: (1) urine from sheep fed forage rape, (2) urine from sheep fed ryegrass, (3) dung from sheep fed forage rape, (4) dung from sheep fed ryegrass and (5) control (no urine or dung).
The plots (~0.5×0.5 m) were set up in a randomised block design, with five treatment plots in each of the four blocks. The individual treatments were randomly assigned to the treatment plots in each block and each plot contained a similarly treated area for gas sampling and destructive soil sampling.
To mimic sheep urination in the grazing situations, urine from sheep fed forage rape or ryegrass was applied at the same volume per unit of land area, equivalent to 4 l/m2. This rate is a typical average for sheep (Haynes and Williams, Reference Haynes and Williams1993; Whitehead, Reference Whitehead1995). From the results of the metabolism study it was expected that the N concentration of urine from sheep fed forage rape would be lower than the N concentration of urine from sheep fed ryegrass. This difference was found to be larger than expected, giving an N loading rate for urine from sheep fed forage rape of 155 kg N/ha and for sheep fed ryegrass the loading rate was 441 kg N/ha. Owing to the difference in N loading rate, the total N2O emissions from each source would be expected to differ. However, de Klein et al. (Reference de Klein, Luo, Woodward, Styles, Wise, Lindsey and Cox2014) found that the N2O emission factor (EF3 N2O–N emitted as per cent of urine-N applied) was independent of urine-N loading rate up to 1200 kg N/ha at a nearby location. Kelliher et al. (Reference Kelliher, Li and Nobel2014) had a similar finding. The urine was evenly applied to the entire 24 cm diameter area of the soil chamber base. Sheep dung was applied at a rate equivalent to 5 kg/m2. This rate is within the typical range of dung excretion for sheep (Haynes and Williams, Reference Haynes and Williams1993; Whitehead, Reference Whitehead1995). The N load of dung for sheep fed ryegrass was 430 kg N/ha and for sheep fed forage rape was 890 kg N/ha. The dung was evenly spread to a plot 200 mm in diameter inside the 240 mm diameter soil chamber base.
A soil chamber technique was used to measure N2O emissions, and the methodology was based on that from previous studies on N2O emissions (Luo et al., Reference Luo, Ledgard and Lindsey2008a). The chambers were modified polyvinyl chloride (PVC) ‘sewer-hatches’ attached to a section of PVC pipe. The chambers were 200 mm deep and with a 240 mm internal diameter. The ‘sewer-hatch’ rim had an internal half-turn locking system and a greased rubber O-ring, which formed a gas-tight seal. Chambers were inserted 50 to 100 mm into the soil one day before excreta application. Chambers remained in place throughout the entire measurement period. Chamber height was measured for each chamber and each chamber volume was calculated. On each sampling day, the chamber was closed with a lid for 1 h, and the air above the soil surface was sampled through a three-way tap on the chamber lid, using a 25 ml syringe. A 10-ml headspace air sample was taken from each chamber at 0 (T0) and 60 (T60) min. Previous studies examining emissions from animal excreta on pasture in a similar location found that emission rates were linear over this time period (de Klein et al., Reference de Klein, Barton, Sherlock, Li and Littlejohn2003; Saggar et al., Reference Saggar, Andrew, Tate, Hedley, Rodda and Townsend2004).
Following excreta treatment application in early September 2011, N2O emission samplings were carried out at least weekly, as described above. More frequent sampling occurred in the first month and following rainfall (van der Weerden et al., Reference van der Weerden, Clough and Styles2013). Gas sampling was continued until background N2O levels were reached. For the two urine treatments, sampling continued for 3 months and was completed in December 2011 while for the dung treatments the sampling continued for about 8 months until May 2012. The gas sampling schedule agrees with those recommended in the guidelines for N2O chamber methodology (de Klein and Harvey, Reference de Klein and Harvey2012). There could have been some N2O emissions from the urine and dung after sampling ceased. However, a number of previous studies have suggested that the majority of emissions occur during the first 3 or 6 months after application of animal urine or dung, respectively (e.g. Kelliher et al., Reference Kelliher, Cox, van der Weerden, de Klein, Luo, Cameron, Di, Giltrap and Rys2013; Luo et al., Reference Luo, Hoogendoorn, van der Weerden, Saggar, de Klein, Giltrap, Rollo and Rys2013; van der Weerden et al., Reference van der Weerden, Clough and Styles2013).
Gas samples were analysed using a gas chromatograph equipped with a 63Ni-electron capture detector. Hourly N2O fluxes were calculated for each chamber from the increase in headspace N2O concentration over the sampling time (associated measurements showed that this occurred at a linear rate). The hourly fluxes were integrated over time using a trapezoidal approach to estimate the total daily emission and the emissions over the measurement period.
EF3 for the measurement periods were then calculated from the difference in total emissions from each excreta treatment and the control treatment, divided by the rate of urine-N or dung-N applied, as described by equation (1):
 $${\rm EF3=}{{{\rm N}_{2} {\rm O}\,{\rm total}\,{\rm (urine}\,{\rm or}\,{\rm dung)}\,{\minus}\,{\rm N}_{{\rm 2}} {\rm O}\,{\rm total}\,{\rm (control)}} \over {{\rm Urine}\,{\rm or}\,{\rm dung\ {\hyphen}N}\,{\rm applied}}}{\times}100$$
where EF3 (N2O–N emitted during the 3- or 8-month measurement period as per cent of urine-N or dung-N applied), N2O total (urine or dung) and N2O total (control) are the cumulative N2O emissions during the measurement periods from the urine or dung and control plots, respectively (kg N/ha), and urine or dung-N applied is the rate N applied in kg N/ha.
Soil samples (75 mm deep, 25 mm diameter) were taken from all plots for determination of soil nitrate, ammonium and water content. Immediately after sampling the hole was back filled with sealed PVC tubes to minimise any effects on soil aeration. Back in the laboratory on the same day or the following day (after refrigeration), the samples were thoroughly mixed and about 15 g of fresh soil (about 10 g dry soil equivalent) was extracted for 1 h in 100 ml of 2 M potassium chloride. The filtered (using filter paper No 42 or equivalent) solutions were then frozen until analysed for nitrate (plus nitrite) and ammonium using a Skalar SAN++ segmented flow analyser (Skalar Analytical B.V., Breda, The Netherlands) (Blakemore et al., Reference Blakemore, Searle and Daley1987). The nitrate method involves cadmium reduction to nitrite followed by diazotisation with sulphanilamide and coupling with N-(1-naphthyl) ethylenediamine dihydrochloride to form an azo dye measured colourimetrically at 540 nm. The ammonium method is based on the modified Berthalot reaction. Ammonia is chlorinated to monochloramine that reacts with salicylate and is then oxidised to form a blue/green coloured complex, which is measured colourimetrically at 660 nm.
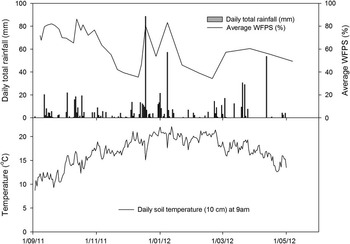
A subsample of the remainder of the mixed soil was dried at 105°C for 24 h, to determine gravimetric soil water content. Water-filled pore space (WFPS) was calculated by dividing volumetric water content by total porosity (Linn and Doran, Reference Linn and Doran1984). Total porosity was calculated as follows: 1−(bulk density/particle density). Volumetric water content was calculated by multiplying gravimetric water content by bulk density. From an adjacent weather station, maintained by New Zealand’s National Institute of Water and Atmospheric Research, air and soil temperatures (at 10 cm depth) were obtained for each sampling day, along with daily rainfall (Figure 2).
Climatic conditions and soil water-filled pore space (WFPS) during the experimental period.

Statistical analysis
The data obtained from the animal experiment were analysed using a two-way ANOVA with forage species and experimental period as two experimental factors. A one-way ANOVA was conducted to determine the significance of the differences in EF3 between the treatments for the soil experiment. The statistical analyses were performed using Genstat 13 (Payne et al., Reference Payne, Harding, Murray, Soutar, Baird, Glaser, Channing, Welham, Gilmour, Thompson and Webster2010).
Results and discussion
N excretion
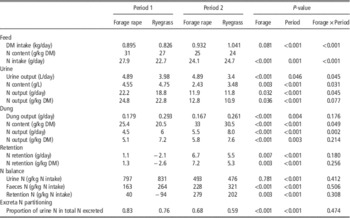
In the first experimental period, DM intake of sheep in the forage rape group was 8% higher than that in the ryegrass group (P<0.001) (Table 2). With the higher N concentration in forage rape than in ryegrass, daily N intake of sheep fed forage rape was 23% higher compared with ryegrass (P<0.001). In the second experimental period, sheep in the forage rape group ate 10% less DM than those in the ryegrass group, but forage rape had a slightly higher N concentration. As a result, the two groups of animals had similar N intake per day in the second period (P=0.266).
Nitrogen (N) excretions, partitioning in urine and dung, and N balance from sheep fed fresh forage rape (Brassica napus L.) or perennial ryegrass (Lolium perenne L.)

DM=dry matter.
Mean±s.e.m. n=6 each treatment each period. 6 M H2SO4 was added into urine sample to prevent ammonia evaporation during collection.
Daily N output from urine was 18% higher from animals fed forage rape than those fed ryegrass (P=0.021) in the first period, but was similar (P=0.475) for the two groups in the second period. In terms of N output in urine per unit of N intake (g/kg N intake), no differences were found between the two groups, averaging 814 and 485 g N/kg N intake in the first (P=0.505) and second (P=0.297) period, respectively. The high value of urine-N output in the first period and low value in the second period might have resulted from lower readily fermentable carbohydrate and higher structural carbohydrate in the first period than in the second period (Table 1) since in the first period less energy was available for N capture and excess N beyond the capability of capture energy would be excreted to urine (Pacheco and Waghorn, Reference Pacheco and Waghorn2008).
Dung output (kg/animal) from sheep fed forage rape was 36% to 39% less than that from those fed ryegrass (P<0.001). Although dung from sheep fed forage rape had a higher N concentration than ryegrass, by 24% in the first period (P<0.001) and 8% in the second period (P=0.085), dung-N output was still lower from sheep fed forage rape than those fed ryegrass by 25% and 31% in the first and second periods (P<0.001 for both periods), respectively. When dung-N output is expressed as per unit of N intake, sheep fed forage rape excreted less N than those fed ryegrass in both periods (P<0.01 for both periods).
In terms of N balance (the difference between total N inputs and N outputs in excreta), sheep fed forage rape retained N, but those fed ryegrass lost N from their body in the first period (Table 2). The negative N retention could be partly owing to the low quality of the forage in the first period as it had a low readily fermentable carbohydrate content and had high levels of NDF and lignin (Table 1). It may also be owing to uncompleted removal of intestinal parasites, which were observed in the faeces of the ryegrass-fed sheep but not in the faeces of the forage rape-fed sheep in the first period. In the second period, sheep in both groups had positive N retention. Sheep fed forage rape retained on average 77 g N/kg N intake more than those fed ryegrass, although due to large variation among animals the difference was not significant (P=0.193). The total N excreted as urine and dung was similar from sheep fed either forage rape or ryegrass (P>0.118), averaging 25.8 and 18.4 g N/day for the first and second periods, respectively. However, the proportion of urine N in total N excreted was higher by 0.07 (P=0.001) from sheep fed forage rape (0.83) than those eating ryegrass (0.76) in the first period. In the second period, sheep fed forage rape still had a higher (P=0.001) proportion of urine N in total N excreted than sheep fed ryegrass (0.68 v. 0.59). This was probably owing to the differences in CP levels in the two different diets (Table 1). Kelliher et al. (Reference Kelliher, Cox, van der Weerden, de Klein, Luo, Cameron, Di, Giltrap and Rys2013) found that there was a direct relationship between the concentration of N in livestock feed and the proportion of N excreted as urine.
The forage rape contained more readily fermentable and less structural carbohydrates than ryegrass (Table 1). Thus, animals on the forage rape diet would be expected to retain a greater proportion of their ingested N than on a ryegrass diet. In terms of per gram of absorbed N (N intake minus N output from dung), animals on the forage rape diet retained 0.05 to 0.36 g N in the body, more (P=0.012) than was retained by animals on the ryegrass diet (−0.13 to 0.30 g N) and also excreted less (0.64 to 0.95 g N; P=0.012) from urine than ryegrass (0.70 to 1.13 g N). However, dung-N output from sheep fed forage rape was reduced by 25% to 31% (P<0.001) compared with ryegrass. This suggests that N use efficiency by sheep was improved by forage rape compared with ryegrass. Therefore, from an N excretion mitigation point of view, a forage rape diet compared with a ryegrass diet had reduced N output in dung, but not in urine in terms of either daily output (N g/day) or N output in per unit of N intake (N g/kg N intake).
N2O emissions
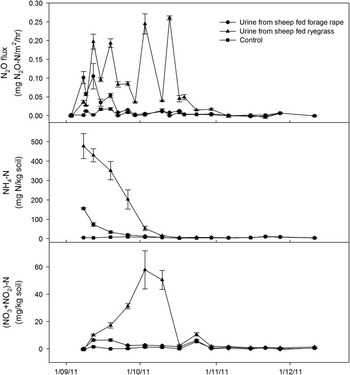
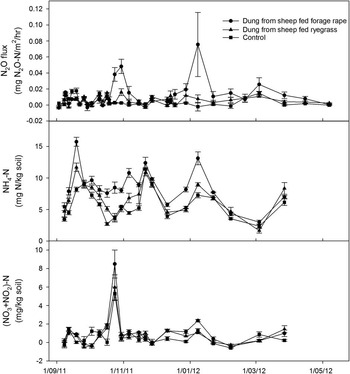
The impacts of urine excreted by sheep fed forage rape compared with ryegrass on the fate of urine N in the soil are shown in Figure 3. The peak nitrate-N levels occurred 10 days after the urine had been applied to the soil from the sheep fed forage rape, compared with 26 days for the urine from sheep fed ryegrass. The reason for this difference is unknown. It may be related to differences in urine composition between the two types of urine, or to the different urine-N loading rates for the two urine types used in this experiment (155 v. 441 kg N/ha for the forage rape and ryegrass urine, respectively). Soil mineral N changes, as shown in Figure 3, indicated that the much higher soil ammonium-N levels, as a result of the higher N loading rate of the urine from the sheep fed ryegrass, led to the persistence of higher nitrate-N levels in the soil for up to 6 weeks after application. The higher nitrate-N levels would lead to increased emissions of N2O owing to the increased supply of substrate for denitrification.
Nitrous oxide emissions and soil mineral N concentrations after application of urine from sheep fed perennial ryegrass (Lolium perenne L.) or forage rape (Brassica napus subsp. oleifera L.) (urine application date was on 8 September 2011, bar represent s.e., n=4).

The duration of N2O flux peaks from the application of urine from sheep fed forage rape was much shorter compared with that from the urine from sheep fed ryegrass (Figure 3). The difference in the duration of the N2O flux peaks was closely associated with the different concentrations of mineral N, particularly nitrate-N, in the soil after the application of the two types of urine.
The greatest N2O fluxes recorded were generally associated with rainfall events and high WFPS (Figures 2 and 3). An increase in the WFPS of the soil creates anaerobic conditions that together with high levels of N and carbon availability in the soil owing to the presence of the excreta would have led to a greater opportunity for N2O production and emission. Studies (e.g. Smith et al., Reference Smith, Ball, Conen, Dobbie, Massheder and Rey2003; Luo et al., Reference Luo, Ledgard and Lindsey2008a, Reference Luo, Lindsey and Ledgard2008b and Reference Luo, Saggar, Bhandral, Bolan, Ledgard, Lindsey and Sun2008c) have shown that soil WFPS, of all measured factors, has the strongest influence on N2O emissions from excretal N input. Generally, N2O emissions are greatest when soil WFPS is at or above soil field capacity. In this study several large N2O emission peaks from sheep urine fed with ryegrass occurred during periods of high nitrate concentration when N2O emission rates were not limited by nitrate availability (Figure 3). At these times, although WFPS was between 60% and 80%, changes in WFPS within this range (Figure 2) may have resulted in these large changes in N2O emissions.
The impacts of sheep fed ryegrass compared with forage rape on the fate of dung N in the soil are shown in Figure 4. A greater soil ammonium-N concentration was found where dung from sheep fed forage rape was applied to the soil (Figure 4).
Nitrous oxide emissions and soil mineral N concentrations after application of dung from sheep fed forage rape (Brassica napus subsp. oleifera L.) or perennial ryegrass (Lolium perenne L.) (dung application date was on 8 September 2011, bar represent s.e., n=4).

In the dung-treated soil, there were two obvious N2O flux peaks from the dung of sheep fed forage rape. However, there was no obvious N2O flux peak from the application of dung from sheep fed ryegrass. This was in contrast to what was shown when urine from sheep fed ryegrass was applied to the soil (Figures 3 and 4). However, as in the urine treatments, the N2O flux peaks were associated with, and probably a result of, the different concentrations of mineral N in the soil after the application of the two types of sheep dung (Figure 4). As well, it appears that soil mineral N (both soil ammonium-N and nitrate-N) levels for the control followed similar trends as for the dung treatments (Figure 4). The change in soil mineral N levels was closely related to the variation in soil WFPS (Figure 2), suggesting high soil moisture may have led to high soil mineralisation and nitrification rates which may, in turn, have resulted in more available N from the native soil for N2O production.
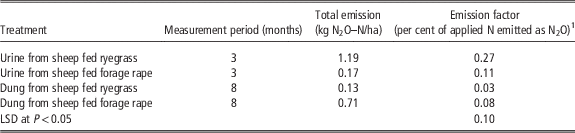
The EF3 for the urine and dung treatments are an important index in terms of the potential of the two different types of forages in reducing N2O emissions from grazing systems. Table 3 shows the EF3 from each treatment. The emission factor for urine from sheep fed ryegrass during the 3-month measurement (0.27%) was higher (P<0.05) than that from those fed forage rape (0.11%). Accordingly, the use of forage rape reduced EF3 for sheep urine by about 60%, compared with the use of ryegrass. While the mechanism for this reduction is not yet known, one hypothesis is that plant secondary metabolites are transferred to urine and affect soil N transformation processes. This hypothesis is based on current knowledge that a wide range of plant secondary metabolites are excreted in urine (Lane et al., Reference Lane, Fraser, Cao, Koulman, Cosgrove and Death2006; Estell, Reference Estell2010) and that glucosinolates, a major group of secondary compounds in brassicas, and their degradation products were found to act as a nitrification inhibitor when directly added to soil (Bending and Lincoln, Reference Bending and Lincoln2000; Snyder et al., Reference Snyder, Johnson-Maynard and Morra2010). van Groenigen et al. (Reference van Groenigen, Kuikman, de Groot and Velthof2005) also suggested that diet manipulation as a mitigation strategy for reducing N2O emissions due to its effect on urine composition.
Emissions from the various treatments comparing sheep fed fresh forage rape (Brassica napus subsp. oleifera L.) or perennial ryegrass (Lolium perenne L.) (n=4)

The N loading rate of urine was 441 kg N/ha for sheep fed ryegrass and 155 kg N/ha for sheep fed forage rape. The N loading rate of dung was 430 kg N/ha for sheep fed ryegrass and 890 kg N/ha for sheep fed forage rape.
1 Emission factor (EF3) for the measurement periods only.
The finding that reduction of EF3 for sheep urine by the use of forage rape compared with the use of ryegrass is significant for developing potential mitigation measures to reduce EF3 for animal urine from grazing systems. However, it is unclear that the reduction effect is reproducible under different soil and climate conditions. Furthermore, caution is expressed as even though per animal emissions may be reduced, total N2O emissions per ha of grazed land depend on the total amount of DM harvested, the total amount of N excreted in both dung and urine per ha, as well as the EF3 for that urine and dung. Caution is also required regarding the EF3 obtained during the short 3-month measurement period. Further longer-term field experiments need to be conducted to confirm our findings, and to explore the mitigation potential of forage brassica crops at a farm system scale. As well, the reason for such an effect needs to be explored.
In this experiment urine was applied at the same volume for the two types of urine, rather than the same N loading rate, to mimic animal urination in the grazing situations. This led to different N loading rates between the two types of urine. De Klein et al. (Reference de Klein, Luo, Woodward, Styles, Wise, Lindsey and Cox2014) found that EF3 was independent of the urine-N application rate in a study conducted at the same site as this study. Kelliher et al. (Reference Kelliher, Li and Nobel2014) found a linear relationship between cumulative N2O emissions and N application rate when applying urea to soil at rates up to 1500 kg N/ha. The emission factor for dung from the sheep fed ryegrass (0.03%) was not significantly different from that for dung from the sheep fed forage rape (0.08%; P>0.05). As observed in other experiments (e.g. Luo et al., Reference Luo, Hoogendoorn, van der Weerden, Saggar, de Klein, Giltrap, Rollo and Rys2013), the N2O emission factor for sheep dung was much lower than that for sheep urine. The cumulative emissions were higher for the urine from the sheep fed ryegrass than from the sheep fed forage rape (Table 3). In the field, urine volumes and N concentrations vary and sometimes urine and dung are deposited together. Therefore, real emissions may differ from those in this plot study. A field scale study would be required to determine the range of N2O emissions occurring in practice. However, this study presents evidence that forage can be used as a mitigation technology for reducing N2O emission from grazing systems.
Conclusions
In terms of per unit of N intake, the amount of N excreted by sheep was lower from dung, but not from urine, when the sheep were fed forage rape, in comparison with perennial ryegrass. Over the 3-month N2O measurement period, it was found that feeding of forage rape reduced EF3 for sheep urine by about 60%, compared with feeding ryegrass. The findings from this study are important for assessing diet effects on N2O emissions per animal. However, before any potential mitigation measure can be claimed or recommended further longer-term field experiments need to be conducted to determine whether the EF3 for urine from animals fed forage rape is similar when applied to a forage rape soil and a pasture soil and the results of the current study must be evaluated in the context of a whole farm system. Further study would also be required to investigate the interactions between urine application volume and N loading rate. Furthermore, field experiments under different climate and soil conditions need to be conducted for the confirmation of these findings and the mechanisms behind the effects observed in the present study need to be explored.
Acknowledgments
This study was supported by the Ministry for Primary Industries of New Zealand under the Sustainable Land Management and Climate Change research programme and by the New Zealand Pastoral Greenhouse Gas Research Consortium.