Introduction
Boosting physical activity and reducing sedentary behavior are increasingly well-recognized as public health priorities owing to their impact on both physical and mental health (Penedo & Dahn, Reference Penedo and Dahn2005; Warburton et al. Reference Warburton, Nicol and Bredin2006; Ströhle, Reference Ströhle2009; WHO, 2009; Lee et al. Reference Lee, Shiroma, Lobelo, Puska, Blair and Katzmarzyk2012; Mammen & Faulkner, Reference Mammen and Faulkner2013; Teychenne et al. Reference Teychenne, Costigan and Parker2015). Physical activity can be conceptualized in different ways. Physical activity may be intentional or coincidental; participation in sports (exercise) involves structured leisure activity and is distinct from general physical activity, which is broader and encompasses all activity across domestic, occupational and leisure domains (Salmon, Reference Salmon2001). Sedentary behavior, or time spent sitting, is a distinct phenotype; even someone who meets recommended levels of physical activity may be considered to have a sedentary lifestyle if they sit for prolonged periods each day (Owen et al. Reference Owen, Healy, Matthews and Dunstan2010).
In general community samples, low sports participation, low general physical activity and high sedentary behavior are cross-sectionally associated with higher depressive or anxious symptoms (Penedo & Dahn, Reference Penedo and Dahn2005; Teychenne et al. Reference Teychenne, Ball and Salmon2008, Reference Teychenne, Ball and Salmon2010, 2015). This association is also reflected in psychiatric populations (Goodwin, Reference Goodwin2003; Daumit et al. Reference Daumit, Goldberg, Anthony, Dickerson, Brown, Kreyenbuhl, Wohlheiter and Dixon2005; Ströhle, Reference Ströhle2009; Everson-Hock et al. Reference Everson-Hock, Green, Goyder, Copeland, Till, Heller and Hart2016). Exercise-based interventions have been investigated as a possible treatment for psychopathology. Although high-quality evidence is somewhat limited to date, meta-analyses suggest some positive clinical effects for depression (Cooney et al. Reference Cooney, Dwan, Greig, Lawlor, Rimer, Waugh, McMurdo and Mead2013; Schuch et al. Reference Schuch, Vancampfort, Richards, Rosenbaum, Ward and Stubbs2016b ), with a few studies also indicating benefits for anxiety (Opdenacker & Boen, Reference Opdenacker and Boen2008; Herring et al. Reference Herring, Jacob, Suveg, Dishman and O'Connor2012).
Although there is strong cross-sectional evidence, there is less research regarding bi-directional relationships between depression or anxiety disorders and physical activity indicators naturalistically over time, particularly for sedentary behavior. Prospective studies published to date have mostly focused on the effect of physical activity on the onset of depressive symptoms among the general community, and typically use a threshold on a self-report questionnaire to define depression, rather than a clinical interview that assesses depression against DSM-based symptom, duration and functional impairment criteria. These studies indicate that being physically active, even at low levels, may reduce the risk of depressive symptom onset over time (Mammen & Faulkner, Reference Mammen and Faulkner2013). Fewer studies investigate the reverse direction as to whether baseline depression is associated with physical activity outcomes into the future, despite this being important for understanding the long-term health consequences of psychopathology.
Another major limitation of the extant literature is that far fewer prospective studies examine relationships between physical activity indicators and anxiety disorder specifically, and the findings regarding anxiety symptoms to date have been mixed (De Moor et al. Reference De Moor, Boomsma, Stubbe, Willemsen and de Geus2008; Sanchez-Villegas et al. Reference Sanchez-Villegas, Ara, Guillén-Grima, Bes-Rastrollo, Varo-Cenarruzabeitia and Martínez-González2008; Ten Have et al. Reference Ten Have, de Graaf and Monshouwer2011; Brunes et al. Reference Brunes, Gudmundsdottir and Augestad2014; Kang et al. Reference Kang, Bae, Kim, Shin, Yoon and Kim2016). Anxiety is a common and significant mental health problem at both subclinical and clinical levels. It is also highly co-morbid with depression. Despite emerging evidence, we still know little about the naturalistic longitudinal associations between the presence of anxiety disorders, both separately from and in conjunction with depressive disorders, and physical activity indicators.
The current study utilizes four waves of longitudinal data collected over 6 years from a cohort of people with anxiety and/or depressive disorders and healthy controls. It expands knowledge on longitudinal relationships between psychopathology and levels of physical activity across three indicators (sports participation, general physical activity and sedentary behavior), particularly for anxiety disorders, which have been less frequently examined. Concurrently examining multiple activity indicators to see whether patterns across the indicators are consistent is an important innovation, since indicators are generally considered separately. Understanding the consistency across indicators may help to shape public health messaging regarding the link between activity behavior and mental health. We investigated whether lower physical activity according to multiple indicators was consistently associated with psychopathology diagnosis or greater psychopathology symptoms during assessments at baseline and after 2, 4, and 6 years. We also examined whether psychopathology at one assessment predicted indicators of low activity at the next assessment and vice versa.
Method
Participants and procedures
Participants were from the Netherlands Study of Depression and Anxiety (NESDA), a prospective cohort study of 2981 adults with and without anxiety and depressive disorders (18–65 years old). Detailed study rationale, design and methods have been published elsewhere (Penninx et al. Reference Penninx, Beekman, Smit, Zitman, Nolen, Spinhoven, Cuijpers, De Jong, Van Marwijk, Assendelft, van der Meer, Verhaak, Wensing, de Graaf, Hoogendijk, Ormel and van Dyck2008). Briefly, between September 2004 and February 2007, participants were recruited from the community, primary care and specialized mental health care. Exclusion criteria were lack of fluency in Dutch or a primary diagnosis of psychosis, obsessive compulsive disorder, bipolar disorder or severe addiction. Participants completed self-report questionnaires, a detailed interview and a physical examination. After 2, 4 and 6 years, participants were re-assessed for the key measures used in the current study: psychopathology, physical activity indicators, and covariates (sociodemographic, health and lifestyle characteristics). All participants provided written informed consent and all procedures were approved by institutional ethical review boards.
Retention of baseline participants was high across the three follow-up assessments (86.8%, 80.1% and 75.7%, respectively). No or marginal differences were observed between those who completed all four assessments compared to those who were missing for one or more assessments with regard to socio-demographic characteristics, general health characteristics and physical activity levels. However, people with greater symptoms or current psychopathology at baseline were more likely to be missing for at least one follow-up assessment.
Measures
Psychopathology
Participants completed validated self-report measures of depression and anxiety symptoms severity: the 30-item Inventory of Depressive Symptomatology (IDS; Rush et al. Reference Rush, Giles, Schlesser, Fulton, Weissenburger and Burns1986, Reference Rush, Gullion, Basco, Jarrett and Trivedi1996) and the 21-item Beck Anxiety Inventory (BAI; Beck et al. Reference Beck, Epstein, Brown and Steer1988). Participants also completed the WHO Composite International Diagnostic Interview (CIDI, version 2.1) to derive lifetime and 6-month DSM-IV diagnoses of major depressive disorder, dysthymia, social phobia, panic disorder, agoraphobia, and generalized anxiety disorder. From these diagnoses, participants were classified at each wave as having: (a) current anxiety and/or depressive disorder in the previous 6 months; (b) remitted anxiety or depressive disorder (disorder >6 months prior); or (c) no lifetime history of anxiety or depression.
Physical activity indicators
Physical activity indicators were defined in three ways: sports participation, general physical activity and sedentary behavior. As part of a social activity scale (Van Rijsselt, Reference Van Rijsselt, Deeg and Westendorp-de Serière1994), participants were asked for their frequency of participating in organized sport activity outside the home on a 6-point scale (1, ‘almost never’; 2, ‘a couple of times a year’; 3, ‘every month’; 4, ‘a couple of times a month’; 5, ‘every week’; 6, ‘a couple of times a week’). Levels of general physical activity and sedentary behavior were derived from responses to the short-form International Physical Activity Questionnaire (IPAQ; Ainsworth et al. Reference Ainsworth, Bassett, Strath, Swartz, O'Brien, Thompson, Jones, Macera and Kimsey2000; Craig et al. Reference Craig, Marshall, Sjöström, Bauman, Booth, Ainsworth, Pratt, Ekelund, Yngve, Sallis and Oja2003). The short-form IPAQ asks participants how much vigorous activity, moderate activity, walking or sitting they did for work or recreation in the past 7 days. Responses regarding minutes of vigorous, moderate and walking activity in the past week were used to calculate an overall level of general physical activity, weighted by the intensity of the activity, expressed as metabolic equivalent total (MET) minutes per week (MET level×minutes of activity×events per week). Sedentary behavior was derived from a single question regarding average hours of sitting on a weekday. Weekday, rather than weekend, sitting time is thought to be better representative of overall sedentary behavior patterns (Craig et al. Reference Craig, Marshall, Sjöström, Bauman, Booth, Ainsworth, Pratt, Ekelund, Yngve, Sallis and Oja2003).
Covariates
Covariates included socio-demographic, lifestyle and physical health characteristics, namely self-reported responses regarding age, gender, years of education, income, smoking status (current smoker or not), alcohol use category as derived from the number of alcoholic drinks per week recorded in the AUDIT (Saunders et al. Reference Saunders, Aasland, Babor, de la Fuente and Grant1993) [no use (0 drinks per week), moderate use (1–21 for males, 1–14 for females), heavy use (>21 for males, >14 for females)], and number of physical health conditions (0–12 conditions: heart diseases, arthritis, intestinal diseases, pulmonary conditions, diabetes, stroke, cancer, ulcer, liver disease, epilepsy, thyroid disease, other diseases), as well as objectively-measured body mass index (BMI). These covariates were selected as they have an established theoretical association with psychopathology and with physical activity levels, and have been regularly used in similar studies. Although many of the participants were using pharmacological or psychological treatment, treatment was not entered as a covariate since this is an indicator of illness severity (confounding by indication) and so could be considered an overcorrection.
Statistical analysis
To retain maximal sample size, all participants with data available for at least one outcome were included in the analyses (N = 9463 observations). Two of the response categories for sport participation were collapsed due to disproportionately fewer responses compared with the other categories (‘every month’ and ‘multiple times a month’) to form a 5-point ordinal scale. Z scores (mean = 0, s.d. = 1) of BAI and IDS scores were calculated and used in all analyses.
For data exploration, descriptive statistics for characteristics across the baseline, 2-, 4- and 6-year assessments and Pearson's correlations between the three activity measures at baseline were computed. To assess the trajectory of the activity indicators and symptoms over the four assessment waves, time (either continuous or categorical with baseline as the reference category) was entered as a predictor of sports participation, general physical activity, sedentary behavior, IDS or BAI in generalized estimating equations (GEE) with exchangeable correlation structure.
GEE analyses with exchangeable correlation structure were performed to examine the consistency of associations between psychopathology and activity indicators across the baseline, 2-, 4- and 6-year assessments. Categorical time (reference category: baseline), time-varying covariates, and either continuous symptom severity or psychopathology diagnosis category (reference category: healthy controls) were entered as main effects, with activity indicator (sports participation, general physical activity or sedentary behavior) entered as the outcome. An ordinal logistic model was used for sports participation since this scale had a limited number of ordered categories with a uniform distribution, violating Gaussian assumptions. Gaussian models were used for general physical activity and sedentary behavior. In addition to the main effects model, we also tested the interaction between the time and psychopathology to assess whether the associations between psychopathology and activity indicators were consistent over assessments.
Autoregression time-lag GEE models with an independence correlation structure were conducted to examine whether psychopathology at one ‘index’ assessment (t) predicted levels of activity indicators at the subsequent assessment 2 years later (t + 1), adjusting for activity indicators and covariates at t, and time (reference category: baseline to 2-year comparison). The reverse direction was also examined in similar GEE models to see whether activity indicators at t predicted psychopathology at t + 1, controlling for psychopathology and covariates at t, and time. Sport participation was entered as a continuous predictor since patterns across the five ordinal categories were consistent with a linear association. In analyses predicting psychopathology diagnosis at t + 1, psychopathology was coded as a binary variable of disorder absent (healthy controls or remitted) or present (current anxiety, depression or co-morbid disorders) to retain sample size. Effect modification of activity indicators at t by psychopathology diagnosis status at t was tested with an interaction term. Analyses stratified by psychopathology diagnosis at the index assessment were conducted when appropriate.
Finally, GEE analyses with an independence structure were conducted to assess whether the change in psychopathology severity from one assessment to the next was associated with the change in activity indicators, controlling for covariates and time.
GEE analyses were completed using R statistical language with the ‘gee’ package for continuous or binary outcomes (Carey, Reference Carey2015) and ‘multgee’ package for ordinal outcomes (Touloumis, Reference Touloumis2015).
Ethical standards
The authors assert that all procedures contributing to this work comply with the ethical standards of the relevant national and institutional committees on human experimentation and with the Helsinki Declaration of 1975, as revised in 2008.
Results
Descriptive characteristics
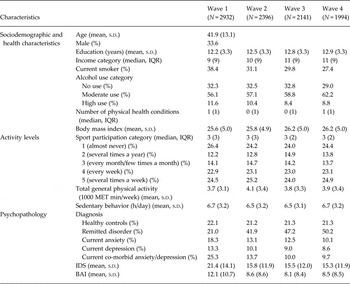
At baseline, participants were on average 42 years old with 12 years of education, 34% were male, and they were generally relatively healthy besides high smoking rates (Table 1). Of participants, 61.5% were involved in organized sports activity at least monthly. Mean general physical activity was around 4000 MET min/week and sedentary behavior per day was around 6.5 h.
Descriptive characteristics

IQR, Interquartile range; MET, metabolic equivalent total; IDS, Inventory of Depressive Symptomatology; BAI, Beck Anxiety Inventory.
At baseline, sports participation had a small, statistically significant correlation with general physical activity (r = 0.14, p < 0.001) and sedentary behavior (r = −0.06, p < 0.001). There was a larger correlation between general physical activity and sedentary behavior (r = −0.33, p < 0.001). However, the association was still only moderate in size, indicating that the three indicators of activity capture unique aspects.
In assessing the patterns in activity indicators over time, participation in sports remained relatively consistent across the assessments (p > 0.05), whereas general physical activity increased over time (trend over time β = 0.05, robust s.e. = 0.03, p = 0.01) and sedentary behavior decreased between baseline and the first follow-up assessment (β = −0.15, robust s.e. = 0.06, p = 0.01). The proportion of participants with current anxiety and/or depressive disorders and the severity of anxiety and depressive symptoms decreased across assessments, with the greatest decline in symptoms after the first follow-up assessment (BAI: β = −0.31, robust s.e. = 0.02, p < 0.001; IDS: β = −0.39, robust s.e. = 0.02, p < 0.001).
Associations between psychopathology and activity indicators across assessment waves
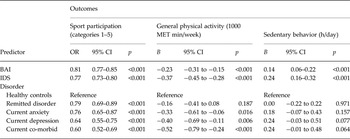
There were significant associations between physical activity indicators and psychopathology, with associations marginally larger for depression than anxiety and largest for co-morbid anxiety and depression (Table 2). Lower levels of sport participation and general physical activity were observed for people with higher or increasing anxiety and depression severity, as well as those with current anxiety and/or depression compared with healthy controls. Lower sports participation was also observed for those with remitted anxiety or depression. Diagnosis was not significantly associated with sedentary behavior, although greater or increasing severity of anxiety or depression symptoms was associated with greater sedentary behavior. These associations between symptom severity and sedentary behavior remained statistically significant after additionally controlling for general physical activity (BAI: B = 0.10, s.e. = 0.04, p = 0.014; IDS: B = 0.16, s.e. = 0.04, p < 0.001). There were no consistent interactions between psychopathology and assessment wave, indicating that associations were generally consistent in strength across the four assessments.
Associations between psychopathology and physical activity indicators across four assessment waves

MET, Metabolic equivalent total; OR, odds ratio; CI, confidence interval; BAI, Beck Anxiety Inventory; IDS, Inventory of Depressive Symptomatology.
GEE analyses adjusted for time, sex, age, education, income, body mass index, number of diseases, alcohol use and smoking.
Sport participation is a 5-point ordinal scale from lowest to highest level.
BAI and IDS scores are standardized.
Psychopathology at the index assessment and activity outcomes 2 years later
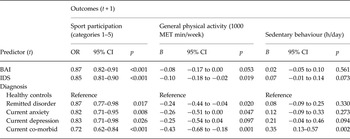
Table 3 shows the associations between psychopathology at an index assessment and activity indicators at the next assessment 2 years later, controlling for levels of activity at the index assessment. There was a dose-response relationship whereby increased anxiety or depression severity at one assessment was associated with decreased sports participation at the next assessment. Additionally, compared with healthy controls, those with current or remitted anxiety and/or depression at the index assessment had decreased sports participation at the next assessment. Similar associations were observed between greater psychopathology symptom severity or diagnosis at the index assessment and lower general physical activity after 2 years, although the results for current depressive disorder did not reach statistical significance at p < 0.05. There was less evidence that psychopathology indicators at the index assessment were associated with sedentary behavior at the next assessment; however, there was a strong, significant association indicating that people with co-morbid anxiety and depression, compared with healthy controls, had increased sedentary behavior at the next assessment. This effect remained statistically significant after additionally controlling for general physical activity at the index assessment (B = 0.32, s.e. = 0.12, p = 0.006).
Associations between psychopathology predictors at one assessment (t) and activity outcomes at the subsequent assessment 2 years later (t + 1)

MET, metabolic equivalent total; OR, odds ratio; CI, confidence interval; BAI, Beck Anxiety Inventory; IDS, Inventory of Depressive Symptomatology.
Autoregression GEE analyses adjusted for time, sex, age, education, income, body mass index, number of diseases, alcohol use, smoking and activity at t.
Sport participation is a 5-point ordinal scale from lowest to highest level.
IDS and BAI scores are standardized.
Activity levels at the index assessment and psychopathology outcomes 2 years later
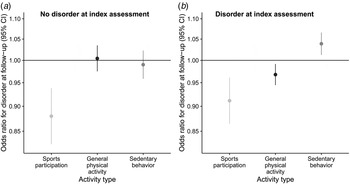
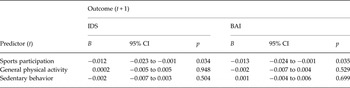
Only greater sports participation, but not other activity indicators, at the index assessment was associated with lower anxiety and depression severity 2 years later (Table 4). In predicting diagnosis at t + 1, there was a significant interaction between diagnosis at t and both general physical activity and sedentary behavior at t. This indicates that the association between activity at t and diagnosis at t + 1 differed depending on the absence or presence of diagnosis at t, consistent with an interpretation of the two effects as ‘onset’ for those without a disorder at t and ‘chronicity’ among those with a disorder at t. Overall, effects were greater for chronicity than onset of disorder. Among those without a disorder at the index assessment, greater sports participation, but not general physical activity or sedentary behavior, at one assessment was associated with reduced odds of having a disorder at the next assessment (p < 0.001; Fig. 1 a). In contrast, among those with a disorder at t, there was reduced risk of continued disorder at t + 1 for those with greater sports participation, greater general physical activity or lower sedentary behavior at t (p < 0.001, p = 0.004, p = 0.002, respectively; Fig. 1 b).
Odds ratios (95% confidence intervals, CI) for having a disorder compared with not having a disorder after 2 years for a 1-unit increase in sports participation, general physical activity and sedentary behavior. Analyses are stratified by disorder status at baseline. (a) Indicates onset of disorder among people without a disorder at baseline; (b) indicates continued disorder among people with a disorder (‘chronicity’).

Associations between physical activity indicators at one assessment (t) and psychopathology symptom severity at the subsequent assessment 2 years later (t + 1)

IDS, Inventory of Depressive Symptomatology; BAI, Beck Anxiety Inventory; CI, confidence interval.
Autoregression GEE analyses adjusted for time, sex, age, education, income, body mass index, number of diseases, alcohol use, smoking and psychopathology indicator at t.
Sport participation is a 5-point ordinal scale from lowest to highest level, treated as a continuous variable for these analyses.
IDS and BAI scores are standardized.
Changes in psychopathology severity and change in activity
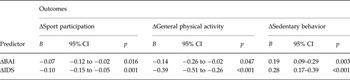
Finally, increases in symptom severity between two assessments were associated with significantly reduced sports participation, reduced general physical activity and increased sedentary behavior (Table 5). The association between change in symptom severity and sedentary behavior remained statistically significant after additionally controlling for general physical activity change (BAI: B = 0.17, s.e. = 0.07, p = 0.009; IDS: B = 0.21, s.e. = 0.07, p = 0.002).
Associations between the change in psychopathology severity score and the change in activity over 2 years

CI, Confidence interval; BAI, Beck Anxiety Inventory; IDS, Inventory of Depressive Symptomatology.
GEE analyses adjusted for time, sex, age, education, income, body mass index, number of diseases, alcohol use, and smoking.
BAI and IDS scores are standardized.
Discussion
There were bi-directional longitudinal associations between greater psychopathology and lower physical activity according to multiple indicators, most prominently low sports participation. Effects were present for both anxiety and depression. Those with co-morbid disorders were most adversely affected. People with a diagnosis or higher symptoms of anxiety or depression were less likely to engage in sports or general physical activity. Those with greater symptoms also had greater levels of sedentary behavior. Over time, greater symptom severity or diagnosis was associated with lower sports participation and general physical activity 2 years later. In the opposite direction, only low sports participation was associated with greater symptom severity and increased odds of disorder onset 2 years later. Stronger effects were observed for chronicity, with poorer behavior in all activity indicators increasing the odds of disorder chronicity after 2 years.
We observed relatively consistent evidence that psychopathology at one assessment was associated with enduring negative effects on activity indicators 2 years later. This direction of the psychopathology-activity relationship is far less frequently examined than the opposite direction. Our results align with several studies that observed higher baseline anxiety or depression scores associated with decreasing physical activity over time (Lindwall et al. Reference Lindwall, Larsman and Hagger2011; Azevedo Da Silva et al. Reference Azevedo Da Silva, Singh-Manoux, Brunner, Kaffashian, Shipley, Kivimäki and Nabi2012; Gudmundsson et al. Reference Gudmundsson, Lindwall, Gustafson, Östling, Hällström, Waern and Skoog2015) or a shift from active to inactive patterns over time (Panagiotakos et al. Reference Panagiotakos, Pitsavos, Lentzas, Skoumas, Papadimitriou, Zeimbekis and Stefanadis2008; Patten et al. Reference Patten, Williams, Lavorato and Eliasziw2009). We extend this previous work to show similar patterns for clinically diagnosed anxiety and depression. These findings may have substantial implications for the ongoing health of people after their acute anxiety or depressive episode resolves. The importance of this conclusion is further emphasized in the observation that the odds of anxiety and depression chronicity were increased among people with low activity according to all indicators. Thus, there may be an ongoing reciprocal cycle between poor mental health and low activity levels.
Effects were particularly consistent for sports participation, compared with other physical activity indicators. The systematic review of Teychenne et al. (Reference Teychenne, Ball and Salmon2008) implies a similar conclusion, describing stronger evidence for an association between lower depressive symptoms and greater intensity of activity or leisure-time physical activity. This differential effect highlights that the intrinsic psychological factors that differentiate sports participation from the more heterogeneous indicator of general physical activity may be important mechanisms underlying the associations between psychopathology and physical activity levels. Such factors may include organization skills, social participation, motivation for initiation and continuation, and self-efficacy (Wilson et al. Reference Wilson, Sabiston, Mack and Blanchard2012; Krämer et al. Reference Krämer, Helmes, Seelig, Fuchs and Bengel2014; Scarapicchia et al. Reference Scarapicchia, Sabiston, O'Loughlin, Brunet, Chaiton and O'Loughlin2014). General self-efficacy may be a particularly important factor, since previous studies show it mediates associations between physical activity indicators and psychological characteristics (Cairney et al. Reference Cairney, Faulkner, Veldhuizen and Wade2009; Ebstrup et al. Reference Ebstrup, Aadahl, Eplov, Pisinger and Jørgensen2013) and it improves with physical activity intervention (Opdenacker & Boen, Reference Opdenacker and Boen2008). In addition to psychosocial factors, biological factors such as levels of inflammation, neurotrophin and neurotransmitters, may also play a role in the relationship between psychopathology and physical activity indicators, particularly in higher intensity activities (Wipfli et al. Reference Wipfli, Landers, Nagoshi and Ringenbach2011; Eyre & Baune, Reference Eyre and Baune2012; Medina et al. Reference Medina, Jacquart and Smits2015; Schuch et al. Reference Schuch, Deslandes, Stubbs, Gosmann, Silva and Fleck2016a ). For instance, exercise may reduce inflammation and oxidative stress – two mechanisms thought to be involved in the pathophysiology of psychopathology – through various pathways, including via the regulation of microglia, regulation of pro-inflammatory macrophages, upregulation of neuroprotective factors such as CXCL1, and reduction in adipocyte-inducing visceral fat (Eyre & Baune, Reference Eyre and Baune2012). Furthermore, rather than a direct causal pathway, the association between exercise and mental health may be explained by common underlying factors. Meta-analyses indicate that low physical activity is associated with personality traits such as higher neuroticism, and lower extraversion and conscientiousness (Wilson & Dishman, Reference Wilson and Dishman2015; Sutin et al. Reference Sutin, Stephan, Luchetti, Artese, Oshio and Terracciano2016), which are traits also associated with anxiety, depression and substance misuse (Kotov et al. Reference Kotov, Gamez, Schmidt and Watson2010). There is also twin-study evidence against a direct causal pathway between lack of exercise and poor mental health, rather suggesting these traits derive from a common genetic vulnerability (De Moor et al. Reference De Moor, Boomsma, Stubbe, Willemsen and de Geus2008).
Overall, there was a relative lack of significant findings to indicate longitudinal relationships between sedentary behavior and anxiety or depression, compared with sports participation and general physical activity. Previous cross-sectional studies and a limited number of longitudinal studies also show mixed findings with regard to sedentary behavior (see reviews Teychenne et al. Reference Teychenne, Ball and Salmon2010, Reference Teychenne, Costigan and Parker2015). Furthermore, cross-sectional studies comparing both activity types indicate physical activity may more strongly associated with mental health than sedentary behavior (Van Uffelen et al. Reference Van Uffelen, Van Gellecum, Burton, Peeters, Heesch and Brown2013; Liao et al. Reference Liao, Shibata, Ishii and Oka2015). One reason for this may be that psychosocial factors behind engaging in sedentary behavior could have both positive and negative implications for mental health. Generally, weekday sedentary behavior is often highly correlated with occupational sedentary behavior, and employment is generally associated with better mental health. Sedentary behavior is also associated with a lack of motivation, social disengagement or displacement of physical activity, which are factors associated with poor mental health. Alternatively, certain symptoms that characterize particular anxiety disorders or subtypes of depression may drive associations with sedentary behavior. For instance, cross-sectional research indicates that people with agoraphobia and panic disorder may be particularly prone to higher sedentary behavior (De Wit et al. Reference De Wit, van Straten, Lamers, Cuijpers and Penninx2011). Assessing sedentary behavior in heterogeneous cohorts, as done in this study, may mask results that may be observed for more homogeneous characterizations of the disorders.
The main limitation of the current study is the lack of objective measures of physical activity. In questionnaire-based assessment of physical activity, participants may over- or under-estimate their activity levels. This is a particular risk when behaviors are measured by single items, as was the case for sports participation and sedentary behavior in this study. Furthermore, ‘sports’ constitute activities of various intensities and modalities, which could introduce heterogeneity in the outcome. Future studies would benefit from objective GPS or accelerometry-based measurement, which can indicate both activity duration and intensity, or ecological momentary assessment, which can additionally capture characteristics such as social interaction or mood during the activity. These methods would allow a more fine-grained assessment of behavior and capture aspects of activity including breaking up prolonged periods of sitting with time standing or moving, which is associated with improved health parameters and recommended in several current health guidelines (Healy et al. Reference Healy, Dunstan, Salmon, Cerin, Shaw, Zimmet and Owen2008). These methods are better able to capture whether particular intensity, regularity or patterns of activity are needed to effect change in psychopathology. Other limitations include selective drop-out of people with more severe psychopathology at baseline, but in fact this may suggest that our results provide conservative estimates. Residual confounding is also possible, however, sensitivity analyses excluding cases of pregnant women (N = 141) or adjusting for additional possible covariates (having children living at home, having a current partner, and being currently employed) did not change the results. Finally, we conducted multiple tests for each hypothesis, which may have inflated the Type 1 error rate. Nevertheless, our primary aim was to interpret the overall pattern of results and not necessarily the outcomes of specific individual tests. Most effects we did interpret were consistent and strong (p < 0.001) and remain statistically significant even after conservative Bonferroni correction of 0.008 was applied [correcting α = 0.05 for nine tests (three predictors by three outcomes) with an average correlation of 0.15 between activity measures].
The main strength of the current study is that it was conducted in a large cohort oversampled for people with anxiety and depressive disorders. This permitted the investigation of previously underexplored research questions regarding the differential association of physical activity indicators with anxiety and depression diagnoses, independently and co-morbidly, over time. With four follow-up measurements evenly spaced over 6 years conducted in this large cohort, we could well-characterize temporal effects, taking into account key time-varying covariates. Reporting three different indicators of physical activity simultaneously also helps to better characterize the relationships between physical activity and psychopathology.
The current study highlights the close associations of anxiety and depressive disorders with indicators of physical activity, particularly sports participation, over time. The observation of low physical activity, in conjunction with other aspects of unhealthy lifestyle such as poor diet quality, alcohol consumption and smoking, has been used to explain why people with psychopathology may be at elevated risk of cardiovascular and other chronic disease, as well as exhibit many of the underlying physiological risk factors for disease (Hamer et al. Reference Hamer, Molloy, de Oliveira and Demakakos2009; Duivis et al. Reference Duivis, Vogelzangs, Kupper, De Jonge and Penninx2013; Lopresti et al. Reference Lopresti, Hood and Drummond2013; Moylan et al. Reference Moylan, Eyre, Maes, Baune, Jacka and Berk2013; Van Reedt Dortland et al. Reference Van Reedt Dortland, Vreeburg, Giltay, Licht, Vogelzangs, Van Veen, De Geus, Penninx and Zitman2013; Hiles et al. Reference Hiles, Baker, de Malmanche, McEvoy, Boyle and Attia2015). Physical activity may have additional benefits in people with common mental health problems in buffering against associated negative outcomes, such as health-related quality of life (Patten et al. Reference Patten, Williams, Lavorato and Bulloch2013), negative life events, or physical diseases (Harris et al. Reference Harris, Cronkite and Moos2006). We still know little about whether a certain intensity, regularity or mode of activity can elicit change in psychopathology, or whether psychopathology selectively influences certain activity behaviors. The current study suggests that maximum benefit for public health may be seen with greater intensity of physical activity or community-based and organized interactions. Alternatively, it is likely there are particular underlying mechanisms that account for both mental health and activity behavior. As the temporal associations between physical activity indicators and diagnosis of anxiety and depression become better characterized using more detailed measurement techniques, future research will benefit from a closer examination of the mechanisms behind the relationship. For instance, assessing relative weight of physiological and psychosocial factors, informed partly by the differential effects for sports participation and general physical activity observed in the current study. Perhaps it is these mechanisms that can be exploited for joint improvement of physical and mental health.
Acknowledgements
The infrastructure for the NESDA study (www.nesda.nl) is funded through the Geestkracht program of The Netherlands Organisation for Health Research and Development (ZonMW, Grant No. 10-000-1002) and is supported by participating universities and mental health care organizations [VU University Medical Center, GGZ inGeest, Arkin, Leiden University Medical Center, GGZ Rivierduinen, University Medical Center Groningen, Lentis, GGZ Friesland, GGZ Drenthe, IQ Healthcare, Netherlands Institute for Health Services Research, and Netherlands Institute of Mental Health and Addiction (Trimbos)]. S.A.H. received funding from the European Union's Horizon 2020 research and innovation programme under the Marie Sklodowska-Curie grant agreement No. 658897. F.L. received funding from the European Union Seventh Framework Programme (FP7/2007-2013) under grant agreement no. PCIG12-GA-2012-334065. The work of B.W.J.H.P. was supported through a NWO-VICI grant (no. 91811602).
Declaration of Interest
B.W.J.H.P. has received research funding from Janssen Research, outside the submitted work.