1 Introduction
Soap film channels have been used as model systems for two-dimensional flow for many years (Couder, Chomaz & Rabaud Reference Couder, Chomaz and Rabaud1989; Kellay, Wu & Goldburg Reference Kellay, Wu and Goldburg1995; Martin et al. Reference Martin, Wu, Goldburg and Rutgers1998; Rutgers Reference Rutgers1998; Vorobieff & Ecke Reference Vorobieff and Ecke1999; Jun & Wu Reference Jun and Wu2005; Jung et al. Reference Jung, Mareck, Shelley and Zhang2006; Tran et al. Reference Tran, Chakraborty, Guttenberg, Prescott, Kellay, Goldburg, Goldenfeld and Gioia2010; Kim & Wu Reference Kim and Wu2015). However, their recent exploitation is expanding in the third dimension. For example, impingement of solid objects (Courbin et al. Reference Courbin, Marchand, Vaziri, Ajdari and Stone2006; Courbin & Stone Reference Courbin and Stone2006; Le Goff et al. Reference Le Goff, Courbin, Stone and Quere2008), liquid drops (Do-Quang et al. Reference Do-Quang, Geyl, Stemme, van der Wijngaart and Amberg2010; Kim & Wu Reference Kim and Wu2010; Basu et al. Reference Basu, Yawar, Concha and Bandi2017) and gaseous jets (Salkin et al. Reference Salkin, Schmit, Panizza and Courbin2016) on soap films has been investigated. The deformation of the soap film accompanies the creation of extra surface area, which sometimes takes a substantial portion of the system energy. In this regard, it is critically important to know the surface tension and elasticity of the soap film in order to make the best energetic analysis. However, our understanding of this property is lacking.
The lack of measurement of the surface tension is due to the technical difficulties that arise from the fact that all existing techniques are not applicable to soap films. Some techniques (e.g. pendant drop methods) require the use of a bulk of liquid, whose surface tension is not necessarily equal to that of a soap film, and others (e.g. Du Noüy ring (Du Noüy Reference Du Noüy1925) or Wilhelmy plate method) are intrusive and rely on the formation of menisci, which significantly alter the local surface chemistry. Recent measurements (Adami & Caps Reference Adami and Caps2015) using deformable objects inserted into soap films are also not suitable if the flow speed of the film is comparable to the Marangoni wave speed (Kim & Mandre Reference Kim and Mandre2017).
In this work, we present a simple method to measure the surface tension of the flowing soap film. Our method is applicable to the common set-up of a flowing soap film channel (Rutgers, Wu & Daniel Reference Rutgers, Wu and Daniel2001) without any additional instrumentation except for a camera. We use the fact that these conventional soap films consist of two flexible nylon wires serving as two-dimensional channel walls. These flexible wires are tensed by hanging a known weight and curve inwards by the surface tension of the soap film. The measurement of the surface tension is made possible by measuring the bending curvature and the applied tension.
We present our measurement of the surface tension of soap films of different thicknesses and concentrations of soap solution. The thickness of the film is varied from
 $1~\unicode[STIX]{x03BC}\text{m}$
to
 $10~\unicode[STIX]{x03BC}\text{m}$
, and three different soap concentrations, 0.5 %, 1 % and 2 % (by volume), are used. Our measurements show that if the soap film is thick or made from 2 % solution, then it possesses a surface tension of
 $30~\text{mN}~\text{m}^{-1}$
. However, if the film is relatively thin or made from 0.5 % or 1 % solution, its surface tension has a greater value.
Our observation shows the apparent equivalence between the thinning and the dilution of the soap film. The surface tension
 $\unicode[STIX]{x1D70E}$
depends on the surface concentration
 $\unicode[STIX]{x1D6E4}$
of surfactants, i.e.,
 $\unicode[STIX]{x1D70E}=\unicode[STIX]{x1D70E}_{0}-\unicode[STIX]{x1D6FC}\unicode[STIX]{x1D6E4}$
, where
 $\unicode[STIX]{x1D70E}_{0}$
is the surface tension of pure liquid and
 $\unicode[STIX]{x1D6FC}$
is the proportionality constant (Couder et al.
Reference Couder, Chomaz and Rabaud1989; Alberty Reference Alberty1995). The fact that the thinner films possess higher
 $\unicode[STIX]{x1D70E}$
implies a smaller value of
 $\unicode[STIX]{x1D6E4}$
than in thicker films. Dilution of the soap concentration causes an equivalent effect that increases
 $\unicode[STIX]{x1D70E}$
.
We rationalize this observation using a quantitative theory based on the conservation equation for surfactants and Langmuir’s adsorption isotherm. First, in a patch of a soap film, the total number of surfactants is the sum of surfactants at the interfaces and those in the bulk between interfaces. This can be written in the form of the conservation law
 $$\begin{eqnarray}c_{0}=c+\frac{2\unicode[STIX]{x1D6E4}}{h},\end{eqnarray}$$
where
 $c_{0}$
is the concentration of the soap solution,
 $c$
is the concentration of interstitial surfactants and
 $h$
is the mean film thickness (the precise definition will be introduced later). Since
 $c$
and
 $c_{0}$
are measured as volume fractions, which are dimensionless, in our presentation
 $\unicode[STIX]{x1D6E4}$
has dimensions of length. Second, using Langmuir’s adsorption isotherm, the relation between
 $\unicode[STIX]{x1D6E4}$
and
 $c$
is formulated with two parameters
 $\unicode[STIX]{x1D6E4}_{\infty }$
and
 $c^{\ast }$
,
 $$\begin{eqnarray}\unicode[STIX]{x1D6E4}=\frac{\unicode[STIX]{x1D6E4}_{\infty }}{1+c^{\ast }/c}.\end{eqnarray}$$
Physically,
 $\unicode[STIX]{x1D6E4}_{\infty }$
is the concentration of surfactants when the surface is fully occupied by surfactants, and
 $c^{\ast }$
is the value of
 $c$
when
 $\unicode[STIX]{x1D6E4}=\unicode[STIX]{x1D6E4}_{\infty }/2$
. Using our measurement of
 $\unicode[STIX]{x1D70E}$
with respect to
 $c_{0}$
and
 $h$
, we estimate these two parameters
 $\unicode[STIX]{x1D6E4}_{\infty }$
and
 $c^{\ast }$
. Our analysis shows that this two-parameter model describes our system reasonably well. The two-parameter model also enables us to estimate the Gibbs elasticity for our soap film set-up.
2 Experimental method
2.1 Soap film set-up
We carry out the experiments using a standard soap film set-up, which is introduced and discussed in prior published work (Rutgers et al.
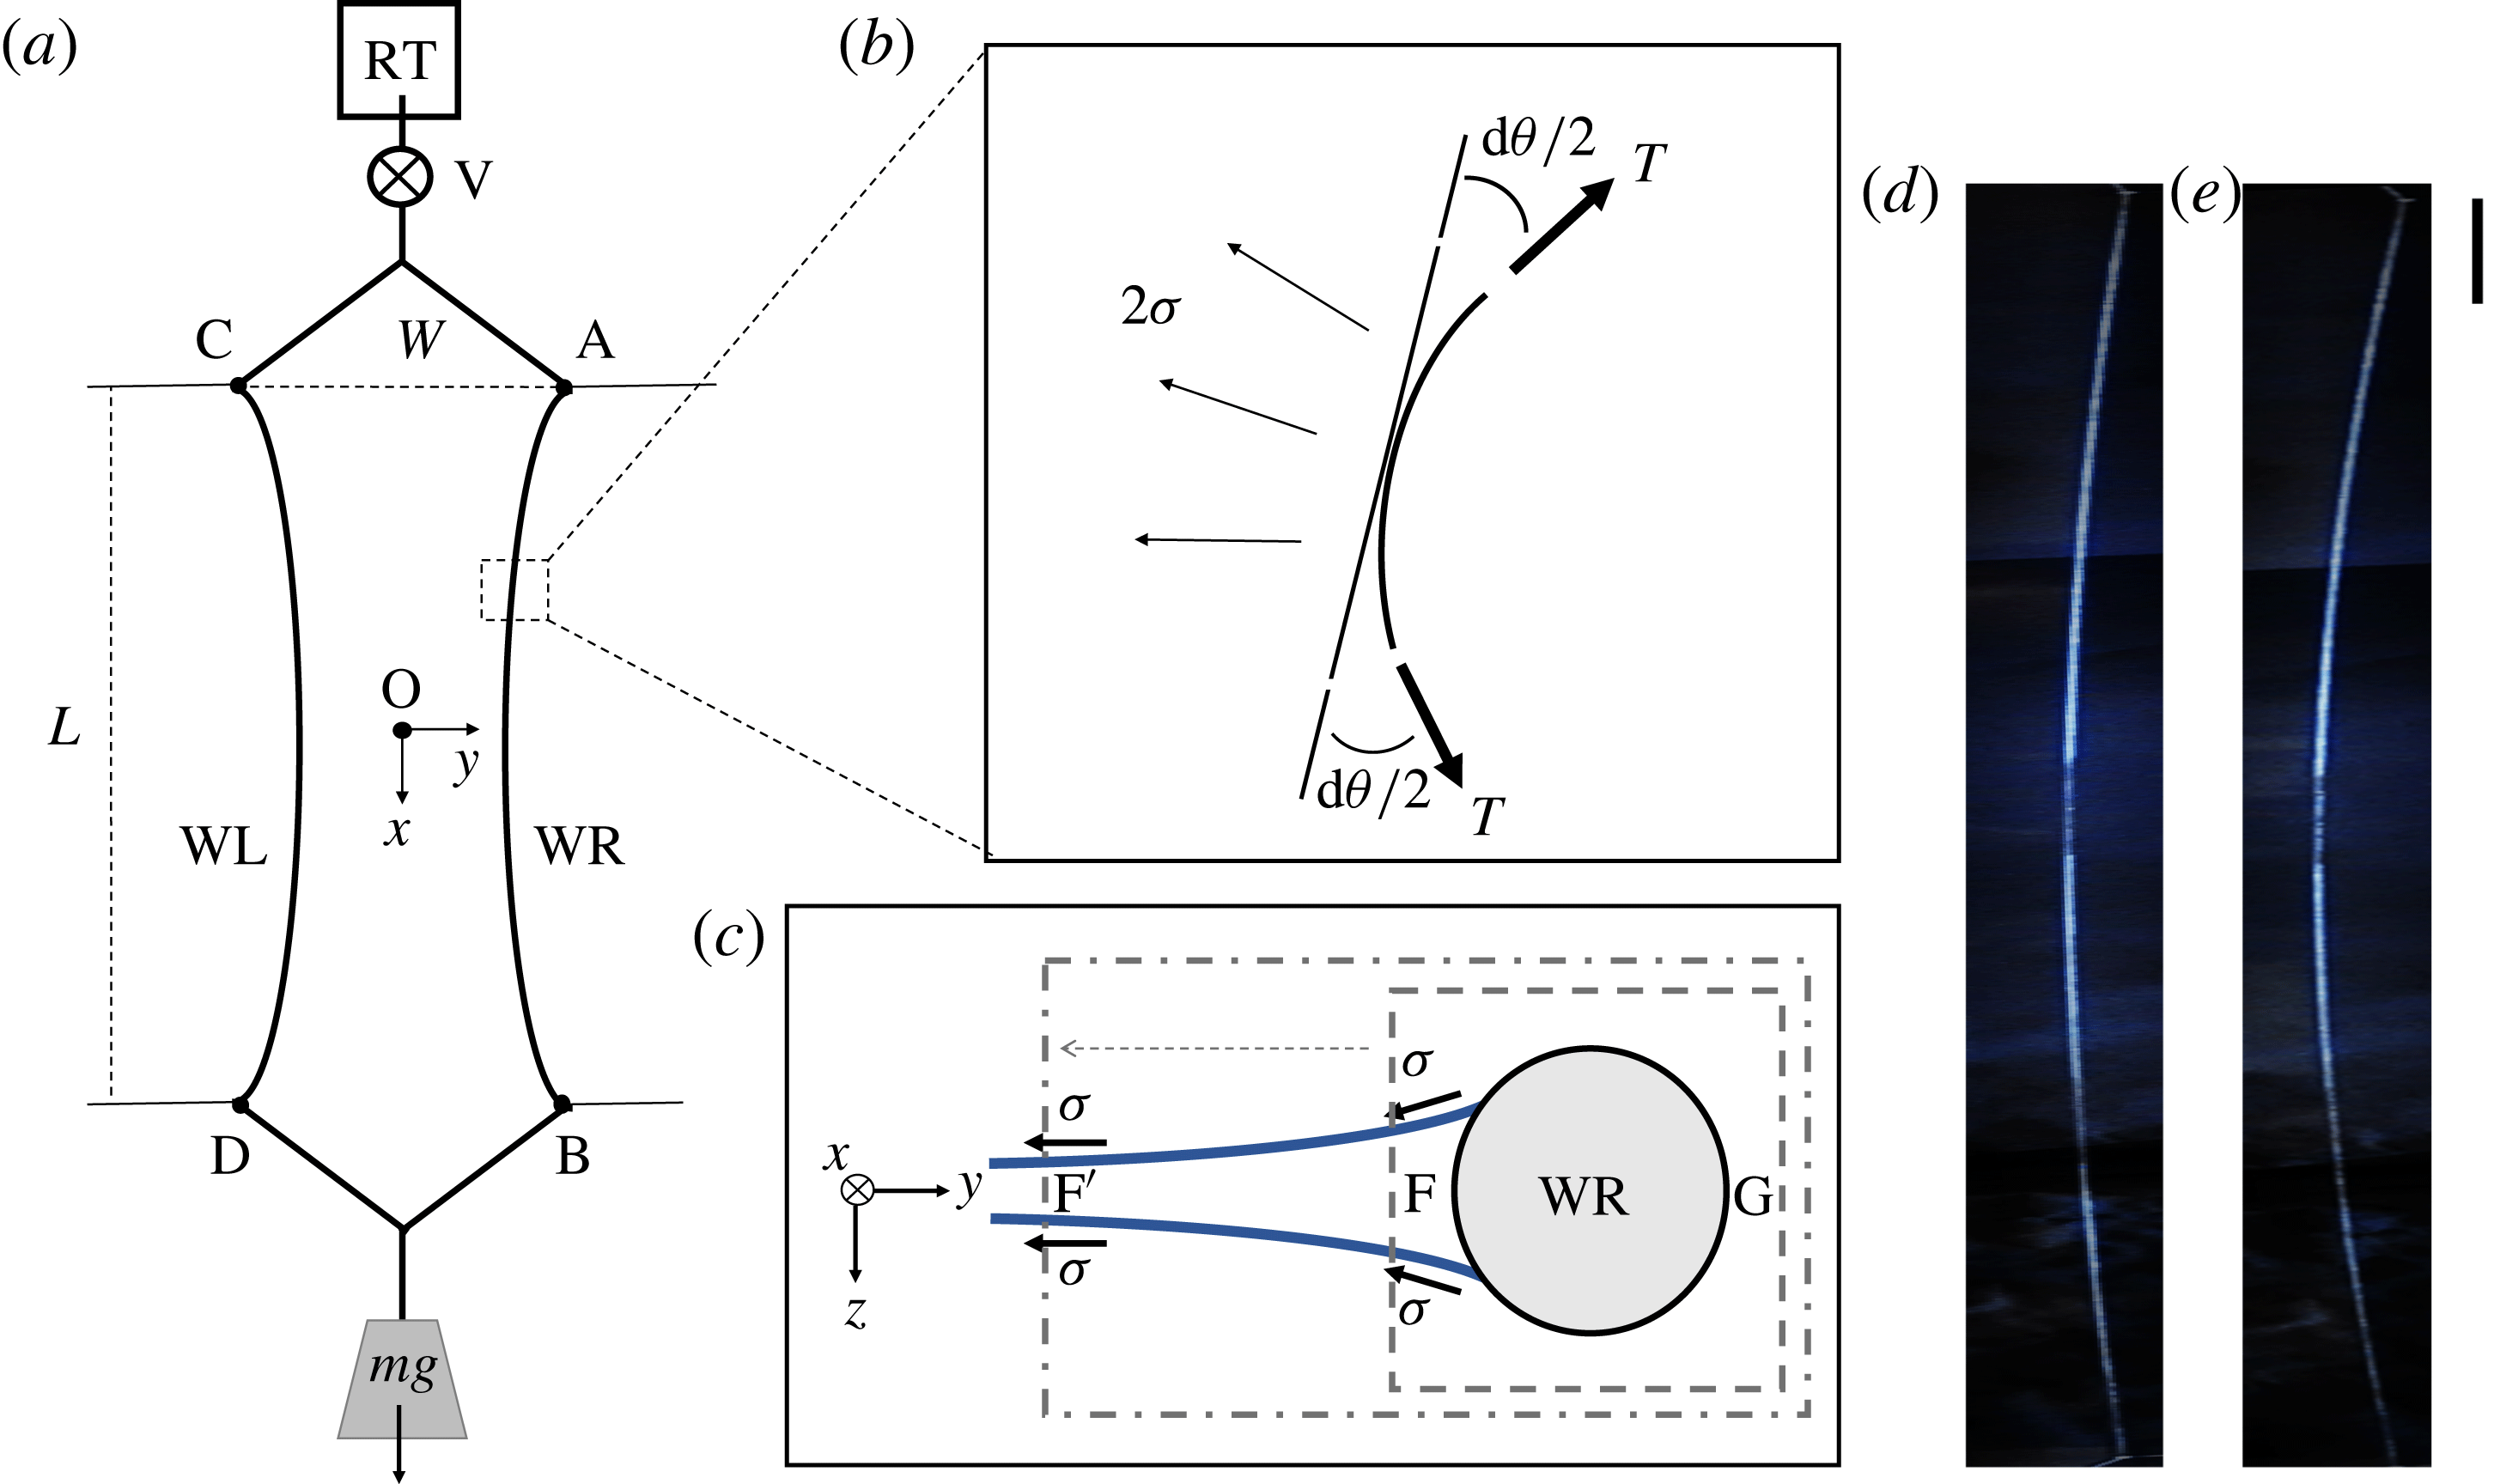
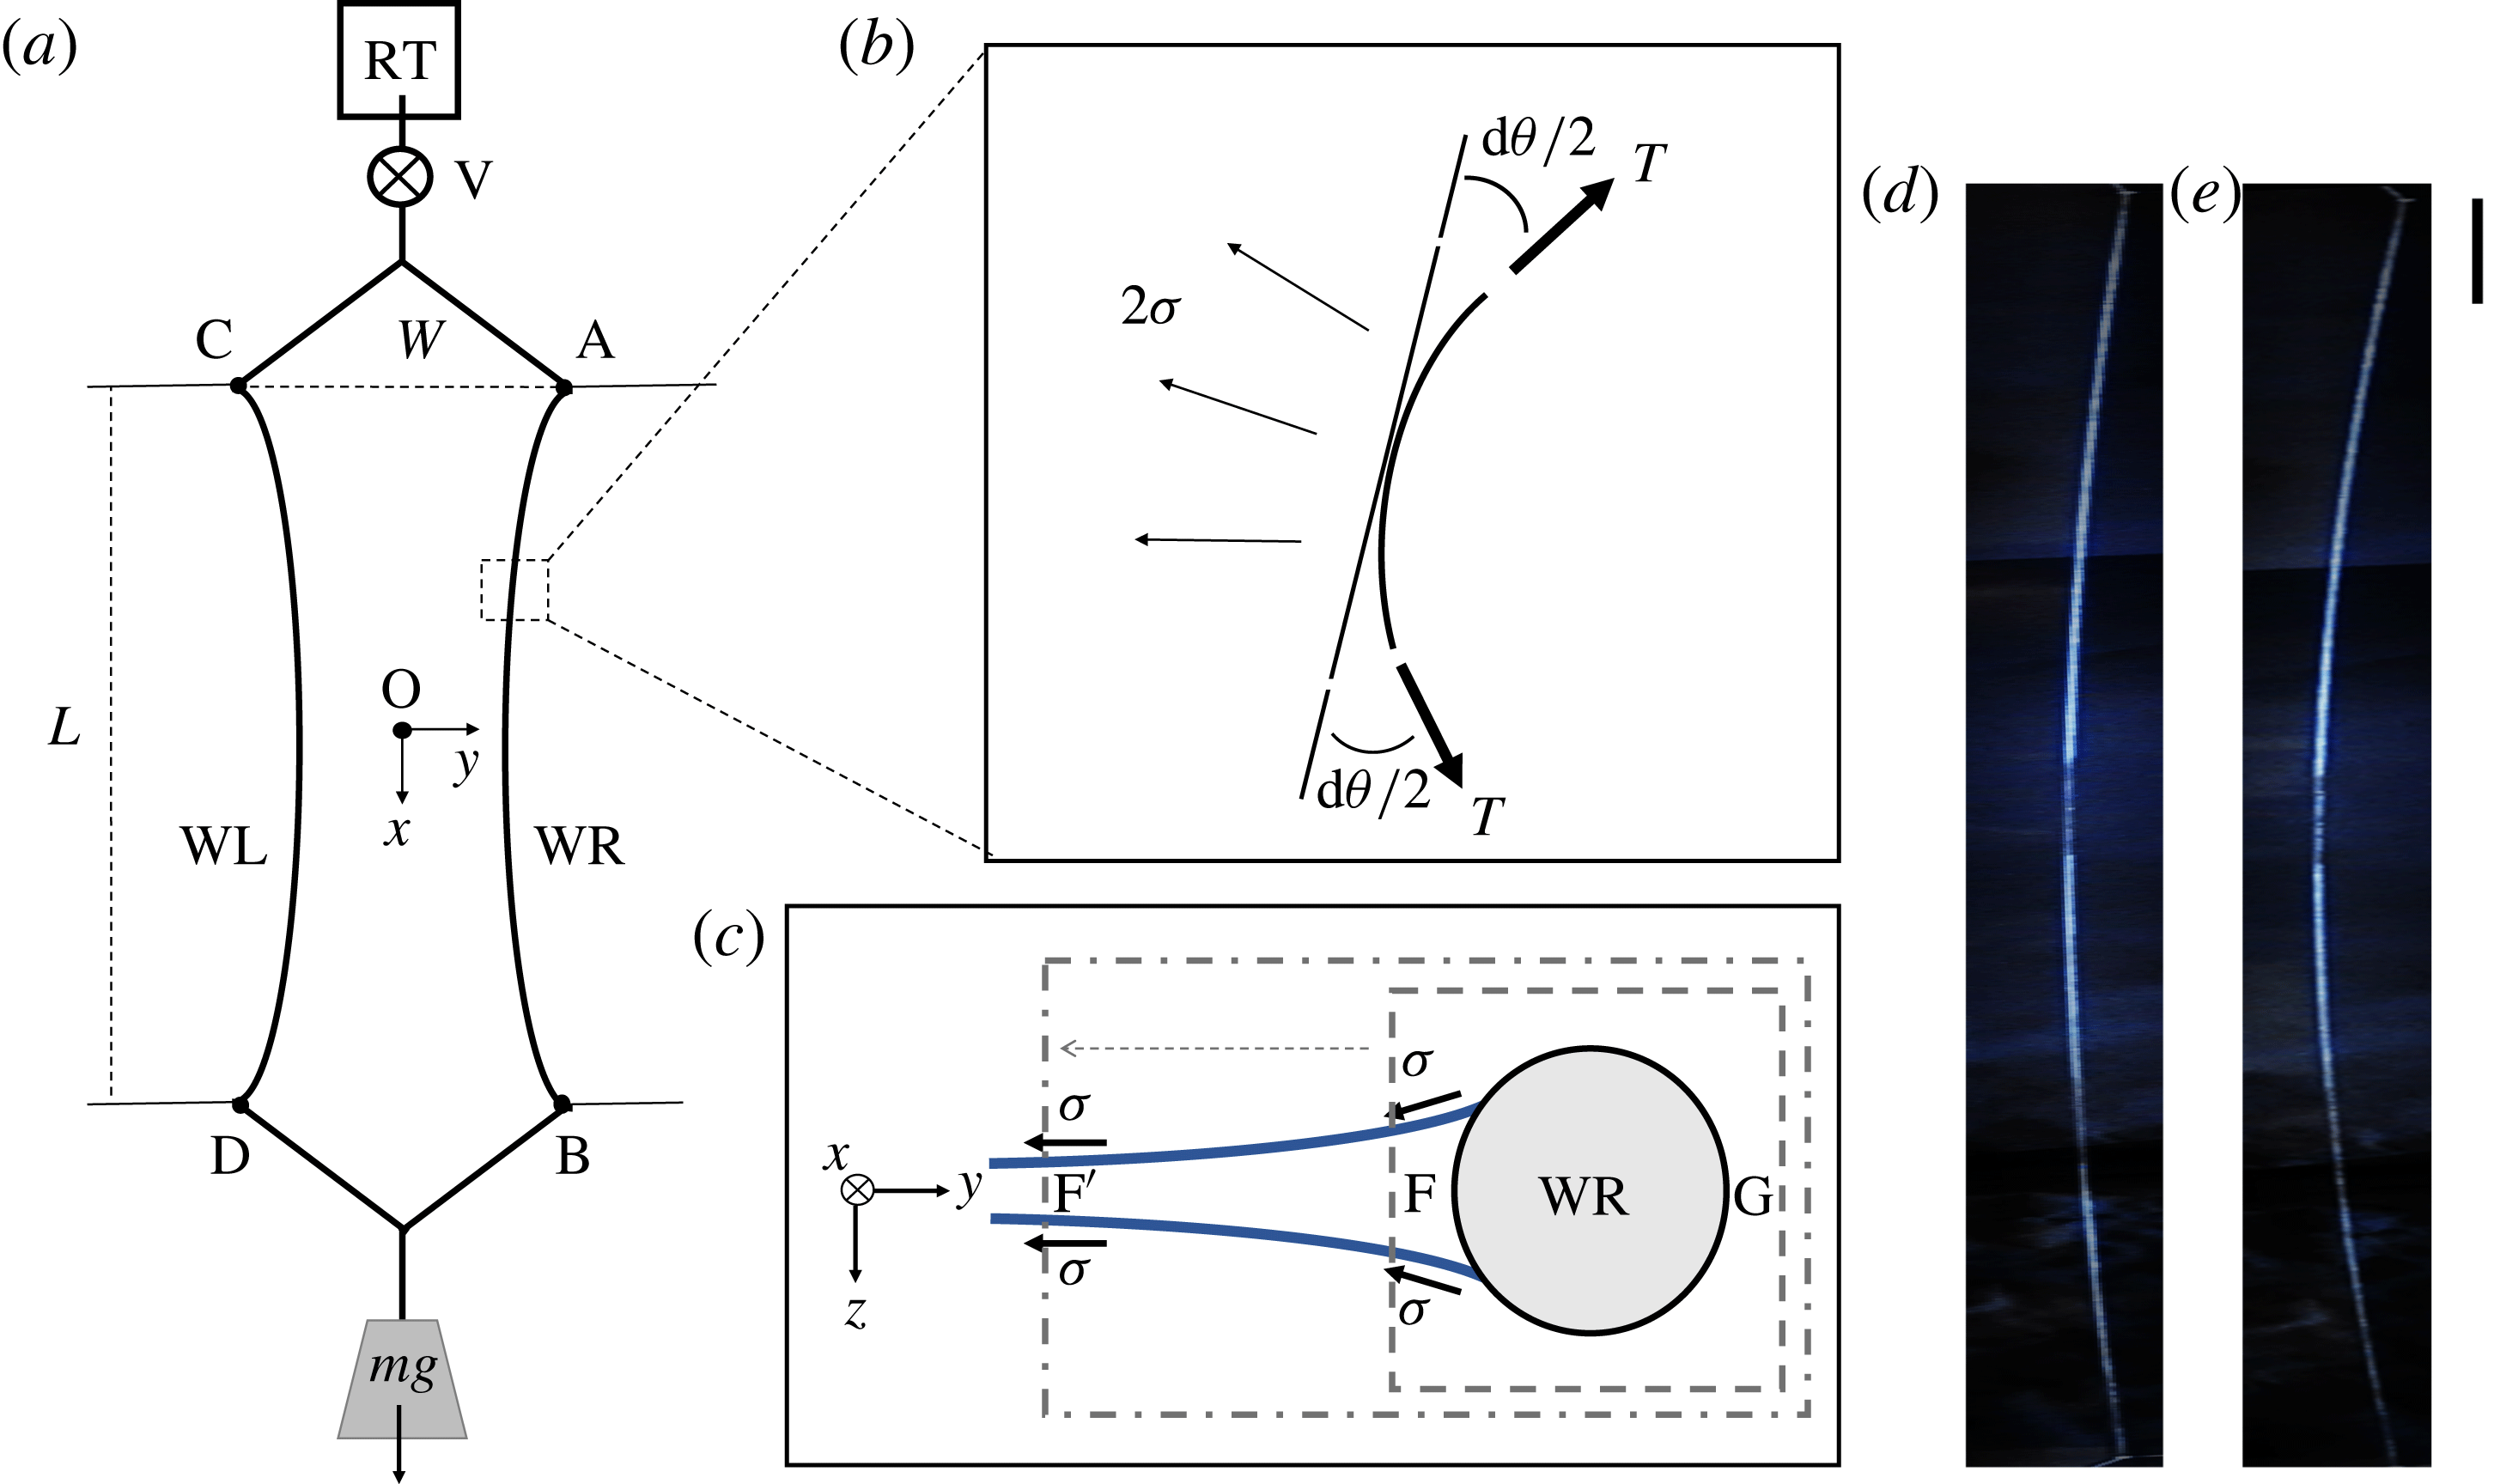
Reference Rutgers, Wu and Daniel2001; Kim & Mandre Reference Kim and Mandre2017). The main component of the standard set-up is a pair of nylon wires (WL and WR in figure 1
a) which are connected to a soap solution reservoir at the top (RT) and to a suspended weight
 $mg$
at the bottom. The suspended weight creates tension in the wires which causes them to remain vertical. To create a soap film, we open a needle valve (V) to allow soapy water to flow along two nylon wires as they are initially abreast, and then we pull them apart from each other by using four auxiliary wires. The auxiliary wires provide support so that the main wires are fixed at four points, A, B, C and D. We set the coordinate system such that
 $\hat{x}$
is longitudinal and
 ${\hat{y}}$
is transverse to the flow, with the origin O being the centre of the soap film. The soap film channel is carefully tuned to be symmetric about both of the axes.
(a) The main component of the standard soap film channel set-up is two flexible nylon wires (WL and WR) which are anchored at four points, A, B, C and D. In the presence of a soap film, the wires are bent towards each other due to the surface tension. The top reservoir RT is constantly replenished from a fresh batch of soap solution by a pump (not shown), and the used solution is drained to prevent dust contamination. (b) A length element of wire
 $\text{d}s$
is made tight by
 $T$
and bent by
 $\unicode[STIX]{x1D70E}$
. The factor 2 of
 $\unicode[STIX]{x1D70E}$
reflects that the soap film has two surfaces. (c) The cross-section of the film in the
 $y$
–
 $z$
plane. In the control volume shown by the dashed rectangle, the pressure at point F is different from the pressure at point G due to the curvature in the
 $z$
direction. However, this pressure difference is cancelled out with the effect of the menisci. This can be shown by extending the control volume to point
 $\text{F}^{\prime }$
where the film is flat. (d) An image of WR when
 $\unicode[STIX]{x1D70E}=30.6~\text{mN}~\text{m}^{-1}$
and (e) an image when
 $\unicode[STIX]{x1D70E}=43.5~\text{mN}~\text{m}^{-1}$
. It is noticeable that the curvature is greater in (e) than in (d) because of the stronger surface tension. The aspect ratio of the images is adjusted for presentation; the scale bar on the right is 10 cm in the vertical direction and the same length is 1 cm in the horizontal direction.
We prepare solutions of commercial dish soap (Dawn, P&G) in distilled water at three different concentrations. The soap concentration
 $c_{0}$
is defined as the volume fraction of the soap, with
 $c_{0}=0.5\,\%$
, 1.0 % and 2.0 % being used for the current study. The flow rate
 $\unicode[STIX]{x1D719}$
of the channel is varied from 0.26 to
 $1.55~\text{cm}^{3}~\text{s}^{-1}$
by adjusting the needle valve (V).
The whole channel is 1.8 m long, and the length
 $L$
between two fixed points A and B is 1.2 m and is equal to the distance between C and D, i.e.
 $L\equiv \overline{\text{AB}}=\overline{\text{CD}}=1.2~\text{m}$
. Likewise, the reference width of the channel
 $W$
is defined as
 $W\equiv \overline{\text{AC}}=\overline{\text{BD}}$
and varied from 6 cm to 14 cm. We use a mass of 400 g for the hanging weight at the bottom; therefore, a tension of 1.96 N is equally applied to WL and WR. The even distribution of the weight is confirmed by observing that the wires oscillate at the same frequency when plucked. In this setting, the applied tension
 $T$
is
 $O(10^{0})~\text{N}$
, the surface tension
 $\unicode[STIX]{x1D70E}$
is
 $O(10^{-2})~\text{N}~\text{m}^{-1}$
and the length of the soap film
 $L$
is
 $O(1)~\text{m}$
. The channel width is then contracted slightly, by a few per cent of its original width. We tune the weight to be small enough to substantiate the width contraction but yet to minimize the distortion of the channel which may disturb the flow.
In developing a quantitative theory, it is necessary to find the thickness of the soap film. We define the mean thickness of the film as
 $h\equiv q/u_{t}$
, where
 $q\equiv \unicode[STIX]{x1D719}/W$
is the flux per unit width and
 $u_{t}$
is the terminal velocity of the flow. We find that
 $q$
is independent of
 $y$
. Using particle tracking velocimetry, we find that the profile of
 $u(y)$
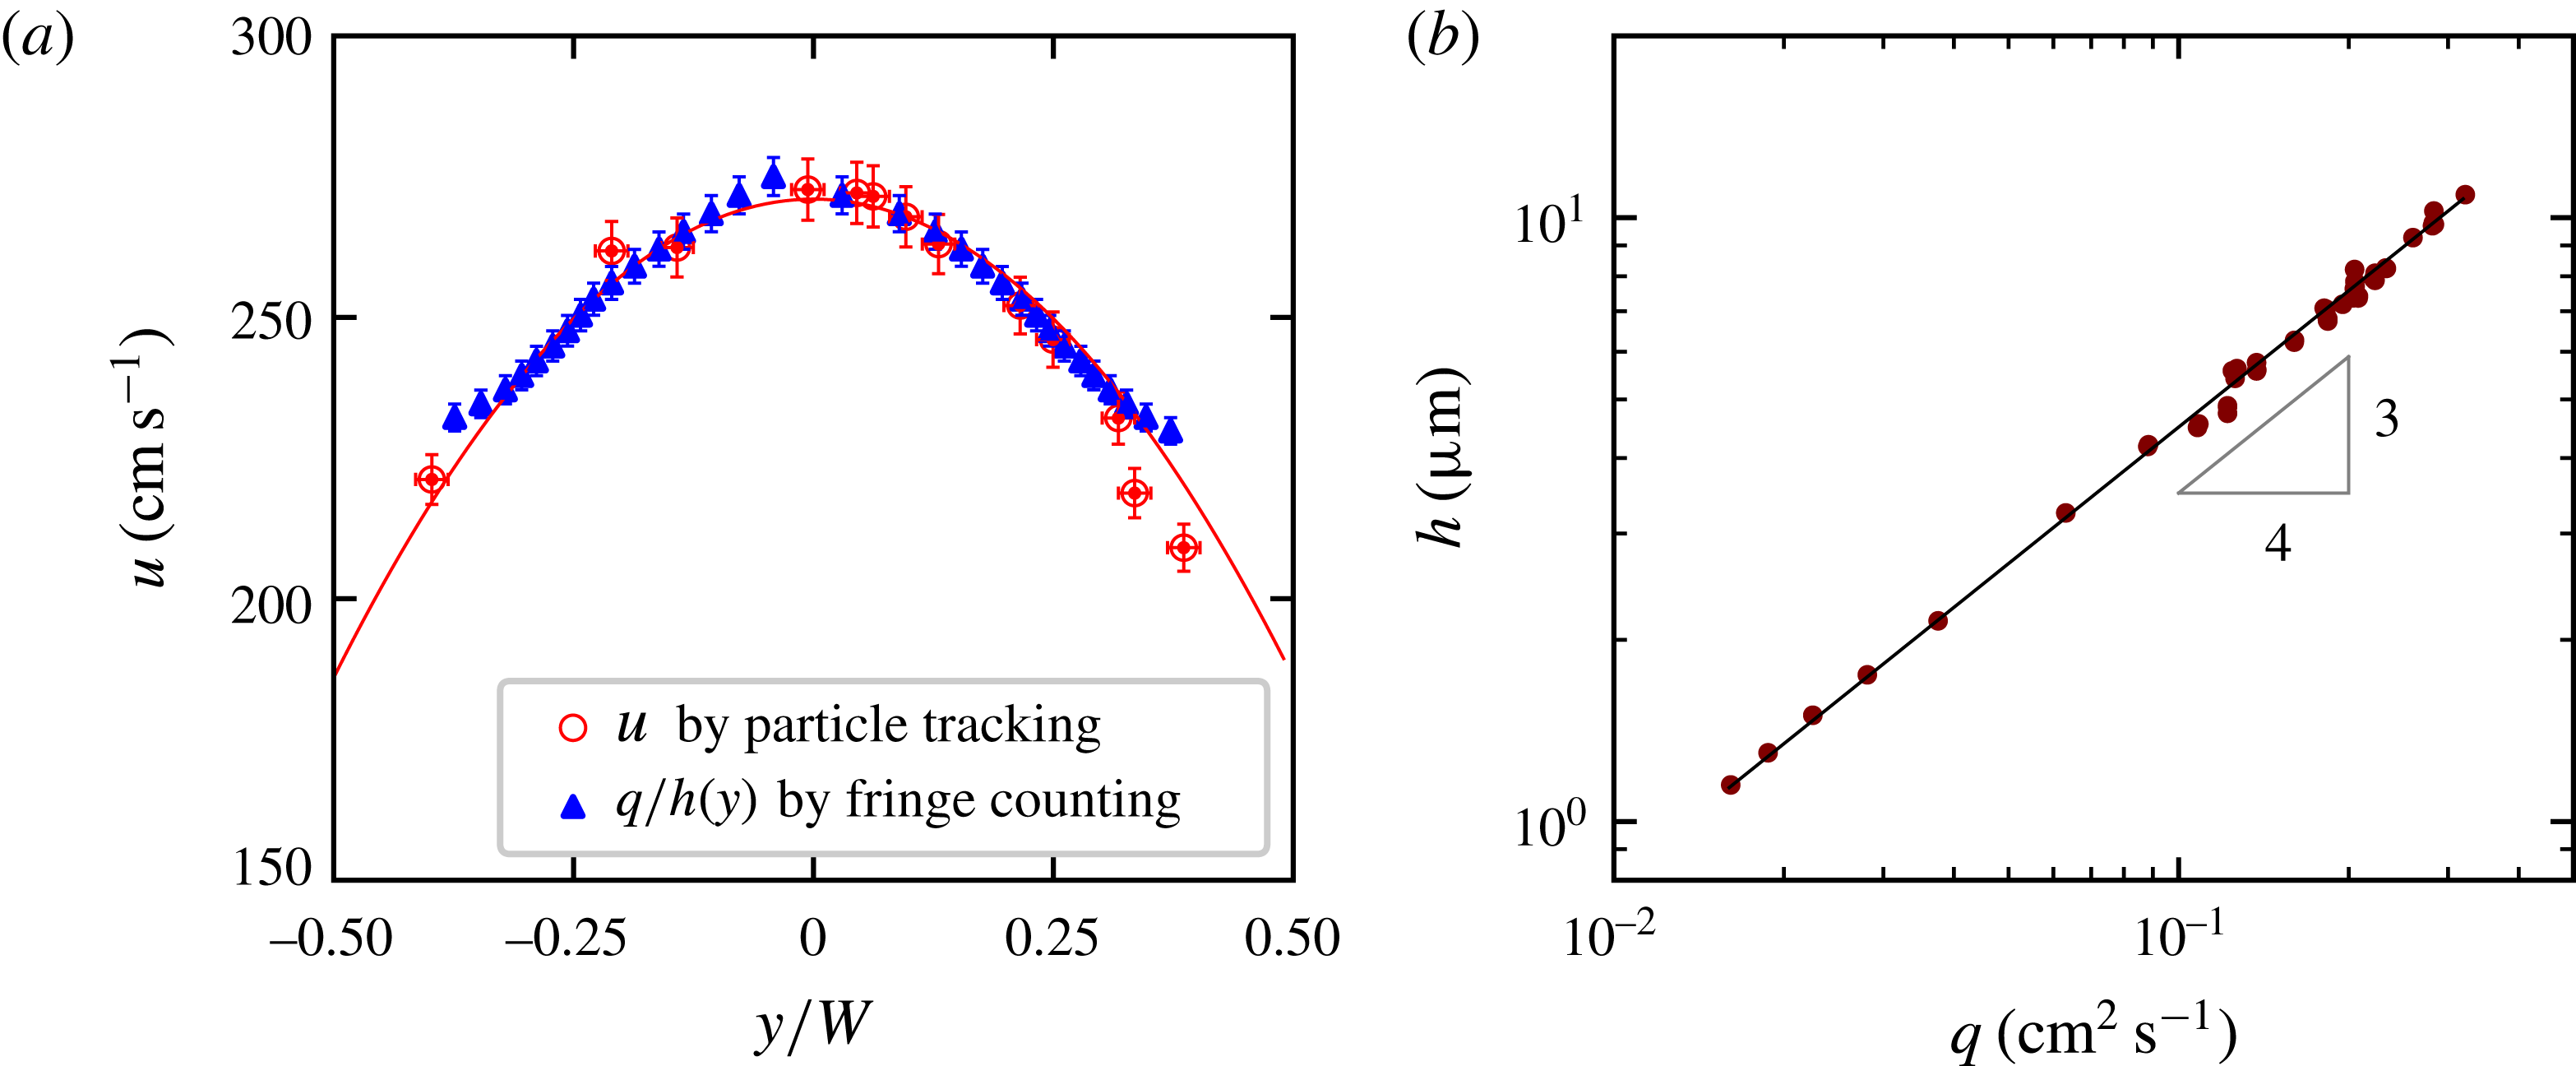
is parabolic, as seen in figure 2(a). This profile matches well with an independent measurement of
 $q/h(y)$
by counting fringes of equal thickness under a monochromatic illumination. Moreover,
 $q$
only weakly depends on
 $x$
. Even though the channel width depends on
 $x$
, its variation is limited to a few per cent and smaller than 5 % uncertainty of
 $\unicode[STIX]{x1D719}$
.
(a) The flow speed profile across
 $y$
at
 $q=0.33~\text{cm}^{2}~\text{s}^{-1}$
. The open circles are the direct measurement of
 $u(y)$
using particle tracking and the closed squares are the calculation of
 $q/h(y)$
, where
 $q$
is fixed and
 $h(y)$
is measured by counting fringes of equal thickness. The solid line shows the parabolic profile of
 $u$
across the film. (b) The relation between
 $h$
and
 $q$
. We find that
 $h=h_{0}(q/q_{0})^{0.75}$
, with
 $q_{0}=0.1~\text{cm}^{2}~\text{s}^{-1}$
and
 $h_{0}=4.5~\unicode[STIX]{x03BC}\text{m}$
, as shown by the solid line.

We observe that both
 $h$
and
 $u_{t}$
are increased by increasing
 $q$
, namely
 $h\propto q^{0.75}$
and
 $u_{t}\propto q^{0.25}$
. Here, the terminal velocity
 $u_{t}$
is measured at
 $y=0$
and approximately 0.7 m away from the top of the channel where it becomes independent of
 $x$
. This gives a relation of
 $h$
to
 $q$
as delineated in figure 2(b),
 $$\begin{eqnarray}h=h_{0}\left(q/q_{0}\right)^{0.75},\end{eqnarray}$$
where
 $q_{0}=0.1~\text{cm}^{2}~\text{s}^{-1}$
and
 $h_{0}=4.5~\unicode[STIX]{x03BC}\text{m}$
. The power exponent 0.75 in (2.1) is somewhat higher than 0.6 reported in the literature (Rutgers et al.
Reference Rutgers, Wu, Bhagavatula, Petersen and Goldburg1996). Currently, no theory is available to take account of this scaling relation. However, we find that our empirical relation between
 $q$
and
 $h$
is clear and reproducible; in the rest of the paper, we use (2.1) to estimate
 $h$
. In our range of
 $\unicode[STIX]{x1D719}$
and
 $W$
,
 $q$
is varied from 0.02 to
 $0.4~\text{cm}^{2}~\text{s}^{-1}$
and
 $h$
is varied from 1 to
 $12~\unicode[STIX]{x03BC}\text{m}$
.
2.2 Relation of the surface tension to the curvature
When a soap film is formed, the surface tension of the fluid pulls the wires (WL and WR) towards each other and creates curvature. In the following calculation, we consider the force balance on a length element
 $\text{d}s$
of the wire, as seen in figure 1(b).
In the tangential direction, the forces acting on
 $\text{d}s$
are the following: the tension
 $T$
of the wire, the gravitational force and the viscous force between the wire and the flow. Here, we assume that the deflection of the wire is so small that the wire is nearly vertical. This assumption allows us to approximate the gravitational force to be in the tangential direction. When the wire is stationary,
 $$\begin{eqnarray}\frac{\unicode[STIX]{x2202}T}{\unicode[STIX]{x2202}x}+\unicode[STIX]{x1D70C}\unicode[STIX]{x03C0}\frac{d^{2}}{4}g-\unicode[STIX]{x1D707}\frac{\unicode[STIX]{x2202}u}{\unicode[STIX]{x2202}y}\unicode[STIX]{x03C0}d=0,\end{eqnarray}$$
where the diameter of the wire
 $d=0.038~\text{cm}$
, the density of the wire
 $\unicode[STIX]{x1D70C}=1.15~\text{g}~\text{cm}^{-3}$
and the viscosity of the soap solution
 $\unicode[STIX]{x1D707}\simeq 8.9\times 10^{-3}~\text{Pa}~\text{s}$
. Considering that
 $\text{d}u/\text{d}y\approx 10^{3}~\text{s}^{-1}$
is usually reported in soap films (Rutgers et al.
Reference Rutgers, Wu, Bhagavatula, Petersen and Goldburg1996), we find that
 $\unicode[STIX]{x2202}T/\unicode[STIX]{x2202}x\approx 10^{-4}~\text{N}~\text{m}^{-1}$
. We conclude that
 $T=mg/2=1.96~\text{N}$
at any location of the wires.
In the normal direction, the surface tension
 $\unicode[STIX]{x1D70E}$
exerts to bend the wires and the tension
 $T$
resists, as seen in figure 1(b). Using the Euler–Bernoulli equation,
 $$\begin{eqnarray}EI\frac{\unicode[STIX]{x2202}^{4}y}{\unicode[STIX]{x2202}x^{4}}-2\unicode[STIX]{x1D70E}+T\unicode[STIX]{x1D705}=0,\end{eqnarray}$$
where
 $E\approx 10^{9}~\text{Pa}$
is the elastic modulus of the wire,
 $I=\unicode[STIX]{x03C0}(d/2)^{4}/2\simeq 2\times 10^{-15}~\text{m}^{4}$
is the second moment of area and
 $\unicode[STIX]{x1D705}=\text{d}\unicode[STIX]{x1D703}/\text{d}s\approx \text{d}^{2}y/\text{d}x^{2}\simeq (30~\text{m})^{-1}$
is the curvature. Comparing the relative importance of the first term with the second term as
 $EI\unicode[STIX]{x1D705}/(2\unicode[STIX]{x1D70E}L^{2})\approx 10^{-6}$
and with the third term as
 $EI/(TL^{2})\approx 10^{-6}$
, we conclude that the bending stiffness of the wire is negligible. Equation (2.3) is then simplified to
 $$\begin{eqnarray}\unicode[STIX]{x1D70E}=\frac{T\unicode[STIX]{x1D705}}{2}=\frac{mg}{4}\frac{\unicode[STIX]{x2202}^{2}y}{\unicode[STIX]{x2202}x^{2}},\end{eqnarray}$$
which provides us with the means to measure
 $\unicode[STIX]{x1D70E}$
by characterizing the local curvature of the wire.
We also examine the effect of the Laplace pressure due to the curvature in the
 $z$
direction. Figure 1(c) shows the cross-section of the film in the
 $y$
–
 $z$
plane. As shown in figure 2(a), the film is thicker near the wires, and there is non-zero curvature in the
 $z$
direction. In a control volume enclosed by the dashed rectangle in figure 1(c), the pressure at point F is smaller than the pressure at G, and exerts an additional force to bend the wire. However, the curvature also reduces the component of surface tension and increases the area of the control surface. Because the Laplace pressure is related to the curvature, these effects cancel each other exactly. This becomes clear when we extend the control volume to point
 $\text{F}^{\prime }$
(shown by a dash-dotted line) where the film is flat, and the net force to the control volume is zero except for
 $\unicode[STIX]{x1D70E}$
. Combined with the observation that there is no flow in the
 $y$
direction in the soap film, it is inferred that (2.4) holds irrespective of the control volume chosen.
2.3 Measurements
A digital camera is set for visual observation of the soap film. A conventional digital single lens reflex camera (Nikon D90) is placed approximately 3.5 m away from the soap film. The optical axis of the camera is aligned with the
 $z$
axis of our coordinate system so that the centre of the image is the centre of the soap film channel (the origin in the coordinate system). The entire soap film is captured in a single frame.
The captured digital image of the soap film channel is processed using our in-house code for the digitization and regression analysis. Each photo is converted to a set of
 $(x,y)$
coordinates of points on the wire, and more than 3000 data points are acquired per wire.
We then fit the digitized data to the polynomial function
 $y=\sum a_{n}x^{n}$
. Inspection of multiple cases shows that
 $a_{n}$
for
 $n>2$
is negligible, and we conclude that use of the quadratic regression model
 $y=a_{2}x^{2}+a_{1}x+a_{0}$
is sufficient to fit our data. The coefficients
 $a_{2}$
,
 $a_{1}$
and
 $a_{0}$
are determined by a least-squares method and the curvature
 $\unicode[STIX]{x1D705}$
is calculated by taking the second derivative, as
 $\unicode[STIX]{x1D705}=\unicode[STIX]{x2202}^{2}y/\unicode[STIX]{x2202}x^{2}=2a_{2}$
. Then,
 $\unicode[STIX]{x1D70E}=mga_{2}/2$
according to (2.4).
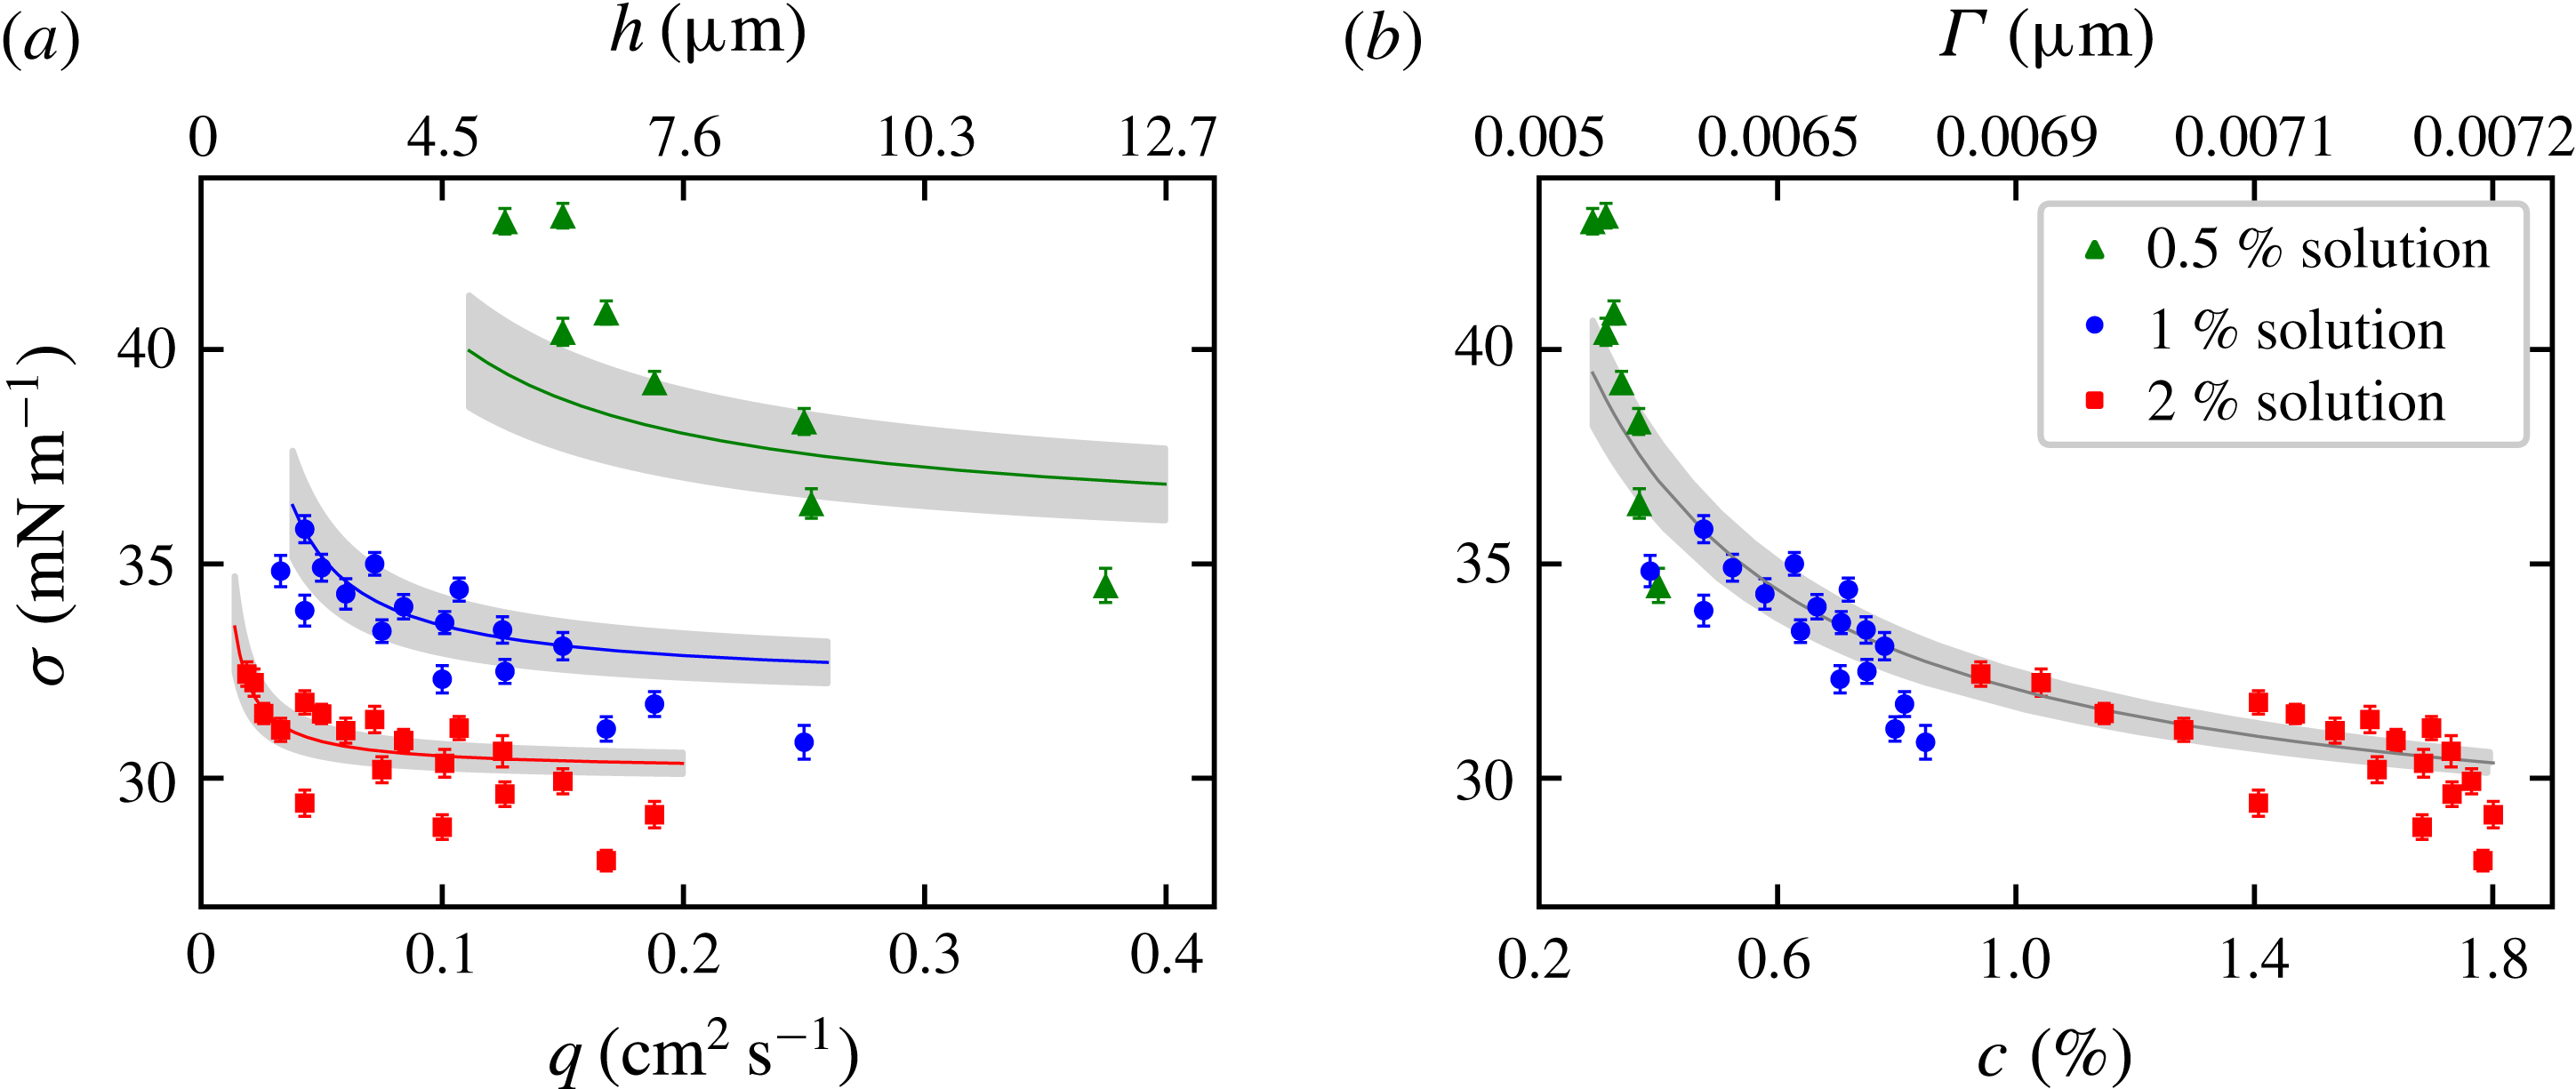
(a) The surface tension
 $\unicode[STIX]{x1D70E}$
measured using (2.4). When both
 $c_{0}$
and
 $h$
are large,
 $\unicode[STIX]{x1D70E}$
approaches an asymptotic value
 $\unicode[STIX]{x1D70E}_{\infty }$
. Otherwise,
 $\unicode[STIX]{x1D70E}$
increases as
 $c_{0}$
or
 $h$
decreases. The solid lines show the model in (3.2), with the 10 % uncertainty range in the grey bands. (b) Data points from various experimental conditions all collapse into a single curve that represents the equilibrium between
 $\unicode[STIX]{x1D6E4}$
and
 $c$
, as indicated by (1.2). It is inferred that the main surfactants of our soap films are in equilibrium.

3 Results and discussion
3.1 Surface tension
In figure 3(a), our measurements of
 $\unicode[STIX]{x1D70E}$
are presented with respect to
 $q$
, ranging from 0.02 to
 $0.4~\text{cm}^{2}~\text{s}^{-1}$
, for three different values of
 $c_{0}$
, namely 0.5 %, 1 % and 2 %. When
 $q$
is sufficiently large and thus the film is sufficiently thick,
 $\unicode[STIX]{x1D70E}$
approaches an asymptotic value
 $\unicode[STIX]{x1D70E}_{\infty }=30~\text{mN}~\text{m}^{-1}$
. This value of
 $\unicode[STIX]{x1D70E}_{\infty }$
equals the surface tension of the bulk solution; in a separate measurement of
 $\unicode[STIX]{x1D70E}$
of soap solutions in Petri dishes using the Du Nuöy ring method, we find that
 $\unicode[STIX]{x1D70E}=30~\text{mN}~\text{m}^{-1}$
if
 $c_{0}>0.05\,\%$
. This observation implies that in the asymptotic regime, the surface of the soap film is fully covered with surfactants, and the surface concentration
 $\unicode[STIX]{x1D6E4}$
also approaches a constant value
 $\unicode[STIX]{x1D6E4}_{\infty }$
as
 $\unicode[STIX]{x1D70E}$
approaches
 $\unicode[STIX]{x1D70E}_{\infty }$
. Using the asymptotic properties, the proportionality constant in the assumed linear relation
 $\unicode[STIX]{x1D70E}=\unicode[STIX]{x1D70E}_{0}-\unicode[STIX]{x1D6FC}\unicode[STIX]{x1D6E4}$
can be obtained as
 $\unicode[STIX]{x1D6FC}=(\unicode[STIX]{x1D70E}_{0}\,-\,\unicode[STIX]{x1D70E}_{\infty })/\unicode[STIX]{x1D6E4}_{\infty }$
.
The required thickness to possess
 $\unicode[STIX]{x1D70E}_{\infty }$
is inversely proportional to
 $c_{0}$
. We find that
 $h=3.8~\unicode[STIX]{x03BC}\text{m}$
(
 $q=0.08~\text{cm}^{2}~\text{s}^{-1}$
) is required for
 $c_{0}=2\,\%$
, and
 $h=7.6~\unicode[STIX]{x03BC}\text{m}$
(
 $q=0.2~\text{cm}^{2}~\text{s}^{-1}$
) is required for
 $c_{0}=1\,\%$
to possess
 $\unicode[STIX]{x1D70E}_{\infty }$
. By extrapolating data points,
 $h\simeq 15~\unicode[STIX]{x03BC}\text{m}$
(
 $q=0.5~\text{cm}^{2}~\text{s}^{-1}$
) is estimated to be required for
 $c_{0}=0.5\,\%$
.
The inverse proportionality between
 $c_{0}$
and
 $h$
shows the apparent equivalence between thinning and dilution. Our measurement in figure 3(a) indicates that there are two ways to decrease
 $\unicode[STIX]{x1D6E4}$
in soap films: one could decrease
 $\unicode[STIX]{x1D6E4}$
by reducing
 $c_{0}$
(dilution) or by reducing
 $h$
(thinning). If we consider a patch of a soap film, thinning does not change the volume of the patch but introduces fresh interface and reduces the number density of surfactants in the patch. Dilution results in a reduction of the total number of surfactants in the patch, and
 $\unicode[STIX]{x1D6E4}$
is also reduced.
To accommodate our observation quantitatively, we present a self-consistent model of the surface tension by using the conservation equation (or, as we call it, the surface dilution equation) in (1.1) and the Langmuir adsorption equation in (1.2). The basic feature of the Langmuir adsorption equation is that
 $\unicode[STIX]{x1D6E4}$
increases with
 $c$
for low concentration and then reaches an asymptotic value
 $\unicode[STIX]{x1D6E4}_{\infty }$
. This behaviour qualitatively agrees with that of soap solutions: when
 $c_{0}$
is small,
 $\unicode[STIX]{x1D6E4}$
and
 $c$
are roughly proportional to each other, and for asymptotically large
 $c_{0}$
,
 $\unicode[STIX]{x1D6E4}$
reaches a constant asymptotic value (Tajima, Muramatsu & Sasaki Reference Tajima, Muramatsu and Sasaki1970). Leaving the two parameters
 $\unicode[STIX]{x1D6E4}_{\infty }$
and
 $c^{\ast }$
to be determined later, we solve for
 $\unicode[STIX]{x1D6E4}$
using (1.1) and (1.2),
 $$\begin{eqnarray}\unicode[STIX]{x1D6E4}=\unicode[STIX]{x1D6E4}_{\infty }-\unicode[STIX]{x1D6E4}^{\prime }(h,c_{0};\unicode[STIX]{x1D6E4}_{\infty },c_{b}^{\ast }),\end{eqnarray}$$
where
 $\unicode[STIX]{x1D6E4}^{\prime }(h,c_{0};\unicode[STIX]{x1D6E4}_{\infty },c_{b}^{\ast })\equiv [(c_{0}h+c^{\ast }h-2\unicode[STIX]{x1D6E4}_{\infty })^{2}/16+\unicode[STIX]{x1D6E4}_{\infty }c^{\ast }h/2]^{1/2}-(c_{0}h+c^{\ast }h-2\unicode[STIX]{x1D6E4}_{\infty })/4$
. The function
 $\unicode[STIX]{x1D6E4}^{\prime }$
is positive valued and approaches zero as
 $h\rightarrow \infty$
. Then, the surface tension
 $\unicode[STIX]{x1D70E}$
is
 $$\begin{eqnarray}\displaystyle \unicode[STIX]{x1D70E}=\unicode[STIX]{x1D70E}_{0}-\unicode[STIX]{x1D6FC}\unicode[STIX]{x1D6E4}=\unicode[STIX]{x1D70E}_{\infty }+(\unicode[STIX]{x1D70E}_{0}-\unicode[STIX]{x1D70E}_{\infty })\frac{\unicode[STIX]{x1D6E4}^{\prime }(h,c_{0})}{\unicode[STIX]{x1D6E4}_{\infty }}, & & \displaystyle\end{eqnarray}$$
where
 $\unicode[STIX]{x1D70E}_{\infty }\equiv \unicode[STIX]{x1D70E}_{0}-\unicode[STIX]{x1D6FC}\unicode[STIX]{x1D6E4}_{\infty }$
equals the experimentally observed value of
 $30~\text{mN}~\text{m}^{-1}$
.
We now determine the two parameters
 $\unicode[STIX]{x1D6E4}_{\infty }$
and
 $c^{\ast }$
by regression. The experimental data in figure 3(a) are provided as an input to the model in (3.2), and the model is iteratively solved to minimize the mean squared residual of the fitting. The analysis yields that
 $\unicode[STIX]{x1D6E4}_{\infty }=0.76\,\%\cdot \unicode[STIX]{x03BC}\text{m}$
and
 $c^{\ast }=0.10\,\%$
as the best fitting of our data. In figure 3(a), the calculation of the model using the obtained parameters is shown as solid lines. The grey bands around the curve show
 $\pm 10\,\%$
uncertainty of the calculation. By substituting
 $\unicode[STIX]{x1D6E4}_{\infty }=0.76\,\%\cdot \unicode[STIX]{x03BC}\text{m}$
and
 $c^{\ast }=0.10\,\%$
in (3.1) and (1.1),
 $\unicode[STIX]{x1D6E4}$
and
 $c$
are calculated for each measured datum. Figure 3(b) shows
 $\unicode[STIX]{x1D70E}$
plotted with respect to thus calculated
 $c$
, and our measurements from three different concentrations collapse into a single curve. The black line in the figure is the Langmuir adsorption equation (1.2) and represents the relation between
 $\unicode[STIX]{x1D6E4}$
and
 $c$
in equilibrium.
Two important implications about our soap films are learned. First, the primary surface-active components of our soap films approach equilibrium. The commercial dish soap we use is a mixture of several species of surfactants with different properties. However, it is shown in figure 3(b) that the data points from various experimental conditions all collapse into the equilibrium relation, and this collapse strongly indicates that
 $\unicode[STIX]{x1D6E4}$
and
 $c$
of the main surfactants are in equilibrium in our soap films. Further, we estimate the diffusive time scale across the thickness
 $\unicode[STIX]{x1D70F}_{d}\simeq h^{2}/6D\approx$
 $0.4{-}40~\text{ms}$
using the diffusion coefficient
 $D\simeq 4\times 10^{-6}~\text{cm}^{2}~\text{s}^{-1}$
(Couder et al.
Reference Couder, Chomaz and Rabaud1989). The flow speed
 $u_{t}\sim 2.5~\text{m}~\text{s}^{-1}$
and the longitudinal distance to reach equilibrium,
 $u_{t}\unicode[STIX]{x1D70F}_{d}$
, is less than 0.1 m. Considering that our soap film has an initial expansion zone that is approximately 0.3 m long, it is evident that equilibrium between the surface and the bulk must have been reached even in the thickest film. Second, however, other than the primary surfactants, there may be other, perhaps heavier, components of the soap that remain out of equilibrium in the soap film set-up. This is supported by our independent surface tension measurements of soap solutions, which show further reduction in the value of the surface tension than that predicted by the Langmuir isotherm.
3.2 Gibbs elasticity
Elasticity is related to
 $\unicode[STIX]{x1D70E}$
and is pertinent for the energetic analysis of soap films. The elasticity of a soap film quantifies the stability of soap film under disturbance and is defined as the change in
 $\unicode[STIX]{x1D70E}$
per fractional change in the surface area, i.e.
 $E=A\text{d}\unicode[STIX]{x1D70E}/\text{d}A$
, where
 $A$
is the area of the soap film (Lucassen et al.
Reference Lucassen, Van den Tempel, Vrij and Hesselink1970). Measurement of
 $\unicode[STIX]{x1D70E}$
with respect to
 $h$
allows us to calculate the Gibbs elasticity of soap films. Using the incompressibility
 $\ln A=-\ln h$
, the elasticity is
 $$\begin{eqnarray}E=-\frac{\text{d}\unicode[STIX]{x1D70E}}{\text{d}\ln h}.\end{eqnarray}$$
Depending on the time scale of the disturbance, there are two elasticities of soap films, the Marangoni and the Gibbs elasticity. The Marangoni elasticity applies to the scenario in which a soap film is stretched suddenly, i.e. the time scale of the disturbance
 $\unicode[STIX]{x1D70F}$
is shorter than the diffusive time scale
 $\unicode[STIX]{x1D70F}_{d}$
, so that the interstitial surfactants do not have time to diffuse to the surfaces. Then, the local decrease in
 $\unicode[STIX]{x1D6E4}$
will increase
 $\unicode[STIX]{x1D70E}$
, producing Marangoni stress which recovers the soap film back to the previous equilibrium state. Otherwise,
 $\unicode[STIX]{x1D70F}>\unicode[STIX]{x1D70F}_{d}$
, the Gibbs elasticity emerges when a patch of a soap film is stretched slowly so that the interstitial surfactants diffuse to the surfaces and a new thermodynamic equilibrium between
 $\unicode[STIX]{x1D6E4}$
and
 $c$
is reached. In the current study, we measure
 $\unicode[STIX]{x1D70E}$
with respect to
 $h$
while
 $\unicode[STIX]{x1D6E4}$
and
 $c$
of the main surfactants are in equilibrium, and therefore the Gibbs elasticity can be measured.
Our first-hand inspection of
 $\unicode[STIX]{x1D70E}$
with respect to
 $\ln h$
suggests that
 $E_{G}$
is proportional to
 $h^{-3/2}$
for a given
 $c_{0}$
. From the observation, we make an ansatz that helps us to pick
 $E_{G}$
from the noisy data such that
 $$\begin{eqnarray}E_{G}(c_{0},h)\simeq E_{0}(c_{0})h^{-3/2},\end{eqnarray}$$
where
 $E_{0}$
is the concentration-dependent parameter. Integration of (3.3) using (3.4) gives that
 $$\begin{eqnarray}\unicode[STIX]{x1D70E}=\unicode[STIX]{x1D70E}_{\infty }+{\textstyle \frac{2}{3}}E_{0}h^{-3/2}.\end{eqnarray}$$
Measurement of
 $E_{G}$
is possible by fitting the data using (3.5). We obtain
 $E_{0}=10.3$
for soap films made of 2 % soap solution,
 $E_{0}=22.8$
for 1 % and
 $E_{0}=246~(\text{mN}~\text{m}^{-1}\cdot \unicode[STIX]{x03BC}\text{m}^{3/2})$
for 0.5 %. In all cases,
 $\unicode[STIX]{x1D70E}_{\infty }=30\pm 1~\text{mN}~\text{m}^{-1}$
from the fitting. In the range of
 $h$
where (3.4) is valid, our measurement of
 $E_{G}$
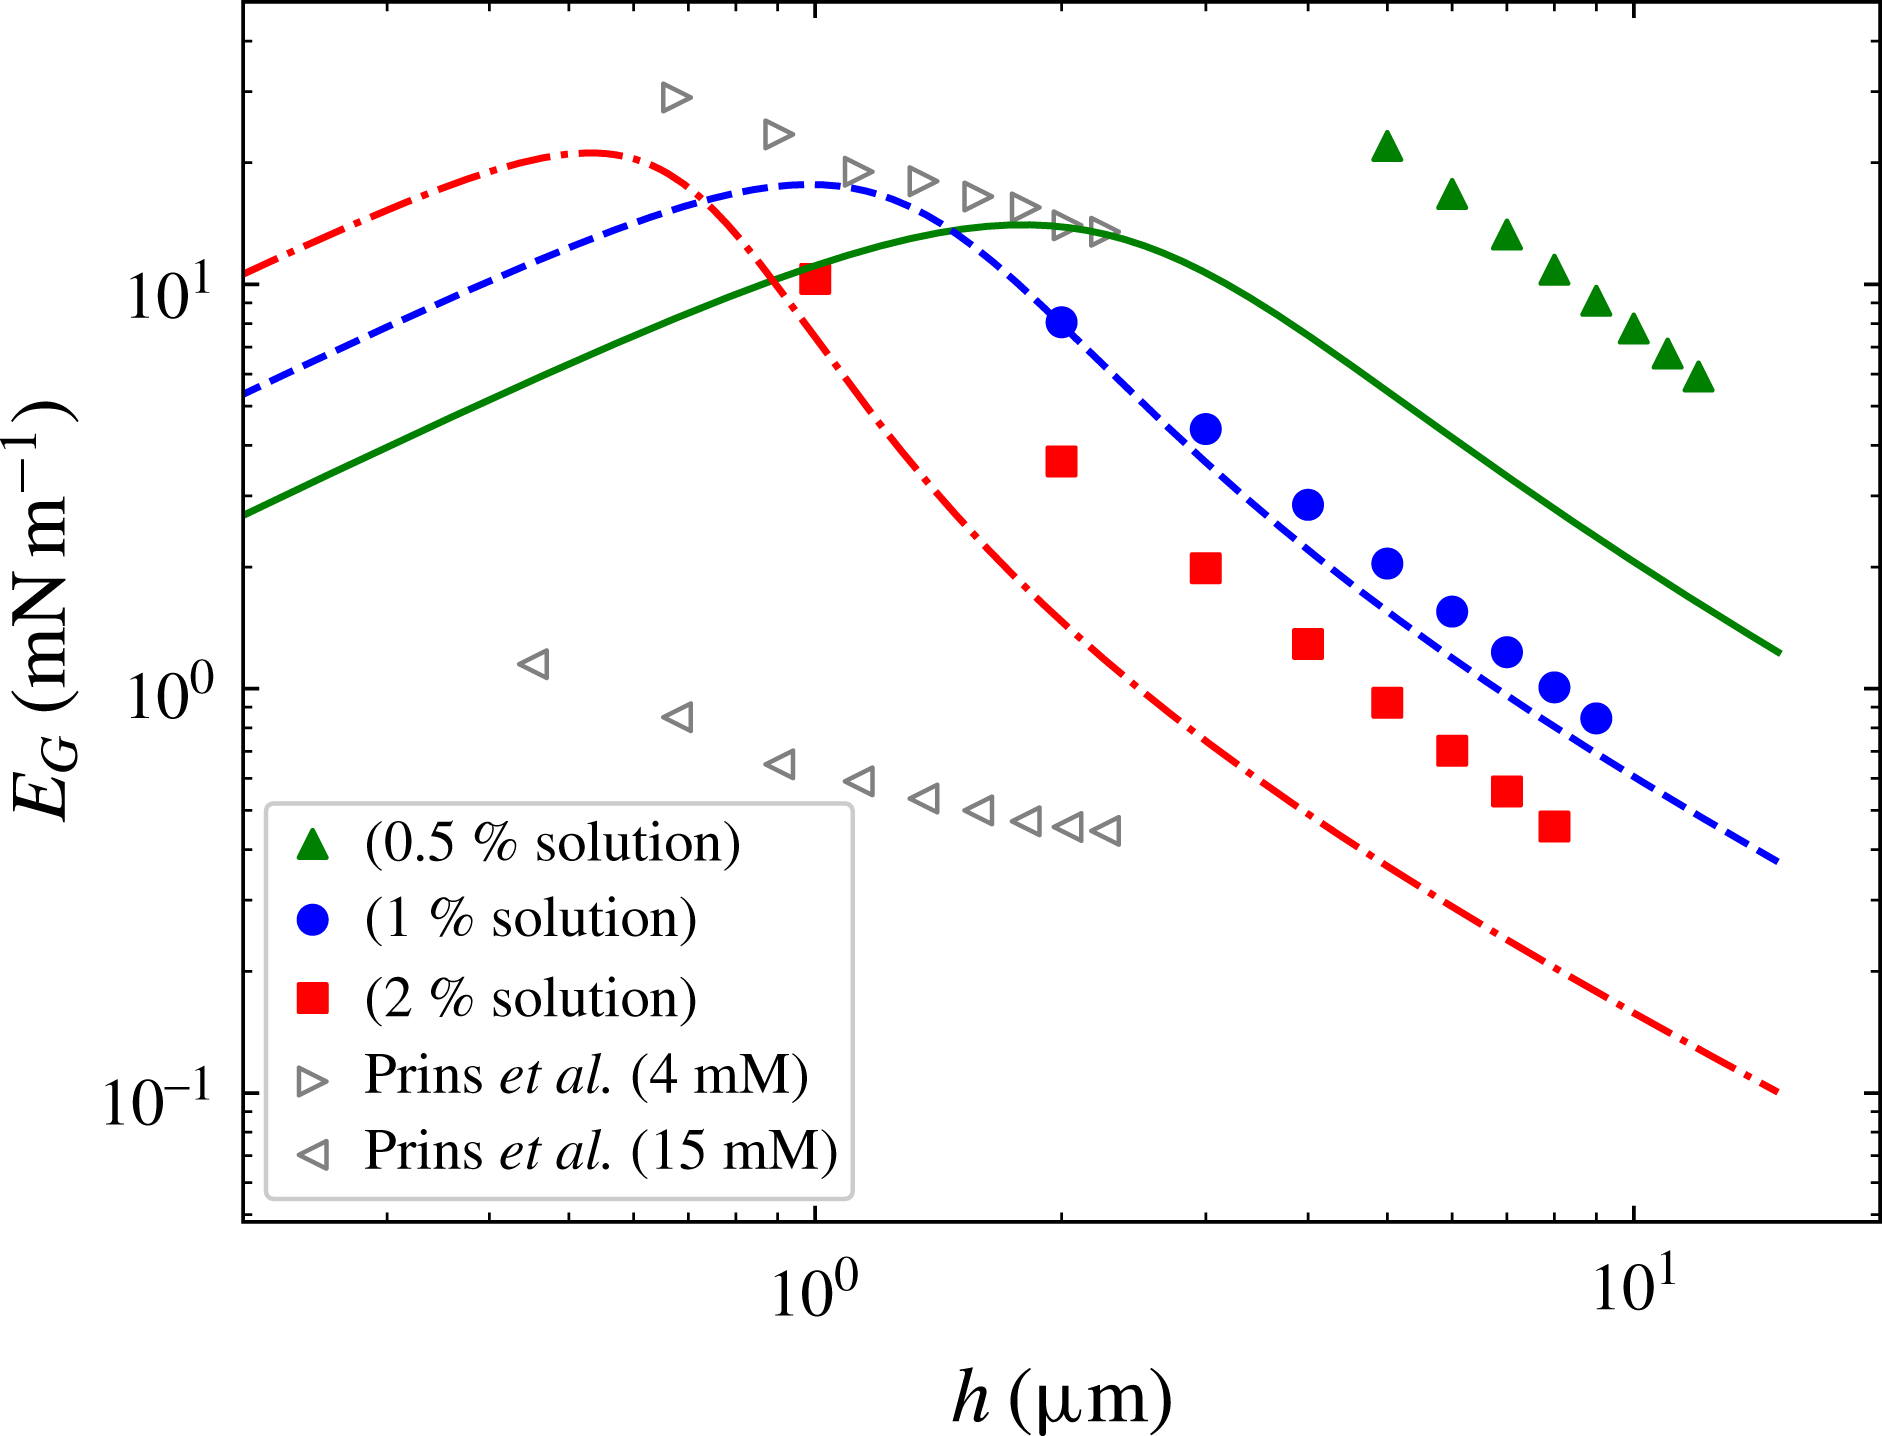
is displayed in figure 4.
Gibbs elasticity is measured by extracting
 $-\text{d}\unicode[STIX]{x1D70E}/\text{d}\ln h$
from figure 3 with (3.4). The measured values are consistent with the reported values in the literature (Prins, Arcuri & Van den Tempel Reference Prins, Arcuri and Van den Tempel1967) but greater than the prediction of the Langmuir adsorption model in (1.2).

In figure 4, we compare our measurement with the values in the literature. Measurement by Prins et al. (Reference Prins, Arcuri and Van den Tempel1967) reports that
 $E_{G}$
is
 $14{-}29~\text{mN}~\text{m}^{-1}$
for 4 mM and
 $1.1{-}0.45~\text{mN}~\text{m}^{-1}$
for 15 mM solution of sodium dodecyl sulphate (SDS). (Prins et al. (Reference Prins, Arcuri and Van den Tempel1967) measured the film elasticity, which is defined as
 $E_{f}=2A\text{d}\unicode[STIX]{x1D70E}/\text{d}A$
. We used the conversion that
 $E_{G}=E_{f}/2$
.) According to the manufacturer’s chemical safety data sheet, the main ingredient of the soap that we used is also SDS, and the concentration of SDS in 1 % solution is estimated as roughly
 $5\pm 2~\text{mM}$
. The comparison shows that our measurement of
 $E_{G}$
is in rough agreement with the previous reports and supports our measurements.
The curves in figure 4 are the estimation of
 $E_{G}$
based on the Langmuir adsorption through direct differentiation of (3.2). For all values of
 $c_{0}$
, our physical model underestimates the elasticity. The discrepancy between the measurement and the model shows the complex fluid nature of soap films. The Langmuir adsorption is a simple and idealized model in which constant adsorption and desorption rates are assumed. However, in soap films, the interplay between the surface chemistry and the hydrodynamics complicates the overall dynamics, and a complete description of its physical properties requires further thorough consideration.
Finally, we remark that in the range in which we can conveniently establish a flowing soap film, the Gibbs elasticity is smaller than the Marangoni elasticity. The Marangoni elasticity is reported to be
 $22~\text{mN}~\text{m}^{-1}$
in soap films made of 1 %–4 % soap solution in the thickness range between
 $4~\unicode[STIX]{x03BC}\text{m}$
and
 $11~\unicode[STIX]{x03BC}\text{m}$
(Kim & Mandre Reference Kim and Mandre2017). Even though a soap film requires both elasticities in order to last for a long time, only those with sufficient Marangoni elasticity can be established in the first place. Moreover, the two elasticities are complementary: the Gibbs elasticity diminishes as
 $\unicode[STIX]{x1D6E4}\rightarrow \unicode[STIX]{x1D6E4}_{\infty }$
; the Marangoni elasticity diminishes as
 $\unicode[STIX]{x1D6E4}\rightarrow 0$
. Considering that fast disturbances are commonly encountered in usual laboratory environments, soap films with greater Marangoni elasticity are expected to be observed more frequently.
4 Summary
We have presented a non-intrusive method to measure the surface tension of a flowing soap film set-up. The method is applicable to standard soap film set-ups whose main components are thin flexible wires serving as channel walls. When a soap film is formed between wires, the wires are bent towards each other by the action of the surface tension. We showed that the bending curvature is determined by the relative strength of the surface tension to the tension of the wire.
Using the presented protocol, the surface tension was measured by probing the bending curvature of soap films made under different conditions. Our measurements show that a soap film has a surface tension of
 $30~\text{mN}~\text{m}^{-1}$
if its thickness is relatively thick or if it is made of soap solution of higher concentration. Otherwise, the surface tension deviates from the asymptotic value of
 $30~\text{mN}~\text{m}^{-1}$
and increases. Two distinct physical processes, thinning of soap film and dilution of soap solution, yield the same consequence that the surface tension is increased.
We demonstrated a theoretical model using surfactant conservation and the Langmuir adsorption isotherm. These two equations can be solved for an analytic solution, and two parameters of the model determined by matching the model and experimental data. These parameters are in agreement with other independent measurements.
Lastly, using our measurement of the surface tension with respect to the thickness of the film, we estimated the Gibbs elasticity. In our experimental range, the Gibbs elasticity is greater when the film is made of dilute soap solution or when the film is thinner. In our set-up, the Marangoni elasticity is larger than the Gibbs elasticity.
Acknowledgements
S.M. and I.K. contributed equally. We thank X.L. Wu for the use of ring tensiometer.