Introduction
Research conducted in several languages has suggested some individual variability in the development of linguistic skills. The bulk of research also suggests rapid growth in lexical skills in the first years of life, but the growth of grammar skills has been less studied. Personal and family-related variables have also been associated with the development of linguistic skills, but more research on how these variables shape the growth curves of vocabulary and grammar is needed. Additionally, research results have highlighted a high interdependence between lexical and grammatical skills across a large variety of languages, but studies on this and the previous issues are particularly scarce in European Portuguese. Thus, the goals of this study were to analyze the growth and stability of lexical and grammar skills, to explore differences in growth as a function of personal and family-related variables, and to investigate the inter-relationships among lexical and grammar dimensions in European Portuguese-speaking toddlers.
Vocabulary and grammar development
Children typically produce their first words around their first birthday. These first words are usually produced sparsely, but after a few months children typically produce an increasing number of words, which has been described as an acceleration in the growth of vocabulary, until at least age 2;6 (Bates, Dale, & Thal, Reference Bates, Dale, Thal, Fletcher and MacWhinney1995; Goldfield & Reznick, Reference Goldfield and Reznick1990). Consistently, several longitudinal studies involving English-speaking toddlers under the age of 2;6 have provided empirical evidence of the accelerated quadratic growth in vocabulary (Brooks & Meltzoff, Reference Brooks and Meltzoff2008; Ganger & Brent, Reference Ganger and Brent2004; Huttenlocher, Haight, Bryk, Seltzer, & Lyons, Reference Huttenlocher, Haight, Bryk, Seltzer and Lyons1991). Although most studies have been conducted with English-speaking toddlers, similar findings have been observed in longitudinal (e.g., Stolt, Haataja, Lapinleimu, & Lehtonen, Reference Stolt, Haataja, Lapinleimu and Lehtonen2008) and cross-sectional (e.g., Marjanovič-Umek, Fekonja-Peklaj, & Podlesek, Reference Marjanovič-Umek, Fekonja-Peklaj and Podlesek2013) studies performed in other languages. Although most studies converge on this finding, certain exceptions remain. For example, a study involving Slovenian speakers using a longitudinal design in which children were assessed between 1;4 and 2;7 showed that vocabulary growth was better described by a cubic (S-shaped) function in which the acceleration was higher during the intermediate time-points and slower during the first and final time-points (Marjanovič-Umek, Fekonja-Peklaj, & Sočan, Reference Marjanovič-Umek, Fekonja-Peklaj and Sočan2017). This finding seems to contradict a previous study, which was also conducted with Slovenian-speaking children but used a cross-sectional design, showing that a quadratic function was the most adequate to describe vocabulary growth between the ages of 0;8 and 2;6 (Marjanovič-Umek et al., Reference Marjanovič-Umek, Fekonja-Peklaj and Podlesek2013). Although a quadratic growth function has been found to most adequately describe vocabulary growth until the age of 2;6 in most studies, this has not been the case in studies involving older children. Several studies in children older than 2;0–2;6 suggest that growth in vocabulary is nearly linear after this age until at least the age of entrance into primary school (Eriksson, Reference Eriksson2017; Huttenlocher et al., Reference Huttenlocher, Haight, Bryk, Seltzer and Lyons1991).
In addition, a large variation in vocabulary development has been documented. The variability in word production is very low before the age of one because most children at this age have not begun to produce words, but the variability in individual trajectories increases as the number of words produced by children increases in the highest percentiles some months later (Bates et al., Reference Bates, Dale, Thal, Fletcher and MacWhinney1995). This finding is illustrated by a large-scale study performed to validate the European-Portuguese versions of the Communicative Development Inventories as follows: at the age of 1;0, the children in the 10th percentile produced no words, and the children in the 50th and 90th percentiles produced 2 and 13 words on average, respectively; at the age of 1;4, the children in the 10th, 50th, and 95th percentiles produced 3, 18, and 65 words, respectively; and the number of words produced increased to 57, 200, and 436 in the 10th, 50th, and 95th percentiles by the age of 2;0 (Viana, Cadime, et al., Reference Viana, Pérez-Pereira, Cadime, Silva, Santos and Ribeiro2017). However, this study employed a cross-sectional design, which inhibited drawing conclusions regarding individual trajectories of vocabulary growth.
One of the first markers of grammar development is the ability to combine words. Studies using parental reports indicate that approximately 50% of children already combine words by approximately ages 1;5 to1;7, and nearly all children combine words by the age of 2;0 (Simonsen, Kristoffersen, Bleses, Wehberg, & Jorgensen, Reference Simonsen, Kristoffersen, Bleses, Wehberg and Jorgensen2014; Trudeau & Sutton, Reference Trudeau and Sutton2011; Viana, Pérez-Pereira, et al., Reference Viana, Pérez-Pereira, Cadime, Silva, Santos and Ribeiro2017). After starting to combine words, children produce sentences which are progressively longer and more complex. The mean length of utterances (MLU), which is measured either by the number of morphemes or by the number of words, is among the most common measures used to assess grammatical development. Studies relying on parental reports that consider the three longest utterances produced by the child, i.e., studies based on the MacArthur Communicative Development Inventories, have shown that the mean length of the longest utterances measured in words (which we refer to as MLLUw in this paper) is approximately 2 at the age of 1;6, but this number increases to more than 5 or even 7 words at the age of 2;6, depending on the language studied (Marjanovič-Umek et al., Reference Marjanovič-Umek, Fekonja-Peklaj and Sočan2017; Trudeau & Sutton, Reference Trudeau and Sutton2011). Regarding the growth of the MLU, cross-sectional studies involving toddlers aged up to age 3;0 using free-play conditions to collect data suggest that a linear relationship exists between the MLU and age (Klee, Schaffer, May, Membrino, & Mougey, Reference Klee, Schaffer, May, Membrino and Mougey1989; Miller & Chapman, Reference Miller and Chapman1981). This linear relationship has also been observed in longitudinal studies, including those conducted by Rollins, Snow, and Willet (Reference Rollins, Snow and Willett1996), who collected samples of spontaneous speech from a group of 36 English-speaking toddlers between the ages of 1;2 and 2;8. However, this finding seems to be limited to MLU development until approximately the age of 3;0. Scarborough, Wyckoff, and Davidson (Reference Scarborough, Wyckoff and Davidson1986) conducted a longitudinal study involving 12 typically developing English-speaking children who were assessed at six-month intervals between the ages of 2;0 and 5;0 and found that the MLU linearly increased until the age of 3;0 and then decelerated. This deceleration in the MLU after the age of 3;0 has also been reported in other studies involving children during the preschool years (Rice, Redmond, & Hoffman, Reference Rice, Redmond and Hoffman2006).
The complexity of the sentences produced by a child constitutes another measure of grammatical development. Typically, the first word combinations primarily include content words, but toddlers progressively introduce function words in their utterances to produce more complex structures (Parisse & Le Normand, Reference Parisse and Le Normand2000). At the age of 2;6, some children already produce subordinate clauses (see Bleses et al., Reference Bleses, Vach, Slott, Wehberg, Thomsen, Madsen and Basbøll2008). Specifically, in the case of European Portuguese, clear cases of subordinate clauses, i.e., finite complement clauses and relatives, and related structures, i.e., clefts, purpose clauses, and inflected infinitives, have been reported to be spontaneously produced between approximately the ages of 2;0 and 3;0 (Duarte, Santos, & Alexandre, Reference Duarte, Santos and Alexandre2015; Lobo, Santos, & Soares-Jesel, Reference Lobo, Santos and Soares-Jesel2016; Santos, Reference Santos2009; Santos, Rothman, Pires, & Duarte, Reference Santos, Rothman, Pires, Duarte, Becker, Grinstead and Rothman2013; Soares, Reference Soares2006). The MacArthur-Bates Communicative Development Inventory (CDI): Words and Sentences (Fenson et al., Reference Fenson, Marchman, Thal, Dale, Reznick and Bates2007) is among the most commonly used instruments to assess language in toddlers, and includes a subscale to assess the complexity of the sentences produced by toddlers between the ages of 1;4 and 2;6. Although this subscale has been included in several CDI adaptations for other languages (e.g., Andonova, Reference Andonova2015; Bleses et al., Reference Bleses, Vach, Slott, Wehberg, Thomsen, Madsen and Basbøll2008; Jackson-Maldonado et al., Reference Jackson-Maldonado, Thal, Marchman, Fenson, Newton and Conboy2003; Mariscal et al., Reference Mariscal, López-Ornat, Gallego, Gallo, Karousou and Martínez2007; Pérez-Pereira & Soto, Reference Pérez-Pereira and Soto2003), the subscales included in the different CDI adaptations differ substantially, and to the best of our knowledge, no longitudinal studies investigating the growth curves of sentence complexity in toddlers aged up to age 2;6 have been performed.
Predictors of vocabulary and grammar growth
Studies have explored the differences in toddlers’ vocabulary as a function of personal and environmental variables. Gender is among the most studied variables. Gender differences have been found in the mean number of words produced in several studies in different languages involving toddlers under the age of 2;6 (Bleses et al., Reference Bleses, Vach, Slott, Wehberg, Thomsen, Madsen and Basbøll2008; Eriksson et al., Reference Eriksson, Marschik, Tulviste, Almgren, Pérez-Pereira, Wehberg and Gallego2011; Feldman et al., Reference Feldman, Campbell, Kurs-Lasky, Rockette, Dale, Colborn and Paradise2005; Jackson-Maldonado et al., Reference Jackson-Maldonado, Thal, Marchman, Fenson, Newton and Conboy2003; Pérez-Pereira & Soto, Reference Pérez-Pereira and Soto2003; Reese & Read, Reference Reese and Read2000; Silva et al., Reference Silva, Cadime, Ribeiro, Santos, Santos and Viana2017; Trudeau & Sutton, Reference Trudeau and Sutton2011). According to these studies, girls produce significantly more words than boys. Gender differences have also been observed in the developmental rate of vocabulary over time. A longitudinal study conducted by Huttenlocher et al. (Reference Huttenlocher, Haight, Bryk, Seltzer and Lyons1991) suggested that the acceleration in vocabulary growth was higher in girls than in boys. The previously mentioned longitudinal study by Marjanovič-Umek et al. (Reference Marjanovič-Umek, Fekonja-Peklaj and Sočan2017), which was conducted in Slovenia, also revealed gender differences in vocabulary growth curves; the growth curve in girls was more linear than that in boys, although an S-shaped curve better fit the full data.
Parental educational level, particularly the maternal educational level, is another highly explored environmental variable that is frequently used as an indicator of family socioeconomic status (SES). The research results regarding the existence of differences in vocabulary as a function of maternal education have been generally consistent: toddlers with more highly educated mothers have been shown to produce a higher number of words than toddlers with less educated mothers (Andonova, Reference Andonova2015; Cadime, Silva, Ribeiro, & Viana, Reference Cadime, Silva, Ribeiro and Viana2018; Fenson et al., Reference Fenson, Marchman, Thal, Dale, Reznick and Bates2007; McGillion et al., Reference McGillion, Herbert, Pine, Vihman, DePaolis, Keren-Portnoy and Matthews2017; Schults, Tulviste, & Konstabel, Reference Schults, Tulviste and Konstabel2012). However, studies exploring the effects of parental education on vocabulary growth curves are scarce, and their findings are inconsistent: several studies found that children with mothers with higher educational levels not only have a larger lexicon but also demonstrate faster growth in the number of words that they are able to produce (Pan, Rowe, Singer, & Snow, Reference Pan, Rowe, Singer and Snow2005; Rowe, Raudenbusch, & Goldin-Meadow, Reference Rowe, Raudenbusch and Goldin-Meadow2012). Nonetheless, other studies suggest that parental education does not significantly affect toddlers’ vocabulary growth curves (Marjanovič-Umek et al., Reference Marjanovič-Umek, Fekonja-Peklaj and Sočan2017).
Studies investigating the effects of personal and environmental variables on grammar are not as abundant as those investigating these effects on vocabulary. Additionally, the findings regarding gender differences in grammar abilities are inconsistent. Some studies have found gender differences favoring girls in sentence complexity (Bleses et al., Reference Bleses, Vach, Slott, Wehberg, Thomsen, Madsen and Basbøll2008; Simonsen et al., Reference Simonsen, Kristoffersen, Bleses, Wehberg and Jorgensen2014), or both the MLU and sentence complexity (Fenson et al., Reference Fenson, Marchman, Thal, Dale, Reznick and Bates2007; Jackson-Maldonado et al., Reference Jackson-Maldonado, Thal, Marchman, Fenson, Newton and Conboy2003; Pérez-Pereira & Soto, Reference Pérez-Pereira and Soto2003), while other studies have found no gender differences in either of these grammar dimensions (Andonova, Reference Andonova2015).
To the best of our knowledge, no studies have investigated whether the growth curves of sentence complexity and the MLU differ between boys and girls or among toddlers with parents with different educational levels in children under the age of 2;6. Studies involving older children have not provided evidence of differences in growth curves. For example, a longitudinal study conducted by Rice et al. (Reference Rice, Redmond and Hoffman2006) included a sample of typically developing children assessed between the ages of 3;0 and 8;0 and found that MLU growth was (negative) quadratic, while the maternal educational level had no effect on the MLU growth curve.
Inter-relatedness of vocabulary and grammar
A well-known discussion is ongoing concerning the inter-relatedness of vocabulary and grammar acquisition, which is centered on the extent to which grammar development can be predicted by vocabulary development, and especially the extent to which such an effect may be interpreted as an argument for a unique linguistic knowledge module including vocabulary and syntax (Bates & Goodman, Reference Bates, Goodman and MacWhinney1999; Dionne, Dale, Boivin, & Plomin, Reference Dionne, Dale, Boivin and Plomin2003; Pérez-Leroux, Castilla-Earls, & Brunner, Reference Pérez-Leroux, Castilla-Earls and Brunner2012). In general, the claim that the lexicon and grammar correspond to two separate components is associated with the generative tradition (Chomsky, Reference Chomsky1995; DiSciullo & Williams, Reference DiSciullo and Williams1987). In contrast, a one-dimensional model has been supported within non-generative approaches to language acquisition.
Studies have consistently indicated that vocabulary is a strong predictor of grammar development (Bates & Goodman, Reference Bates and Goodman1997, Reference Bates, Goodman and MacWhinney1999; Devescovi et al., Reference Devescovi, Caselli, Marchione, Pasqualetti, Reilly and Bates2005). Studies using different versions of the CDI indicate that word combination is already observable in certain toddlers with a 50–100-word lexicon and that more than 90% of toddlers produced word combinations at the 300-word level (Fenson et al., Reference Fenson, Dale, Reznick, Bates, Thal and Pethick1994; Viana, Pérez-Pereira, et al., Reference Viana, Pérez-Pereira, Cadime, Silva, Santos and Ribeiro2017). These findings show the inter-relatedness of lexical and syntactic growth: toddlers start to produce longer and grammatically more complex sentences as their lexicon size increases. Thus, CDI-based studies conducted in several languages have consistently found strong correlations between lexicon size and grammatical development indicators, such as MLU and sentence complexity (Fenson et al., Reference Fenson, Marchman, Thal, Dale, Reznick and Bates2007; Mariscal et al., Reference Mariscal, López-Ornat, Gallego, Gallo, Karousou and Martínez2007; Marjanovič-Umek et al., Reference Marjanovič-Umek, Fekonja-Peklaj and Podlesek2013; Silva et al., Reference Silva, Cadime, Ribeiro, Santos, Santos and Viana2017). Although these studies were cross-sectional, several longitudinal studies have provided similar conclusions. For example, in a study conducted by Trudeau and Sutton (Reference Trudeau and Sutton2011) involving Quebec-French-speaking toddlers aged 1;7 to 2;4, vocabulary at each age-point was significantly correlated with sentence complexity measured six months later. Similarly, the results of the study by Marjanovič-Umek et al. (Reference Marjanovič-Umek, Fekonja-Peklaj and Sočan2017), which was conducted with Slovenian-speaking toddlers, indicate that vocabulary at age 1;7 significantly predicted MLU and sentence complexity measured one year later. Altogether, the more words included in a child's lexicon, the higher the probability that his/her sentences will be more complex.
Some of these studies interpreted these results as an argument for a one-dimensional model of language in which vocabulary and grammar are not stored as separated modules (see Bates & Goodman, Reference Bates and Goodman1997, Reference Bates, Goodman and MacWhinney1999). However, as highlighted by Pérez-Leroux et al. (Reference Pérez-Leroux, Castilla-Earls and Brunner2012), a general effect in which global vocabulary growth predicts the growth of syntactic complexity can be accommodated by both one-dimensional and two-dimensional models since no model excludes the dependency between certain aspects of syntax and lexical knowledge acquisition, namely, the acquisition of functional items or subcategorization properties of lexical items. Nevertheless, a generative approach would exclude the idea that all syntactic knowledge can be reduced to lexical knowledge (see Chomsky, Reference Chomsky1995, p. 170, for the idea that linguistic variation is mostly located in the lexicon, while maintaining the distinction between the lexicon and the computational system).
The length of the utterances produced by toddlers is also closely related to sentence complexity. Cross-sectional studies using the CDI for data collection in several languages found a strong correlation between the MLLU and sentence complexity (Fenson et al., Reference Fenson, Marchman, Thal, Dale, Reznick and Bates2007; Mariscal et al., Reference Mariscal, López-Ornat, Gallego, Gallo, Karousou and Martínez2007; Silva et al., Reference Silva, Cadime, Ribeiro, Santos, Santos and Viana2017). Other studies also found a strong correlation between the CDI sentence complexity subscale and MLU measured from spontaneous speech samples (Trudeau & Sutton, Reference Trudeau and Sutton2011). Similar findings have been obtained in studies using only spontaneous speech measures (Rondal, Ghiotto, Bredart, & Bachelet, Reference Rondal, Ghiotto, Bredart and Bachelet1987; Scarborough, Rescorla, Tager-Flusberg, Fowler, & Sudhalter, Reference Scarborough, Rescorla, Tager-Flusberg, Fowler and Sudhalter1991). Therefore, the relationship between MLU and syntactic complexity has been consistently observed regardless of the type of measure used. Nonetheless, the results of Scarborough et al. (Reference Scarborough, Rescorla, Tager-Flusberg, Fowler and Sudhalter1991) indicated that the relationship between MLU and syntactic complexity, as measured by the IPSyn, decreases as language proficiency increases. Thus, MLU is likely a good indicator of syntactic complexity during the early stages of grammar development when the set of structures produced by children is limited; however, MLU is known to gradually become less informative as the complexity of the structures produced by a child increases, and the variability in the utterance length increases.
Goals of the present study
Although several longitudinal studies investigating the development of vocabulary and grammar and their relationships over time have been conducted in several languages, similar studies conducted in European Portuguese are scarce. In this paper, we present the results of a longitudinal study conducted in European Portuguese-speaking toddlers assessed at four time-points (between the ages of 1;4 and 2;6) using the European Portuguese version of the CDI. To the best of our knowledge, this is the first study of this type for European Portuguese. Exploring the growth curves of vocabulary and grammar and the factors that are related to them in a different language can inform us of whether these matters are universal. Additionally, as mentioned previously, to the best of our knowledge, no studies have investigated whether the growth curves of sentence complexity and MLLU, as measured by the CDI, differ between boys and girls or among toddlers with parents with different educational levels in children under the age of 2;6. Finally, providing additional evidence of longitudinal relationships between vocabulary and grammar in an additional language will strengthen the existing research on this issue and reinforce the necessity of promoting lexical skills at very early ages to foster future linguistic skills.
Therefore, the specific goals of this study were as follows:
(a) To analyze the developmental trends and stability in the growth of vocabulary and two measures of grammar, i.e., MLU and sentence complexity, during the period between ages 1;4 and 2;6;
(b) To determine whether the development of vocabulary and the two grammar dimensions varies as a function of the toddlers’ gender and parental education level;
(c) To explore the longitudinal relationships between vocabulary and the two grammar measures.
Regarding the first goal, considering the results of the aforementioned studies conducted in other languages in toddlers of approximately the same age using parental reports as the main technique for data collection, we expected to find a quadratic growth curve for vocabulary and a linear growth for the MLLUw. Because studies investigating the growth curves of sentence complexity using the CDI are lacking, no predictions were proposed for the development of this grammar dimension. Regarding the second goal of the study, considering the results of previous studies, we expected that gender, but not parental education level, would affect language development. Finally, regarding the third goal, we expected to find results similar to those obtained in studies in other languages as follows: vocabulary predicts MLLU and sentence complexity, and MLLU predicts sentence complexity.
Method
Participants and procedures
The participants were recruited from the validation study of the European Portuguese version of the MacArthur-Bates Communicative Development Inventory: Words and Sentences [PT-CDI-WS] (Silva et al., Reference Silva, Cadime, Ribeiro, Santos, Santos and Viana2017). The parents who participated in the validation study were asked if they were available to participate in a longitudinal study and, in the case of a positive response, provide valid contact information (phone and/or e-mail). In total, 102 parents who provided this information and had children who were aged 1;4 at the time of their completion of the PT-CDI-WS for the validation study were contacted and invited to participate in this study. Following this contact, 92 parents agreed to participate. The PT-CDI-WS was sent to these parents by mail in the week during which their child reached age 1;9, 2;1, and 2;6. The parents were asked to complete the instrument as soon as possible and return it by mail using the pre-paid envelope that was sent with the PT-CDI-WS. Forty-one parents missed at least two assessment times, and therefore were excluded from the study. Consequently, parental reports regarding the language skills of 51 European Portuguese-speaking typically developing toddlers were included in this study. The reports were completed by the mother (n = 45), father (n = 3), or both parents (n = 3).
Premature children born before 32 weeks of gestation weighing less than 1500 gr., children for whom both parents were not European Portuguese-speakers, and children with severe medical conditions that could result in language impairment (e.g., Down syndrome) were not included in the sample because these criteria were the exclusion criteria used in the validation study of the PT-CDI-WS. All seven regions of Portugal were represented in the sample as follows: North (n = 22), Centre (n = 10), Lisbon (n = 10), Alentejo (n = 1), Algarve (n = 4), Madeira (n = 2), and Azores (n = 2). All toddlers attended daycare. Thirty-one toddlers were boys and 20 toddlers were girls. Thirty toddlers had no siblings. Among the toddlers with siblings, most toddlers had only one brother or sister (n = 14), whereas only seven toddlers had two or more siblings.
Most toddlers had mothers who held a higher education degree (n = 32; 62.7%), whereas the remaining toddlers (n = 19; 37.3%) had mothers with lower educational attainment (completed secondary school or less). Approximately half of the fathers (n = 25; 49%) completed a higher education degree, and the other half (n = 25; 51%) completed secondary education or had a lower degree.
Measures and materials
The PT-CDI-WS was used to collect information about the toddlers’ language. This is an instrument used to assess the communicative development of toddlers aged between 16 and 30 months based on parental reports. In this study, the following three subscales of the PT-CDI-WS were used: (a) word production, (b) the mean length of the longest utterances produced by the child (MLLUw), and (c) sentence complexity.
The word production subscale consists of a 639-word checklist. The words are grouped into 22 semantic categories and include nouns, verbs, adjectives, and formulaic expressions (e.g., bom dia ‘good morning’), as well as prepositions and adverbs, namely, certain frequent adverbs related to temporal location (e.g., amanhã ‘tomorrow’) or spatial location (e.g., ali ‘there’). In addition, the word production subscale includes function words / closed-class categories whose emergence in children's speech is known to characterize lexical and syntactic development in the first stages of multiword production: determiners (namely, the definite and indefinite articles), auxiliary and modal verbs, wh-words, and a subset of conjunctions that are among those that emerge first in children's speech (e.g., e ‘and’, porque ‘because’, mas ‘but’) (see Costa, Alexandre, Santos, & Soares, Reference Costa, Alexandre, Santos, Soares, Frota and Santos2008, for European Portuguese; Diessel, Reference Diessel2004). A more detailed description of the categories can be found in Viana, Cadime, et al. (Reference Viana, Pérez-Pereira, Cadime, Silva, Santos and Ribeiro2017). The parents are asked to mark the words produced spontaneously by their child. The total number of words produced by each child is calculated by summing all words marked by the parents.
In the sentence length subscale, parents are asked to report three examples of the longest sentences produced by their children. The mean length of the utterances is calculated by averaging the number of words in the given examples. Since this measure is based on the longest three utterances produced by the child (and that the caregivers can reproduce), we refer to it as MLLUw in the present paper for distinction from MLUw measured on the basis of large samples of spontaneous speech.
The sentence complexity subscale contains 26 hypothetical situations with three options representing different types of structures that could be produced by the child in that context, and a fourth option stating that the child does not produce a similar structure. Each item is given a score of one point if the most complex structure (target structure) is selected. All other options are given a score of zero. We present one of the items in (1) below.
(1) A Maria quer um carro que a mãe tem na mão. A menina diz:
‘Mary wants the car that her mother holds. The girl says:’
a. Popó.Footnote 1
car
b. Dá popó?
give car
c. Dás-me o popó?
give.2sg-me.dat the car
‘Would you give me the car?’
d. Ainda não diz nada parecido (He/she does not say anything similar).
In the example presented in (1), the most complex structure (c) – scored with one point, whereas all others are scored zero – includes the production of overt verbal morphology and a dative clitic. The subscale assesses the emergence of several markers of syntactic development that are relevant at these age stages, several specific of Portuguese, and include: (i) expanded DP with an article or an article followed by a possessive, which is the expected pattern in Portuguese; (ii) overt verbal inflection (first and second singular, known to emerge after the third singular; see the corpus-based study of Gonçalves, Reference Gonçalves2004) and overt subject–verb agreement, including agreement with a postverbal subject; (iii) clitics (enclitic and proclitic), including a se impersonal clitic; (iv) negation; (v) frequent auxiliaries, namely, the future auxiliary (ir ‘go’) and the progressive auxiliary estar a, which both take an infinitive form of the main verb as a complement; (vi) use in relevant contexts of the copula verbs ser ‘be’ and estar ‘be’, with the former associated with individual level predicates and the latter associated with stage level predicates; (vii) use of prepositions, including forms that correspond to the contraction of the preposition with a determiner (e.g., na ‘in the’); (viii) wh-questions; (ix) relative clauses; (x) a causal adverbial clause introduced by porque ‘because’; (xi) a temporal adverbial clause introduced by quando ‘when’ and presenting the future subjunctive; and (xii) purpose clauses, including a case of an inflected infinitive with a second singular inflection (purpose clauses are the context in which inflected infinitives first emerge in spontaneous speech, around age 2;0; see Santos et al., Reference Santos, Rothman, Pires, Duarte, Becker, Grinstead and Rothman2013).
The description of this subscale indicates that it considers specific characteristics of European Portuguese, a language with a rich verbal inflectional pattern, including indicative/subjunctive mood opposition, inflected infinitives, and clitics. These are aspects of syntactic knowledge that are not (because they cannot be) a mere adaptation of the original American version of the CDI-WS (Fenson et al., Reference Fenson, Marchman, Thal, Dale, Reznick and Bates2007); the design of the subscale for Portuguese more closely follows the Spanish version of the CDI (López-Ornat et al., Reference López-Ornat, Gallego, Gallo, Karousou, Mariscal and Martínez2005), with the introduction of relevant adaptations (e.g., clitics exhibit a different placement pattern) and innovative aspects, such as the inflected infinitive. We explore the results of this particular subscale and use it as a basis for exploring possible relationships with vocabulary growth; the need to replicate this study on various languages with different characteristics has already been recognized by Bates and Goodman (Reference Bates, Goodman and MacWhinney1999).
The PT-CDI-WS validation study indicated that the word production (α = .99) and sentence complexity (α = .96) subscales had high levels of reliability (Silva et al., Reference Silva, Cadime, Ribeiro, Santos, Santos and Viana2017). Notably, although clear connections exist between aspects of the vocabulary subscale and the syntactic complexity subscale (for instance, the lexical subscale asks for wh-words, and the syntactic complexity subscale for wh-questions), the type of knowledge tested in the syntactic complexity subscale goes far beyond what is tested in the lexical scale; for instance, the item testing a wh-question presents subject–verb inversion.
Statistical analyses
In this study, the missing data ranged from a low 7% for vocabulary, 9% for the MLLUw, and 19% for sentence complexity. The results of Little's test indicated that the pattern of missing data was MCAR (missing completely at random) (χ 2(136) = 134.144, p = .529). Considering recent recommendations (Dong & Peng, Reference Dong and Peng2013; Newman, Reference Newman2014), we selected the full information maximum likelihood (FIML) to manage the missing data in our study. The FIML is a direct model-based method that computes a case-wise likelihood function with observed variables for each case (Schlomer, Bauman, & Card, Reference Schlomer, Bauman and Card2010).
The statistical analyses were performed using Rstudio version 3.5.1 with the packages ‘lme4’ (Bates, Mächler, Bolker, & Walker, Reference Bates, Mächler, Bolker and Walker2015), ‘lmerTest’ (Kuznetsova, Brockhoff, & Christensen, Reference Kuznetsova, Brockhoff and Christensen2017), ‘lavaan’ (Rosseel, Reference Rosseel2012), and ‘AER’ (Kleiber & Zeileis, Reference Kleiber and Zeileis2008). First, the descriptive statistics were calculated for vocabulary, sentence complexity, and MLLUw at each of the four assessment periods. Then, latent growth modeling was performed to investigate the vocabulary, sentence complexity, and MLLUw growth patterns over time. The effects of the toddlers’ gender and maternal education on the growth patterns were also explored. Pearson's correlations were calculated to investigate the stability of the toddlers’ vocabulary, complexity of sentences, and MLLUw across the age period from 1;4 to 2;6. Finally, structural equation modeling (SEM) was performed to explore the cross-lagged relationships among the three variables over time. All relationships between the variables were explored in a saturated model. In a saturated model, all parameters are freely estimated as indicated by zero degrees of freedom (Anderson, Reference Anderson, Lewis-Beck, Bryman and Liao2004); therefore, no significance testing is performed. The existence of mediation effects in these relationships was also explored. In the mediation analysis, the bootstrapping method was used to compute standard errors (Hoyle, Reference Hoyle2012; Shrout & Bolger, Reference Shrout and Bolger2002). The database and R code are available at <https://osf.io/uz3b8/?view_only=e423403881aa42079aab3d37328126a8>.
Results
Developmental characteristics and individual differences between the ages of 1;4 and 2;6
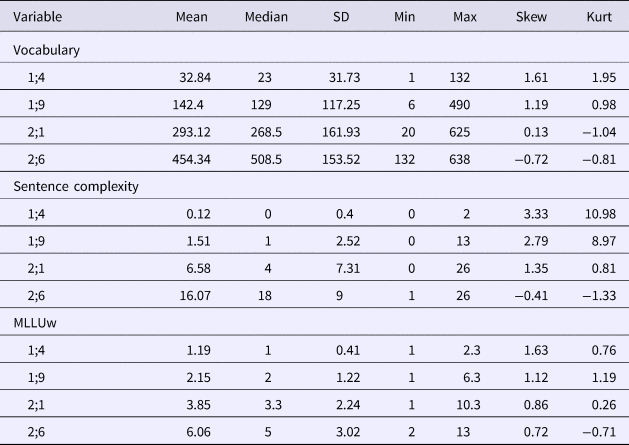
Table 1 presents the descriptive statistics of the different variables of interest included in this study, namely, vocabulary, sentence complexity, and MLLUw scores. The average scores of the three language indicators increased with age. Regarding vocabulary, the toddlers’ mean lexicon size was 33 words at the age of 1;4; this size steadily increased until reaching a mean value of 454 words at the age of 2;6. Regarding grammar, most children did not produce sentences at age 1;4, as shown by the sentence complexity and MLLUw scores. In general, word combination (i.e., utterances with at least 2 words) only begins to be frequent at the age of 1;9. At 2;6, the children produced, on average, 16 of the 26 target structures included in the sentence complexity subscale. The variability in the scores also increases with age and is particularly high in the most advanced age stages.
Descriptive statistics of vocabulary, sentence complexity, and MLLUw

Notes. SD – standard deviation; Min – minimum; Max – maximum; Skew – skewness; Kurt – kurtosis.
Figure 1 presents the box-plots of these variables at different time-points. The medians, first and third quartiles, ranges, and outliers are presented. The box-plots indicate that the variability in all variables increases over time. Moreover, the skewness progressively decreased and, in the case of vocabulary and sentence complexity, shifted from positive to negative between the ages of 2;1 and 2;6 as the children start to produce more complex sentences and a higher number of words. A noticeable increase in the sentence complexity scale scores was observed between the ages of 2;1 and 2;6, confirming that this period is particularly associated with the emergence of complex syntax.
Box-plots of vocabulary, sentence complexity, and MLLUw at each of the four assessment times.

Growth patterns
Visual inspection of the variables’ distributions (see Figure 1) showed potential ceiling effects in both the vocabulary and the sentence complexity scores at age 2;6. According to Uttl (Reference Uttl2005), ceiling effects occur “when a substantial proportion of individuals obtain either maximum or near-maximum scores and cannot demonstrate the true extent of their abilities, resulting in score distributions that are compressed at the upper end of performance” (p. 460).
In the presence of ceiling effects, regular growth curve models are known to lead to biased parameter estimation and incorrect conclusions about the shape and magnitude of the changes (Uttl, Reference Uttl2005). In this case, the Tobit growth model is recommended for analyzing longitudinal ceiling data (Wang, Zhang, McArdle, & Salthouse, Reference Wang, Zhang, McArdle and Salthouse2009). This type of model is also known as a ‘censored regression model’. Basically, it assumes that all observations higher than a prespecified ceiling threshold are censored, i.e., unknown (but assuming that they are higher than that threshold). To explore the existence of ceiling effects, we used the guidelines of Uttl (Reference Uttl2005), where the following quantity:
 $$\lpar {{\rm Maximum} - {\rm Mean}} \rpar / {\rm SD},$$
which is called the standardized difference, is used to explore ceiling effects and to estimate the ceiling proportion. Uttl found significant ceiling effects when the standardized difference was approximately 2 or smaller. This standardized difference was calculated for each target variable of our study and at each assessment moment. Considering the cut-off point suggested by Uttl, significant ceiling effects occur for both vocabulary and sentence complexity at age 2;6 (standardized differences = 1.20 and 1.10, respectively). No evidence of ceiling effects was found for the other assessment times or for MLLUw at any assessment time, given that the values of the standardized difference were higher than 2.
To specify the ceiling threshold in each case, one must establish the ceiling proportion, which consists of all maximum or near-maximum scores. In this work, we regard the best 10% of the results of the scale as the near-maximum scores as this proportion is commonly used in the literature addressing similar ceiling issues (for example, see Linton & Kester, Reference Linton and Kester2003; Rodrigues et al., Reference Rodrigues, Rodrigues, São-João, Pavan, Padilha and Gallani2013; Warner, Reference Warner2013). For vocabulary, this criterion implied a ceiling threshold of 576, encompassing a range of 64 words (576 to 639). At age 2;1, only one toddler scored within this ceiling range, and at age 2;6, twelve toddlers (24%) scored within this interval. For sentence complexity, the same criterion produced a ceiling threshold of 25, covering the two highest scores (25 and 26). At age 2;1, two toddlers achieved these maximum scores, and at age 2;6, twelve (24%) toddlers scored within this interval. Despite different data and different measurement scales, these results are in accordance with the findings of Uttl (Reference Uttl2005), where for standardized differences of 1.1–1.2, significant ceiling effects varied from 17% to 25%. As explained above, Tobit modeling was conducted to explore the evolution of both vocabulary and sentence complexity across time. Participants were included as frailties, i.e., as random effects (a mixed-model approach), and the exponential distribution was selected to perform both models because it showed superior fit over the Gaussian family.
Note that floor effects were also observed because a high number of zeros were reported for some variables during the first moments of the study. However, it is important to note that these scores correspond to true scores, that is, they are not due to a problem of the measure, as happens with ceiling effects. For this reason, floor effects did not deserve any special treatment during data analysis. In particular, left censoring was not applied, as it would assume that the zero (or close) scores were negative.
The following procedure was applied to model MLLUw development over time: because MLLUw scores were obtained using a maximum of three utterances, an auxiliary variable was created by multiplying all MLLUw scores by 6. This transformation was performed to obtain discrete data, allowing these scores to be modeled using a negative binomial family. The negative binomial regression is a generalization of the Poisson regression because it has the same mean structure but an extra parameter to model the over-dispersion (see more detailed information in the ‘Appendix’). Using this model, transition of the MLLUw developmental model was directly performed by dividing all results by 6. Linear mixed models with a Gaussian distribution of residuals were assessed and compared with the negative binomial family. Although linear modeling showed adequacy, the negative binomial always exhibited better fitting measures, as expected.
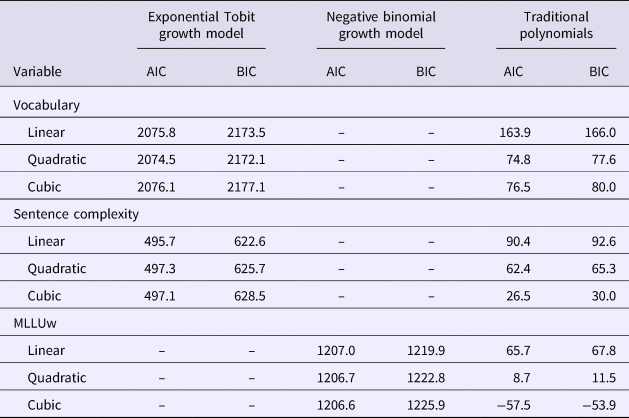
In all longitudinal models, ‘age’ (age group; measured in months) was included as a unique fixed effect. Table 2 presents the results of the comparisons of the successive models, namely, the linear, quadratic, and cubic models. Orthogonal polynomials were used to avoid multicollinearity in these models (see the ‘Appendix’ for additional information on polynomials).
Growth curve modeling: comparison of the fits of the linear, quadratic, and cubic models

Notes. AIC – Akaike's information criterion; BIC – Bayesian information criterion.
A model comparison was performed by inspecting Akaike's information criterion (AIC) and the Bayesian information criterion (BIC). The lowest AIC and BIC values indicate a better fit.
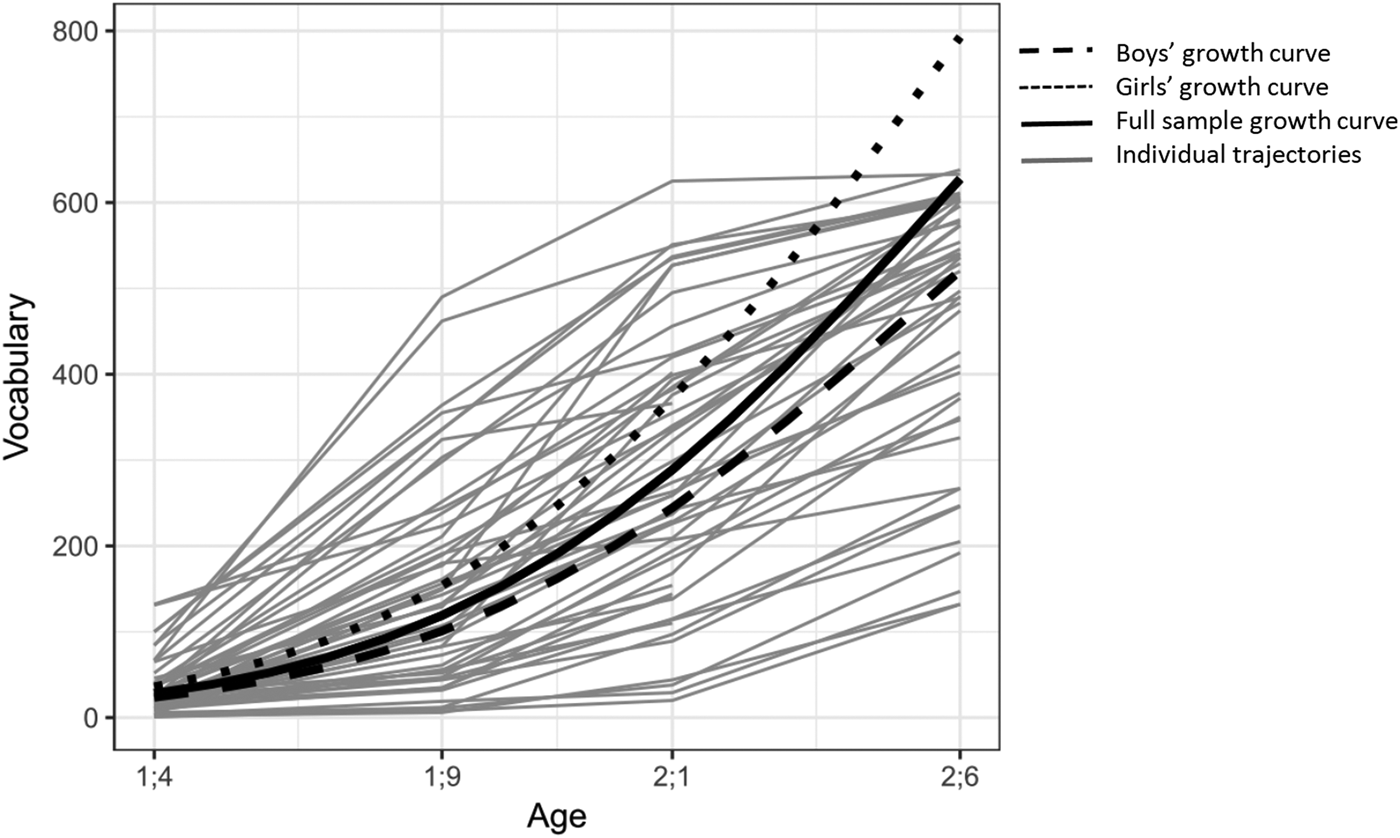
Regarding the vocabulary growth curve, as shown in Table 2, the quadratic Tobit model had a better fit: this model obtained the lowest AIC and BIC values, indicating that this model fits better than the linear Tobit model and that the cubic term does not improve the fit of the model. To simplify the subsequent text, this model is named ‘Model 1’. Accordingly, not accounting for the uncertainty of frailties, the fixed effect of time on the vocabulary scores along the assessment period is written in the following form, where A is toddler age in months:
 $${\rm exp}\lpar {- 3.73831 + 0.56018\, {\rm A} - 0.00736\,{\rm A}^2} \rpar ,$$
The growth curve is illustrated in Figure 2, which also shows the raw growth lines of each toddler. To facilitate the detection of similarities and dissimilarities between the present results and those of other studies, a comparison with traditional polynomial approaches was also performed. To understand which polynomial among the linear, quadratic, and cubic models better (statistically) fits each growth curve in this study, a polynomial regression analysis was conducted. As shown in Table 2, using this type of analysis led to a similar result: the quadratic growth curve had a better fit.
Vocabulary growth curve and observed individual trajectories over time.

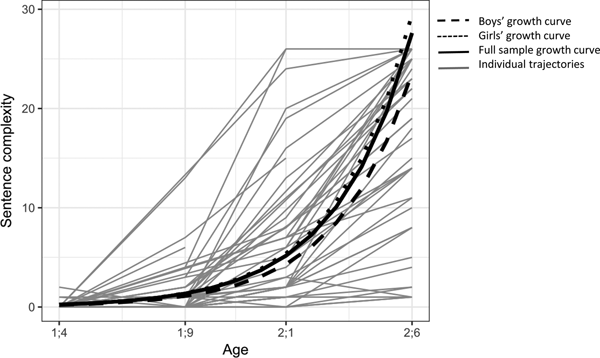
Regarding sentence complexity, the AIC/BIC results indicate that the linear Tobit model fits better (see Table 2). This model is named ‘Model 2’ to simplify the subsequent text. Accordingly, not accounting for the uncertainty of frailties, the fixed effect of time on the sentence complexity (SC) scores along the assessment period is written in the following form:
 $${\rm exp}\lpar {- 6.7317 + 0.3350\,{\rm A}} \rpar ,$$
For comparison with traditional modeling approaches, the same type of regression analysis that was performed for vocabulary was also conducted for sentence complexity using the same time period (age 1;4 to 2;6). For sentence complexity, the cubic approximation fit better (see Table 2). The superiority of the cubic model is due to the flatness of the curve from age 1;4 to 1;9, which is a feature that the quadratic family cannot reproduce. The growth in sentence complexity accelerates after that time-point. The predicted growth curve is illustrated in Figure 3, which also shows the individual growth lines of each toddler obtained using the raw data. Very high heterogeneity was observed in the individual growth lines. Most children obtained a score of zero in sentence complexity at age 1;4, and several children obtained a score of zero at ages 1;9 and 2;1. Although the shapes of the lines differed across toddlers, most children showed a monotonic increase after the age of 1;9.
Sentence complexity growth curve and observed individual trajectories over time.

For MLLUw, although the cubic model has the lowest AIC, the BIC results indicate that the linear negative binomial model fits better than the two alternative models (see Table 2). Therefore, the linear negative binomial model was considered the best fitting model. This model is named ‘Model 3’ to simplify the subsequent text. Accordingly, not accounting for the uncertainty of random effects, the fixed effect of time on MLLUw scores along the assessment period is written in the following form:
 $$1/6 {^\ast} {\rm exp} \lpar {0.0958 + 0.1145\,{\rm A}} \rpar ,$$
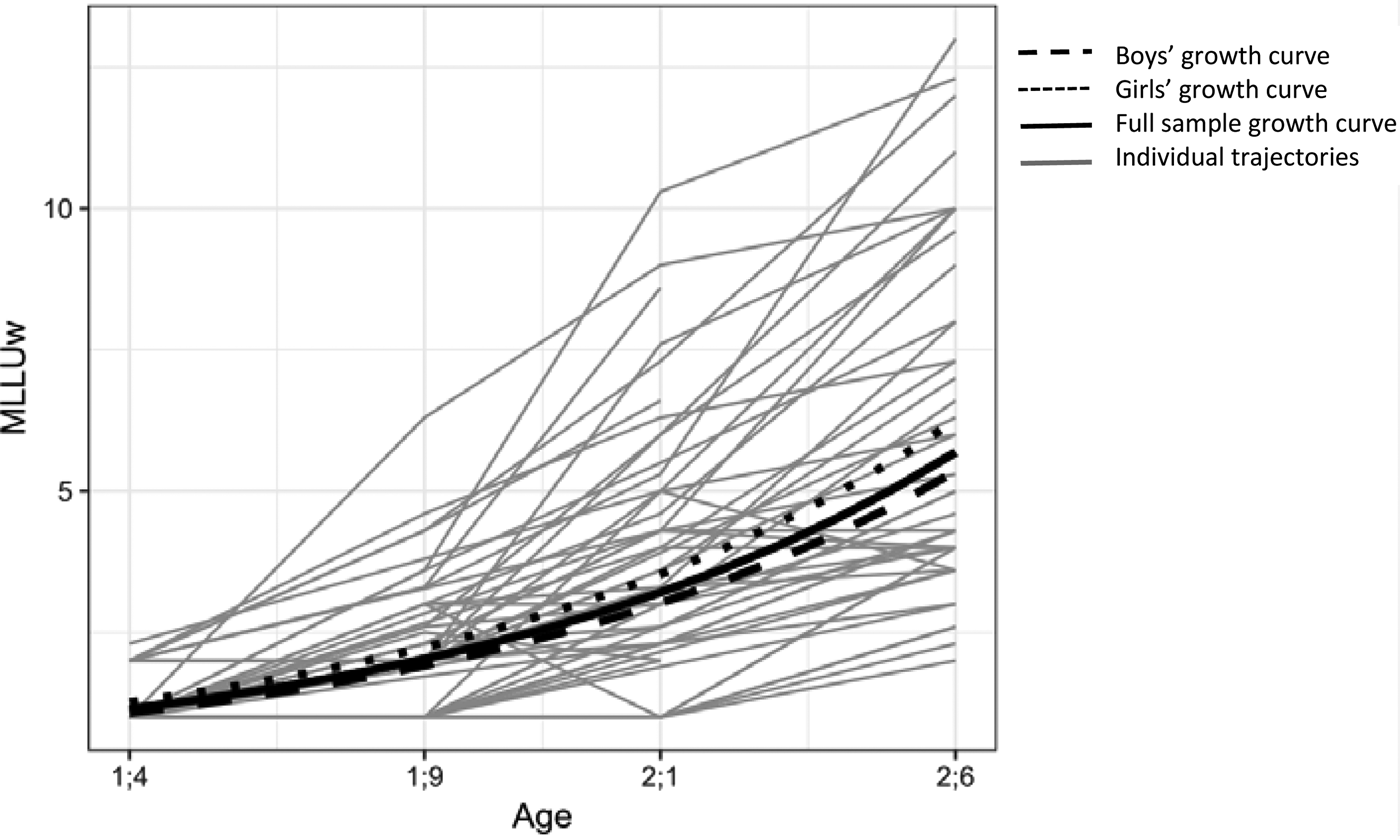
The between-subject variability is 0.168. Figure 4 presents the MLLUw growth curve and the individual growth lines of each toddler computed using raw scores. Regarding the comparison with traditional approaches, the results of the regression analysis for the period from age 1;4 to 2;6 indicated that the cubic approximation was the most adequate to describe the MLLUw growth (see Table 2). As Figure 4 suggests, the cubic approximation fitted better given that low MLLUw values were observed at the initial time-point, followed by an acceleration afterwards. Observation of the individual trajectories suggests that a monotonic increase occurs in the mean length of the utterances produced by the toddlers. Nevertheless, a small decrease in MLLUw scores between two assessment times was reported for four toddlers. Moreover, for several toddlers, MLLUw growth seemed to accelerate particularly after age 1;9.
MLLUw growth curve and individual trajectories over time.

Effects of the toddler's gender and parental education on the growth curves
The toddler's gender and maternal education were separately added to each of the previously mentioned models as predictors to explore their effects on the growth curves of vocabulary, sentence complexity, and MLLUw. Maternal education had no significant effect on the growth factors of each of the three language scores. Therefore, only the toddler's gender was maintained as a predictor in each of the three models.
A marginally significant effect was obtained when gender was added to Model 1 (vocabulary) as follows: given two toddlers, a boy and a girl both at the same age, the girl is expected to have a 52% higher vocabulary score [exp(0.420) = 1.52, p = .063]. Notably, the mean sample vocabulary score is always higher for girls (see Figure 2), and the ratios of these scores at the four assessment times are 1.72 (1;4), 1.30 (1;9), 1.44 (2;1), and 1.18 (2;6).
In Model 2 (sentence complexity), the effect of the toddler's gender was non-significant [exp(0.225) = 1.252, p = .390]. Adding gender as a predictor to Model 3 (MLLUw) did not yield a significant effect [exp(0.128) = 1.137, p = .310].
Stability of language development over time (from ages 1;4 to 2;6)
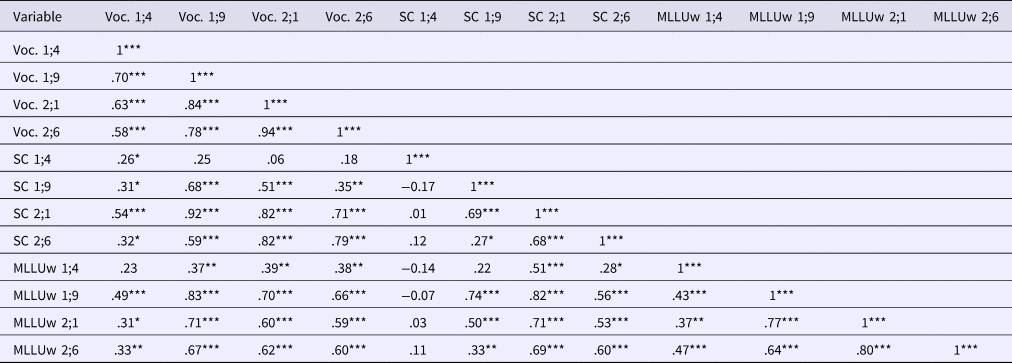
Pearson's correlations between the various assessment times were calculated to study the stability of the toddlers’ vocabulary, MLLUw, and sentence complexity. The correlation matrix is presented in Table 3. The correlations for each individual variable across different times decrease as the time distance increases.
Pearson's correlations among vocabulary, sentence complexity, and MLLUw scores at different assessment times

Notes. Voc. – vocabulary; SC – sentence complexity; MLLUw – mean length of the longest utterances (measured in words); *** p < .001, ** p < .01; * p < .05.
Regarding vocabulary, the high correlations between scores at consecutive time-points suggest that the relative position of the toddlers was quite stable for periods of 4–5 months. The correlation was particularly high between the number of words produced in the final two assessment times, suggesting that changes in the relative position in vocabulary are limited after the children's second birthday.
The correlations between the scores obtained for sentence complexity at each of the four assessment times had a distinct pattern. The correlations of the scores obtained at the age of 1;4 and the scores obtained in the following assessment time were non-significant (see Table 3), likely because most children had a score of zero in sentence complexity at the age of 1;4 (see Table 1). However, as previously mentioned, the size of the correlations increased over time, and the correlation between the scores obtained at the age of 2;1 and those obtained at the age of 2;6 is particularly high, suggesting that the position of the toddlers in sentence complexity is relatively stable.
The size of the correlations for the MLLUw scores between consecutive assessment times is large, suggesting stability in these scores. However, the correlations between the MLLUw scores at the age of 1;4 and the remaining assessment times are lower than those between the scores obtained in the following assessment times, which can be explained by the fact that most children do not produce sentences at age 1;4.
Inter-relationships among vocabulary, MLLUw, and sentence complexity between ages 1;9 and 2;1
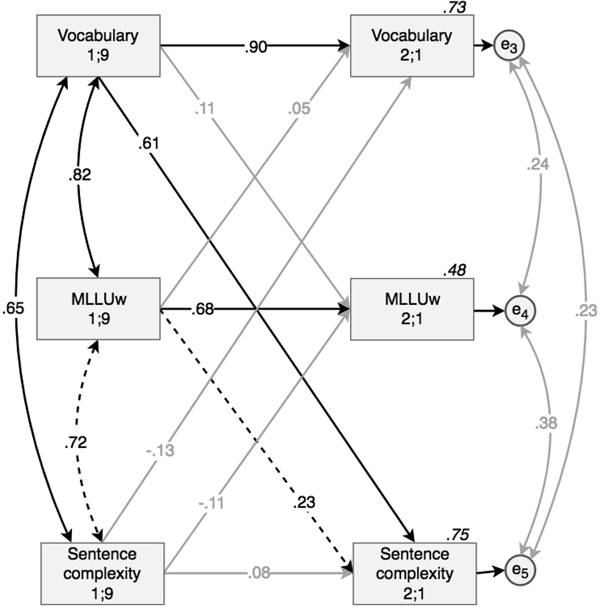
To understand longitudinal changes in vocabulary, MLLUw, and sentence complexity, an auto-regressive cross-lagged path analysis model was specified to examine temporal associations between them over time. The computation included an estimation of the robust standard errors, and the FIML method was used to address missing data. The scores at age 1;4 were not used in this analysis due to the high number of zero scores for MLLUw and sentence complexity at this age. Similarly, the scores obtained at 2;6 were not used due to the existence of ceiling effects in the vocabulary and sentence complexity subscales. Consequently, the scores obtained for vocabulary, MLLUw, and sentence complexity at age 1;9 were used to predict the scores obtained for the same variables at age 2;1.
This model is depicted in Figure 5 and shows that, from age 1;9 to 2;1, both vocabulary and MLLUw are temporal precursors to sentence complexity, but vocabulary has a stronger effect.
Autoregressive cross-lagged path analysis model to investigate the influences of MLLUw and sentence complexity from ages 1;9 to 2;1 across time.

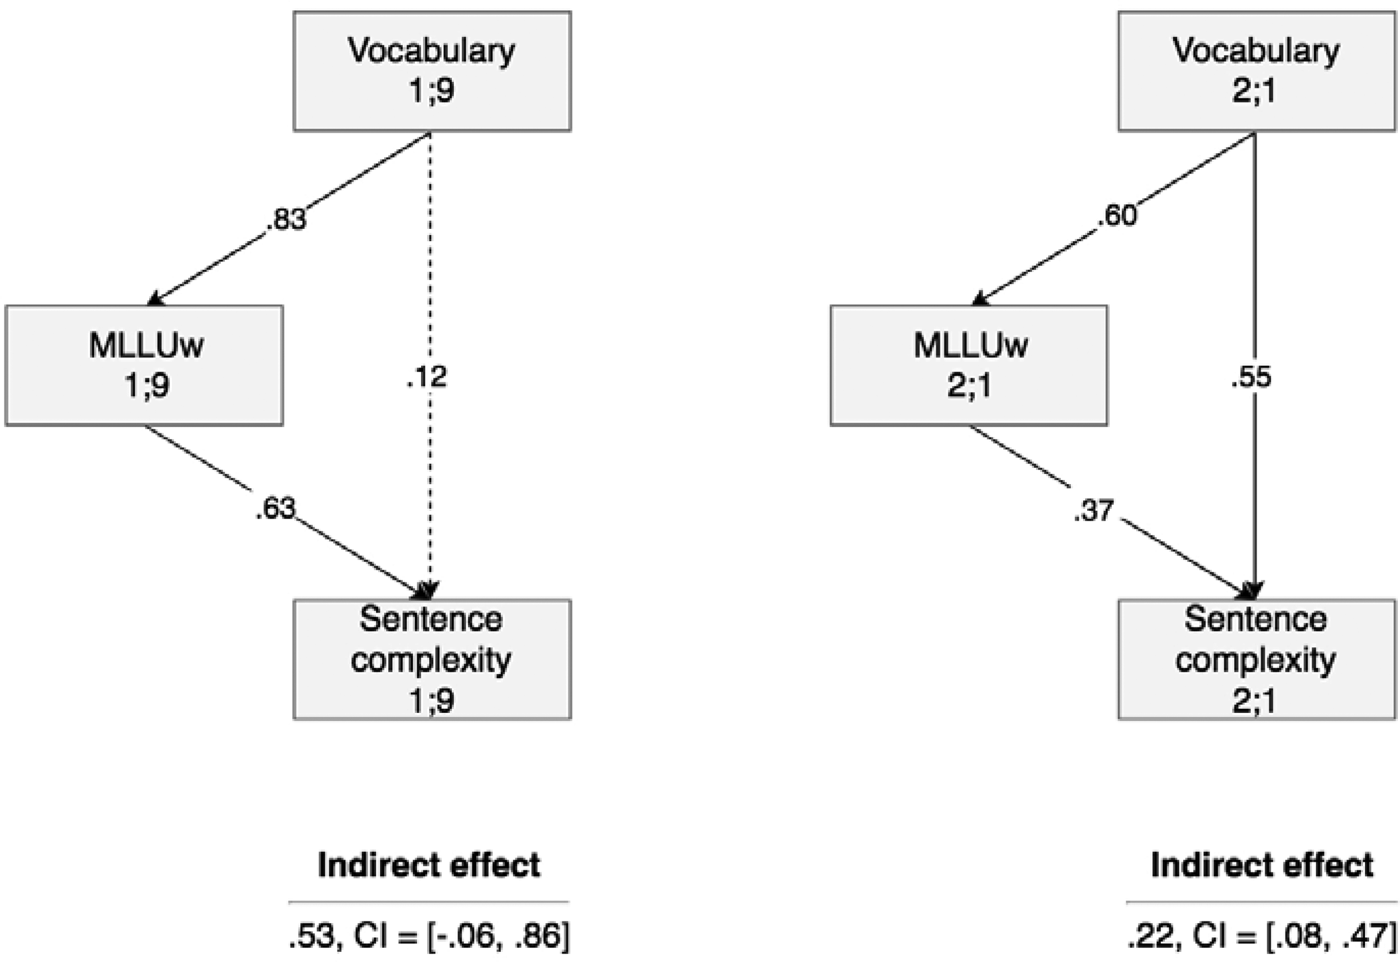
Mediation effects were further tested. We hypothesized that MLLUw mediates the relationship between vocabulary and sentence complexity at both ages 1;9 and 2;1. Figure 6 outlines these mediation effects. The mediation effect of MLLUw in the relationship between vocabulary and sentence complexity at age 1;9 approaches significance, given that 0 touches one of the 95% bootstrap confidence interval (CI) limits. At age 2;1, the mediation effect is significant, but the mediation is only partial given that the direct relationship between vocabulary and sentence complexity is also significant.
Mediation effects of MLLUw in the relationship between vocabulary and sentence complexity at ages 1;9 (left) and at 2;1 (right).

Discussion
The first goal of this study was to analyze the developmental trends and stability in the growth of vocabulary and two measures of grammar, i.e., MLLUw and sentence complexity, using a sample of European Portuguese-speaking toddlers assessed longitudinally between the ages of 1;4 and 2;6.
Regarding the analyses of the growth curves, the exponential Tobit growth model was used to compute the growth curves of vocabulary and sentence complexity and was selected due to its suitability for managing ceiling effects, whereas the negative binomial family was used for MLLUw due to its suitability for managing discrete data and its superior fit compared with other families. As a result, the presented growth curves are exponential functions composed with polynomials, reflecting one of the novelties of this work. The results of our study indicated that a quadratic function best describes vocabulary development in our sample of European Portuguese-speaking toddlers who were followed longitudinally, which is consistent with most of the literature suggesting rapid growth of vocabulary up to age 2;6 (e.g., Brooks & Meltzoff, Reference Brooks and Meltzoff2008; Ganger & Brent, Reference Ganger and Brent2004; Huttenlocher et al., Reference Huttenlocher, Haight, Bryk, Seltzer and Lyons1991; Marjanovič-Umek et al., Reference Marjanovič-Umek, Fekonja-Peklaj and Podlesek2013; Stolt et al., Reference Stolt, Haataja, Lapinleimu and Lehtonen2008).
Regarding MLLUw, the results of our study indicate that a linear negative binomial model had a better fit. Additional analyses were conducted indicating that, considering the time period from age 1;4 to 2;6, MLLUw growth was low at the initial time-point but accelerated rapidly until age 2;6. The average MLLUw was only one word at age 1;4, increasing to a mean of 6 words for the toddlers’ longest utterances at age 2;6. The MLLUw reported at each assessment time-point is highly similar to those reported by studies performed in other languages, which also considered the mean number of the three longest utterances produced by the children (Marjanovič-Umek et al., Reference Marjanovič-Umek, Fekonja-Peklaj and Sočan2017; Trudeau & Sutton, Reference Trudeau and Sutton2011). Because our sample was not followed after age 2;6, we cannot determine whether a deceleration and a plateau in MLLUw also occurs in European Portuguese after age 3;0, as observed in other languages (Rice et al., Reference Rice, Redmond and Hoffman2006; Scarborough et al., Reference Scarborough, Wyckoff and Davidson1986). Future longitudinal studies with European Portuguese speakers should extend the time period covered by the assessments such that the presence of a plateau in MLLUw growth can be investigated.
The results also indicate that an exponential growth function with a linear form on time best describes sentence complexity growth during the period 1;4–2;6, and the comparison with traditional polynomials indicates that the curve is almost flat until age 1;9, given that the production of sentences is limited before that age. Additionally, the individual trajectories appear very diverse. This finding reflects the large variability in the acquisition of syntax that has been observed in toddlers at these age stages (Silva et al., Reference Silva, Cadime, Ribeiro, Santos, Santos and Viana2017; Szagun, Steinbrink, Franik, & Stumper, Reference Szagun, Steinbrink, Franik and Stumper2006).
The results of this study also indicate that there is relative stability in vocabulary and grammar abilities over time. This finding is consistent with other studies indicating the presence of a certain stability in language development; thus, one of the best predictors of a child's linguistic abilities is his/her level in the same variable at a previous time-point (Bornstein & Putnick, Reference Bornstein and Putnick2012; Marjanovič-Umek et al., Reference Marjanovič-Umek, Fekonja-Peklaj and Sočan2017). Almost all correlations used as a measure of stability were significant. However, the correlations involving the sentence complexity scores at the age of 1;4 were non-significant. As observed in other languages using similar instruments (e.g., Pérez-Pereira & Resches, Reference Pérez-Pereira and Resches2011), the sentence complexity subscale had a ‘floor effect’ during the first few months, and several zero scores were obtained. This floor effect may explain why the sentence complexity scores at age 1;4 were not correlated with the same scores in the following assessment time, indicating that the sentence complexity scores at this age stage, as measured by the PT-CDI-WS, are not informative for future language development. Although the particular instrument used to measure sentence complexity should be considered when interpreting these results, we can relate these results to those of studies based on spontaneous production that note rapid syntactic development at approximately age 2;0 that increases between ages 2;0 and 3;0, particularly in subordination and related structures (e.g., Santos et al., Reference Santos, Rothman, Pires, Duarte, Becker, Grinstead and Rothman2013, and Soares, Reference Soares2006, for European Portuguese).
The second goal of our study was to investigate whether the development of vocabulary, MLLUw, and sentence complexity varies as a function of the toddlers’ gender and parental education levels. The results of our study indicate a marginally significant gender effect favoring girls on the growth curve of vocabulary. More accelerated growth in vocabulary was observed among the girls compared to that observed among the boys, which has been reported in other studies investigating children in this phase of language acquisition (Bauer, Goldfield, & Reznick, Reference Bauer, Goldfield and Reznick2002; Huttenlocher et al., Reference Huttenlocher, Haight, Bryk, Seltzer and Lyons1991). However, no significant effects of gender were found on the grammar measures –MLLUw and sentence complexity. Possibly, the low number of sentences produced by children at such early ages hinders the gender gap in language skills that has been profusely described in the literature, given that this gap seems to increase with age (e.g., Eriksson et al., Reference Eriksson, Marschik, Tulviste, Almgren, Pérez-Pereira, Wehberg and Gallego2011).
This study also indicated that the vocabulary and grammar growth curves were similar for toddlers from mothers with different educational levels. Although some studies on vocabulary development have obtained results similar to ours (e.g., Marjanovič-Umek et al., Reference Marjanovič-Umek, Fekonja-Peklaj and Sočan2017), the bulk of research has suggested that maternal educational levels play a role in the development of lexical skills (e.g., Pan et al., Reference Pan, Rowe, Singer and Snow2005; Rowe et al., Reference Rowe, Raudenbusch and Goldin-Meadow2012). However, most of the research supporting the existence of this effect has been conducted in the United States, and thus, there is a possibility that it is not universal. One recent cross-sectional study with European Portuguese-speaking toddlers found significant differences in the mean number of words produced by toddlers of mothers with different educational levels, but the differences were, in fact, negligible (Cadime et al., Reference Cadime, Silva, Ribeiro and Viana2018). Therefore, it is possible that some characteristics of the Portuguese context, such as the higher social and educational support provided by the state or the lower gap between socioeconomic levels, compared to that of the United States, lead to a smaller effect of SES on children's lexical skills. However, our results should not be interpreted as an indicator that the characteristics of the family environment, particularly the mothers’ characteristics, do not play a role in toddlers’ linguistic development over time. Several studies have demonstrated that a mother's language skills, literacy practices, responsiveness, and quantity and diversity of input provided to her children are good predictors of children's language development (Masur, Flynn, & Eichorst, Reference Masur, Flynn and Eichorst2005; Pan et al., Reference Pan, Rowe, Singer and Snow2005). In fact, previous studies suggest that maternal educational levels are closely related to the type of interactions and language use that mothers establish with their children (for example, more input and lexical diversity in child-directed speech), which is in turn correlated with more advanced language skills (including vocabulary and grammar) in children from more educated mothers than those in their peers from mothers with lower educational levels (for a review, see Hoff, Reference Hoff2006). These findings have been interpreted as an indicator that the relationship between maternal education and children's educational levels are mediated by the mothers’ linguistic abilities, language use, and interactions with the child. More importantly, Pan et al. (Reference Pan, Rowe, Singer and Snow2005) conducted a study involving low-income families and indicated that the effects of maternal education on toddlers’ vocabulary were less important than the mothers’ language and literacy skills. Therefore, considering only the maternal educational level may be misleading because a more complete picture requires knowledge of mothers’ abilities, interactions, and practices with their children. Studies on child-directed speech and mothers’ interactions and practices with their children conducted in the Portuguese population are therefore needed, as these studies might help explain children's lexical and grammar development given that maternal education per se seems to be a poor predictor.
The final goal of this study was to explore the longitudinal relationships between vocabulary and the two grammar measures. As expected, vocabulary was a significant predictor of MLLUw at age 1;9, but the relationship between vocabulary and sentence complexity was completely mediated by MLLUw. This finding can be explained by the stage of grammar development: at age 1;9, most children are starting to produce their first word combinations and sentences; therefore, the scores obtained for sentence complexity are highly dependent on MLLUw. However, at age 2;1, vocabulary predicted both MLLUw and sentence complexity, and the relationship between vocabulary and MLLUw was only partially mediated. Our results also indicated that vocabulary at age 1;4 predicts vocabulary and sentence complexity four months later. The close relationship between expressive vocabulary and the size and complexity of the sentences produced by toddlers has been largely reported in both cross-sectional (Fenson et al., Reference Fenson, Marchman, Thal, Dale, Reznick and Bates2007; Mariscal et al., Reference Mariscal, López-Ornat, Gallego, Gallo, Karousou and Martínez2007; Marjanovič-Umek et al., Reference Marjanovič-Umek, Fekonja-Peklaj and Podlesek2013; Silva et al., Reference Silva, Cadime, Ribeiro, Santos, Santos and Viana2017) and longitudinal (Marjanovič-Umek et al., Reference Marjanovič-Umek, Fekonja-Peklaj and Sočan2017; Trudeau & Sutton, Reference Trudeau and Sutton2011) studies. Our findings add to this body of research, showing that lexical skills explain a large portion of the unique variance in morphosyntactic development not only in languages such as English, but also in a language such as European Portuguese, with different properties, including those associated with richer overt morphology. In our study, MLLUw was a significant predictor of sentence complexity at both ages 1;9 and 2;1, but some researchers have argued that the relationship between MLU, measured in either words or morphemes, and syntactic complexity is unpredictable after age 2;0, and that MLU cannot discriminate syntactic development profiles (Klee & Fitzgerald, Reference Klee and Fitzgerald1985). Future studies should explore whether the measure of utterance length used in our study (MLLUw) maintains a close relationship with sentence complexity past age 2;1.
Taken together, our findings suggest that, at such an early phase of language development, a larger size of a toddler's lexicon corresponds to higher probabilities of producing longer utterances and more complex sentences. Given that we explored data collected using the European Portuguese version of the CDI, which includes subscales to globally evaluate vocabulary and syntactic complexity, our goal was to investigate general effects of lexical growth on grammatical growth; contrasting the one-dimensional and two-dimensional models of language was not our goal (for a discussion on the problem of looking for specific effects of the lexicon on grammar, see Pérez-Leroux et al., Reference Pérez-Leroux, Castilla-Earls and Brunner2012), and our findings can be generally accommodated by both perspectives.
The main limitation of this study is the exclusive use of parental reports to collect data about children's linguistic abilities. Studies have demonstrated that scores obtained using parental reports, such as the CDI, are reliable and valid and may even provide a more complete picture of children's linguistic abilities than other methods because parents observe their children in diverse situations and contexts (Fenson et al., Reference Fenson, Marchman, Thal, Dale, Reznick and Bates2007; Law & Roy, Reference Law and Roy2008; Pérez-Pereira & Resches, Reference Pérez-Pereira and Resches2011). However, the stability indicators (i.e., the correlations between assessment time-points) can be inflated when the language measures are drawn from the same informant (mother or father) and when the same measures are used over time (Bornstein & Putnick, Reference Bornstein and Putnick2012). Future studies should consider including measures of spontaneous speech to investigate whether the findings differ across different measures of toddlers’ linguistic abilities.
Author ORCIDs
Irene Cadime, 0000-0001-8285-4824; Célia S. Moreira, 0000-0001-5602-7171; Ana Lúcia Santos, 0000-0003-4758-7462
Acknowledgements
This research was supported by European Regional Development Fund (FEDER) through the European program COMPETE (Operational Programme for Competitiveness Factors), under the National Strategic Reference Framework (QREN) - FCOMP-01-0124-FEDER-029556, by FCT (Fundação para a Ciência e a Tecnologia PTDC/MHC-PED/4725/2012), and by the Research Centre on Child Studies (CIEC-UM, reference POCI-01-0145-FEDER-007562). The first and fourth authors are also supported by grants SFRH/BPD/102549/2014 and SFRH/BD/86795/2012 from FCT.
Appendix
Count data and negative binomial models
Count data refer to observations of non-negative integer values ranging from zero to some greater undetermined value (Hilbe, Reference Hilbe2014). The distribution of counts is discrete, non-negative, and usually has a high number of zeros. Poisson regression is the most famous method used to address count data. Basically, this method assumes that errors follow a Poisson distribution and uses a log link, where the coefficients estimated by the model refer to the natural logarithm of the response variable. In particular, the response variable is modeled through an exponential function.
In the Poisson model, the mean and variance of the errors are assumed to be equal, a phenomenon known as equi-dispersion. However, for many real data (including the data from this study), the variance of the errors is larger than the mean, which is called ‘over-dispersion’. In this case, a more general distribution is needed. The negative binomial distribution is probably the most popular general form of the Poisson distribution (Hilbe, Reference Hilbe2014), which allows an additional parameter known as the dispersion parameter. For more details on negative binomial modeling, see Hilbe (Reference Hilbe2014).
Polynomials
Given a variable x, a polynomial on x is a mathematical expression that can be written as:
 $$p\lpar x \rpar = a_0 + a_1x + a_2x^2 + a_3x^3 + ... + a_nx^n$$
where a 0, … , a n are real numbers, a n is non-vanishing, and n is a natural number determining the degree of the polynomial. Polynomials of degree 1 are called ‘linear’, those of degree 2 are called ‘quadratic’, and those of degree 3 are called ‘cubic’.
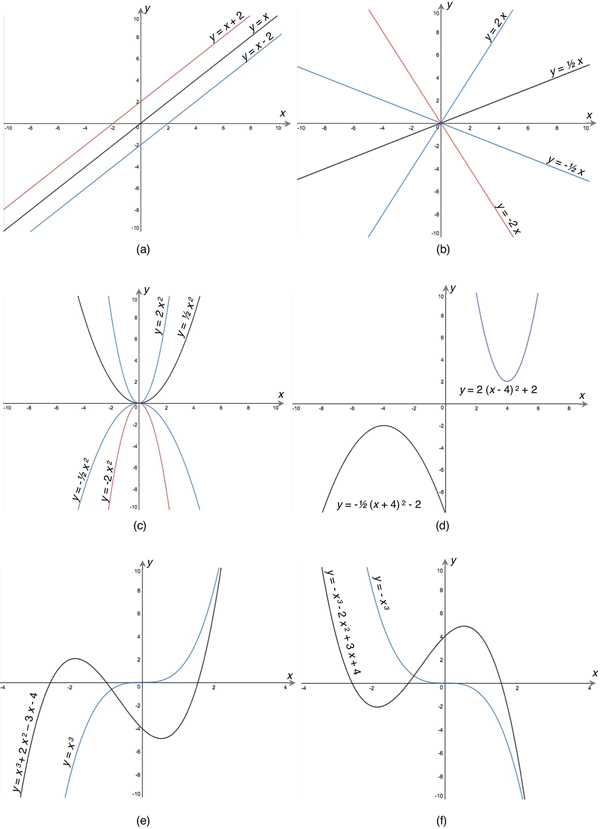
From the graphical point of view, a linear polynomial y = ax + b is represented by a straight line in the (x,y) plane. When x = 0 then y = b, which means that the point (0,b) belongs to the line. Thus, b is the value where the line intersects the y-axis and is frequently called the intercept. Figure A1-(a) outlines the influence of this parameter on the position of the line. Parameter a is called the slope or rate of change. When the slope is positive, an increasing tendency is observed; when it is negative, the tendency is decreasing. Figure A1-(b) illustrates the influence of this parameter on the position of the line.
Example of polynomial graphs.

Graphically, a quadratic polynomial y = ax 2 + bx + c is outlined by a parabola. Parameter a measures the ‘thickness’ of the parabola, as exemplified in Figure A1-(c), and stipulates the opening direction (concavity): when a is positive, the parabola opens up; when a is negative, the parabola opens down. Every quadratic polynomial can be written in the form y = a(x-h)2 + k. This formula is useful for identifying the vertex of the parabola, which is the point (h,k), as illustrated in Figure A1-(d).
Regarding the cubic y = ax 3 + bx 2 + cx + d, graphically it can have two main different forms, depending on the existence of a local maximum. See Figure A1-(e) for an example of these two forms. As in the previous cases, parameters dictate the shape and position of the curve.
Interpreting the independent variable x as time and the dependent variable y as distance, it is interesting to analyze the speed (i.e., rate of change of distance with respect to time) and acceleration (i.e., rate of change of velocity with respect to time) at different time-points. For example, in a linear polynomial, the speed is the same at all points, and the acceleration is null. In a quadratic polynomial, the speed is null only at the origin and becomes greater moving away from it (in absolute terms); however, the acceleration is the same at all points. In the cubic, the situation varies depending on the existence of a local maximum (and minimum). For example, in the cubic y = x 3 depicted in Figure A1-(e), the origin is a point where both the speed and acceleration vanish. At all the other time-points the speed is positive; however, the acceleration is negative when x < 0 and positive when x > 0. Regarding the cubic y = – x 3–2x2 + 3x + 4 from the same figure, the acceleration changes from negative to positive when x = –2/3, and therefore, this is an inflection point.
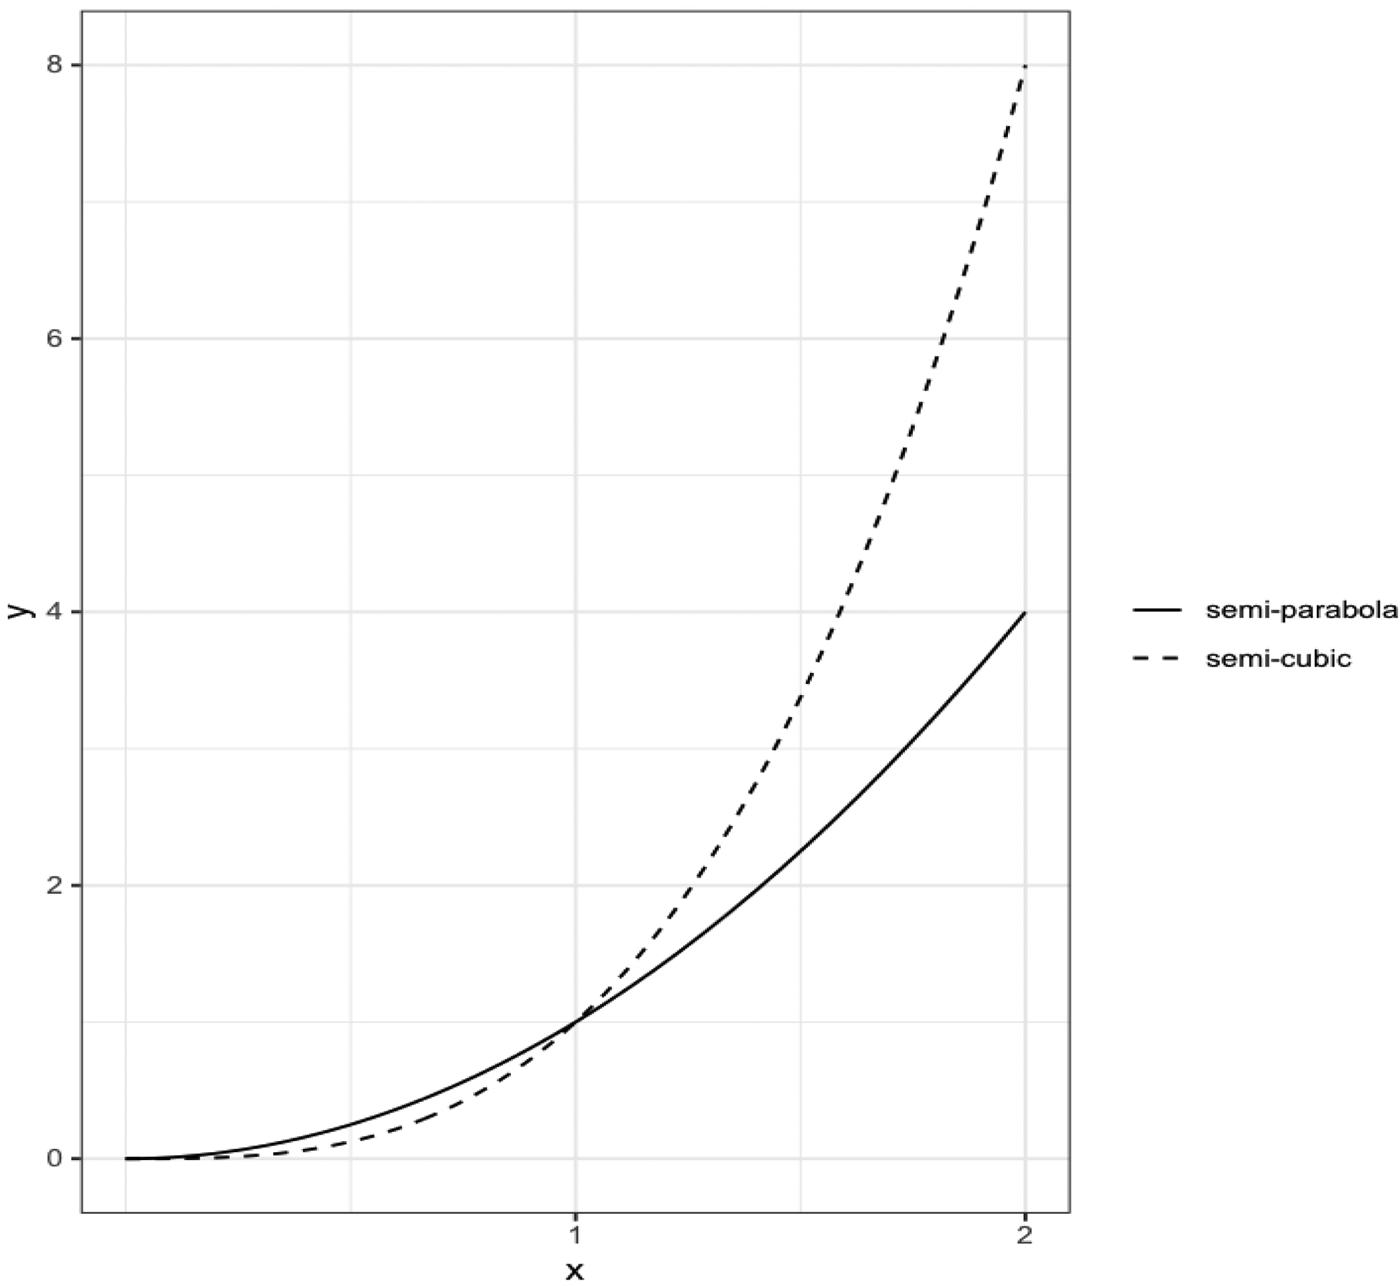
To conclude, a comparison between the semi-parabola and the semi-cubic given by y 1 = x 2 and y 2 = x 3, respectively, is presented in Figure A2. The acceleration in the quadratic is constant but, in the cubic, it is not. It is possible to observe that the cubic takes longer time to ‘take off’, that is, the speed and the acceleration of the cubic is lower at the beginning. However, after reaching x = 1/3, the acceleration of the cubic becomes higher than the acceleration in the parabola. Additionally, when the time-point x = 2/3 is attained, the speed of the cubic becomes superior. Notice, additionally, that when restricting attention only to the time between x = 1 and x = 2, both polynomials can be well approximated by a straight line.
Graphical representation of a semi-parabola and a semi-cubic.