INTRODUCTION
Supply-side ecology (Lewin, Reference Lewin1986) has an important role in determining the distribution of sessile organisms (Underwood & Keough, Reference Underwood, Keough, Bertness, Gaines and Hay2001). In most tropical shallow waters, reef corals show a clear zonation structure (Goreau, Reference Goreau1959; Dollar, Reference Dollar1982; Done, Reference Done1982). In particular, Acropora corals, one of the most dominant groups in the Indo-Pacific Ocean, show zonation at the species level on reef slopes; tabular and corymbose species dominate the shallow slope and branching species dominate in deeper slope areas (e.g. Suzuki et al., Reference Suzuki, Hayashibara, Shirayama and Fukami2008). In the last decade, the importance of the initial life stage on limiting the coral distribution has been focused on (Babcock & Mundy, Reference Babcock and Mundy1996; Mundy & Babcock, Reference Mundy and Babcock1998; Carlon, Reference Carlon2002; Suzuki et al., Reference Suzuki, Hayashibara, Shirayama and Fukami2008, Reference Suzuki, Hayashibara and Toyohara2009). Assuming that larval selection of settlement place is species specific, two hypotheses on pre-settlement behaviour could explain the cause of this depth-related selectivity. One is interspecific habitat segregation in swimming larvae, and the other is the existence of species-specific inducers at settlement. In this study, the latter hypothesis was tested.
If all Acropora larvae swim in the water column at random, the epibenthic community would be the primary determinant for establishment of the zonation. Alternatively, physical factors such as light intensity or current speed could also affect larval settlement, but these factors are not sufficiently stable to reliably guide them to a suitable habitat. For example, luminance changes with time, and current speed differs with weather and wind direction (e.g. Yamano et al., Reference Yamano, Kayanne, Yonekura, Nakamura and Kudo1998). The lack of stability of these variables may increase the risk of larvae to fail to make an appropriate selection. In contrast, biological factors could be a more stable guide for larval settlement because these organisms always exist irrespective of the physical environmental change (at least in an ecological time scale). In reef corals, several studies have reported the important role of epibenthic algae such as crustose coralline algae (CCA) (Morse & Morse, Reference Morse and Morse1991; Morse et al., Reference Morse, Iwao, Baba, Shimoike, Hayashibara and Omori1996; Iwao, Reference Iwao1997; Heyward & Negri, Reference Heyward and Negri1999) or bacteria collected from CCA (Negri et al., Reference Negri, Webster, Hill and Heyward2001) not only on settlement and metamorphosis, but also post-settlement survival (Harrington et al., Reference Harrington, Fabricius, De'ath and Negri2004), whereas the microorganisms not associated with CCA also induced coral metamorphosis (Webster et al., Reference Webster, Smith, Heyward, Watts, Webb, Blackall and Negri2004). Beside, macroalgae and cyanobacteria inhibited coral settlement and increased mortality rates of the recruits (Kuffner et al., Reference Kuffner, Walters, Becerro, Paul, Ritson-Williams and Beach2006). In other sessile organisms, larval settlement was influenced by the presence of conspecific (Jeffery, Reference Jeffery2002) and microbial community (Thiyagarajan et al., Reference Thiyagarajan, Lau, Cheung and Qian2006) in intertidal barnacles, by biofilms in mussels (Bao et al., Reference Bao, Satuito, Yang and Kitamura2006). Considering these results, biological factors, especially epibenthic algae, can affect larval behaviours of corals at settlement in suitable place. Indeed, the habitat specific epibenthos sampled from areas where adults of the same coral species dominated have been shown to induce the settlement of certain coral larvae (Baird et al., Reference Baird, Babcock and Mundy2003). As such a selectivity mechanism was suggested from the comparison among distantly related taxa (i.e. Goniastrea and Fungia), the biological factor is likely to act on the selective settlement of closely related species within the genus Acropora as an environmental signal. To examine whether Acropora corals utilize epibenthic algae as a cue for maintaining the vertical zonation, the larval selectivity on artificial plates which were conditioned at different depth habitats was compared between Acropora species which dominate in each habitat. Considering that the length of the conditioning period affects the algal community structure, the settlement experiments were conducted twice under different conditioning periods.
MATERIALS AND METHODS
Collection of larvae
Study sites were located on the north shoreline of Ishigaki Island (24°27′N 124°12′E), Japan. In this area, four genera and 69 species of acroporid corals have been reported, particularly, Acropora is the most abundant group (Fujioka, Reference Fujioka1998). Three depth points (2.5 m, 5.5 m and 11 m) were selected on the reef slope (Tomino Reef) and one was set on the inner reef (Urasoko Bay, depth 1.5 m) (Figure 1; Suzuki et al., Reference Suzuki, Hayashibara, Shirayama and Fukami2008). From the survey of the degree of cover (Suzuki et al., Reference Suzuki, Hayashibara, Shirayama and Fukami2008), six dominant species (Acropora digitifera, A. hyacinthus, A. muricata, A. intermedia, A. tenuis and A. selago) were selected and used for the settlement experiment. The experiment was performed twice (2004 and 2005), only four species (A. digitifera, A. hyacinthus, A. muricata and A. tenuis) were used in 2005. The corymbose colony species A. digitifera and the tabular colony species A. hyacinthus are abundant on the shallow slopes (2.5 m), whereas two branching species A. muricata and A. intermedia and the corymbose species A. tenuis dominate in the middle (5.5 m) and deep (11 m) slopes. A corymbose species A. selago is commonly observed in the inner reef habitat. In each year, three to six mature colonies per species were collected and induced to spawn in the aquarium around the night of full moon in May. To obtain the larvae simultaneously, the spawning induction technique using H2O2 (Hayashibara et al., Reference Hayashibara, Iwao and Omori2004) was adopted. The larvae were reared in 100 l tanks with filtered seawater and used for the experiment when four days old. Water temperature in the tanks was kept at the same temperature as natural seawater (26–27°C) by an air conditioner.
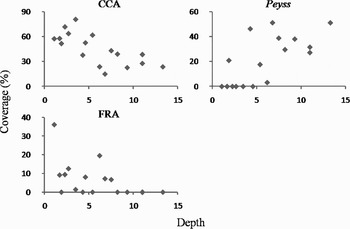
Relationships between the algal coverage on natural substratum per 25 cm2 quadrat and the depth in Tomino Reef. Algal taxa. CCA, crustose coralline algae; Peyss, Peyssonnelia spp.; FRA, filamentous red algae.

Analysis of the algal coverage on natural substratum
To describe then vertical distributions of encrusting algae on the reef slope, the algal coverage within a 5 cm quadrat was calculated at 16 different depths (1.1, 1.7, 1.9, 2.3, 2.7, 3.5, 4.3, 4.6, 5.4, 6.2, 6.8, 7.5, 8.2, 9.3, 11 and 13.3 m). Photographs were taken randomly in three quadrats at each depth in May 2006. Algal coverage of each major taxon on the digital image was specified using the function of selecting a particular colour area in the software Photoshop 7.0.1 (Adobe Systems) and calculated using Scion Image 4.0.3 (Scion Corporation). To determine if the algal coverage of each taxon varies along depth, a simple regression analysis between the coverage and depth was conducted.
Conditioning of the settlement substratum
To make the habitat specific benthic community, settlement plates (4.5 cm2 with 0.5 cm thickness unglazed tile) was submerged in each depth for 2 months (from 12 March to 12 May) by being fixed on a concrete block in 2004. Because the community structure differs according to the orientation of the plate, sunny (upward-facing) and shaded (downward-facing) plates were prepared by back-to-back setting as paired plates. Eighteen pairs of plates were fixed on a block and three blocks were established in each depth tying them with base rocks by a nylon tube. In the shallow depth (2.5 m), as the effect of wave is strong, the establishment of these blocks was reinforced with bolts and underwater bond. In 2005, the conditioning period was extended for a total of 5 months (from 18 December 2004 to 23 May 2005) in order to more reflect the habitat specificity on the plate community. The site of inner reef was excluded from the experiment and only the upward-facing (sunny) plate was prepared in this year in order to focus on depth difference within a reef slope and protect from wave pressure during winter (the plates were easy to lose if they were setting as paired plates).
Settlement experiment
In 2004, eight plates (four sites × two sides, i.e. paired plates) were randomly apposed in a polypropylene container (210 × 350 × 150 mm), and 1200 larvae were released into the container. Six replicates per species were prepared (total 36 containers), and these were bathed in running seawater to maintain a temperature of natural seawater. To avoid the effect of light penetration from the window on a certain container group consisted of a single species, all containers was randomly arranged in the room. After the larval release, they were reared in calm water with gentle aeration for six days and then the number of settled specimens was counted. At this time, the kind of sessile organism was recorded when a coral juvenile settled on it. Photographs of all plates were taken, and the algal coverage was calculated as stated above. Coverage of each algal taxon was compared among different conditioned plates with the Kruskal–Wallis test because the variance was not homogeneous and statistical significance (P < 0.05) was further examined by Scheffé's test for multiple comparison. To compare the larval selectivity on habitat specific sessile organisms among species, the settlement rate (the number of settlers on a plate/all settlers in a container) in each plate was calculated. This is because the comparison of the number of settlers was difficult due to the difference of the total number of settlers among species. The settlement rate between differently conditioned plates was compared for each species with a two-way ANOVA. The main effects were ‘conditioned depth’ with 3 levels (shallow, middle and deep) and ‘location of plate’ with 2 levels (upward- and downward-facing). Scheffé's test was performed for multiple comparisons. In 2005, the number of plates in a container was three; from shallow, middle, deep sites on the reef slope. Because many plates were lost probably due to storm waves during the conditioning period, four replicates per species (only three in A. digitifera) were prepared (total 15 containers). The number of released larvae per container was 450 in 2005. The settlement rate between differently conditioned plates was compared for each species with a one-way ANOVA, and Scheffé's multiple comparison tests were performed.
RESULTS
Relationship between depth and algal community on natural substratum
Algae on the natural substratum in the study area were classified into three major taxa; crustose coralline red algae (CCA), Peyssonnelia spp. and filamentous red algae (FRA). The coverage of CCA and depth were negatively correlated (R = 0.70, P < 0.01), whereas the coverage of Peyssonnelia spp. and depth were positively correlated (R = 0.66, P < 0.01) (Figure 1). No correlation was found between the coverage of FRA and depth (R = 0.40, P = 0.126).
Epibenthic algae on the plates
EXPERIMENT IN 2004
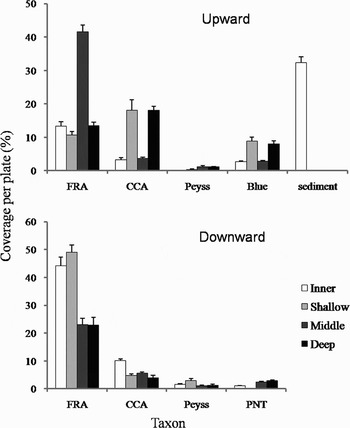
Filamentous red algae were most dominant in most plates, but CCA was abundant in the upward-facing plates, collected from 2.5 m and 10 m of Tomino Reef (Figure 2). Blue-green algae (Cyanophyta) were dotted only on the upward-facing plates. The algal coverage on the downward-facing plates of 5 m and 10 m was relatively small. The coverage of CCA was higher in the upward-facing plates than that in the downward-facing plates not only in surface area but also in thickness (Kruskal–Wallis test, P < 0.01). The algal composition on the plates was similar between the upward-facing plates of 2.5 m and 10 m, and also between the downward-facing plates of 5 m and 10 m.
Coverage of the algal community on the plates used in the 2004 experiment. Upper and lower graph shows the results of ‘upward-’ and ‘downward-’ facing conditioned plate, respectively. Algal taxa: blue, blue-green algae (the others are the same as in Figure 1). Sediment and polychaete nesting tube (PNT) were added as taxon because these were outstanding on specific plates. Conditioned depth of plates is shown on the right side of the lower graph. Inner, shallow, middle and deep indicates the place where the plates were conditioned in Urasoko Bay (1.5 m), 2.5 m, 5.5 m and 11 m on Tomino Reef, respectively. Error bars mean standard deviations.

EXPERIMENT IN 2005
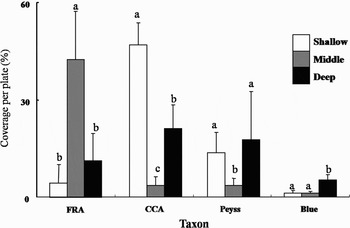
In which only upward-facing plates were prepared, the coverage of all algal taxa was significantly different among the plates from different depths (Kruskal–Wallis test, P < 0.01) (Figure 3). The CCA coverage was highest in the shallow and lowest in the middle. Colonies of Peyssonnelia spp. were fewer in the middle depth plates. Dominance of FRA was observed only on the plates of the middle depth. Although blue-green algae occupied only a small part of the plate, the coverage was slightly higher in the deep.
Coverage of the encrusting algae on the plates used in the 2005 experiment. Open, grey and filled bars mean the conditioned place of plates on shallow (2.5 m), middle (5.5 m) and deep (11 m) on Tomino Reef. Abbreviations of algal taxa are the same as in Figures 1 & 2. Error bars mean standard deviations. Lower-case letters below the site name indicate groupings of the same level in algal coverage by the Scheffé's multiple comparison test (P < 0.05).

Larval settlement rate on the plates
EXPERIMENT IN 2004
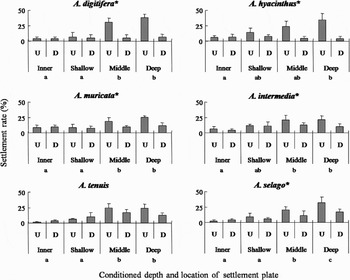
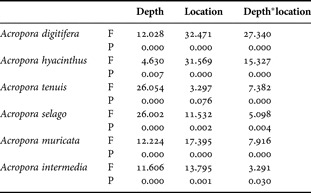
The total number of settlers per container was more than one-third of released larvae in A. tenuis, A. muricata, A. intermedia and A. digitifera (549, 428, 419 and 379 settlers on average, respectively), and less than one-fifth of released larvae in A. selago and A. hyacinthus (146 and 202 settlers on average). The settlement rates of the all species except for A. tenuis were higher on the upward-facing conditioned plates than those on the downward-facing conditioned plates (Figure 4; Table 1). The number of the settlers on the plates conditioned in the 1.5 m depth of Urasoko Bay (UB plates) was lowest among all depths in all species probably because of a large amount of sediment (Figure 2). In four of six species (A. digitifera, A. muricata, A. selago and A. tenuis), the selective settlement rates were significantly lower on the UB and 2.5 m plates than the 5 m and 10 m plates. The larvae of A. selago significantly preferred the deep plates to the middle plates.
Settlement rates of Acropora larvae in the 2004 experiment. U and D indicate ‘upward-’ and ‘downward-’ facing conditioned plate, respectively. Conditioned depths are the same as in Figure 2. Error bars mean standard deviations. Asterisks after the species name represent significant difference of selective settlement rate between the upward- and the downward-facing plates (P < 0.01, two-way ANOVA). Lower-case letters below the site name indicate groupings of the same level in settlement rate by the Scheffé's multiple comparison test (P < 0.05).

Results of two-way ANOVA in the 2004 experiment.

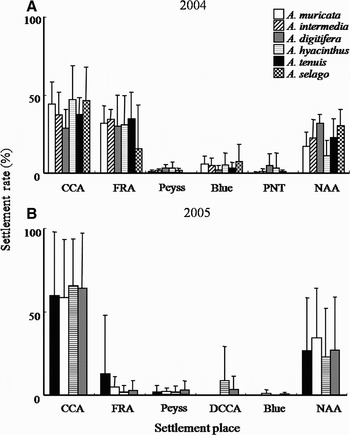
Details of the settlement locations on the plates were recorded (Figure 5A). The settlement rate on the bare area where no visible sessile organisms were observed varied from 11% in A. hyacinthus to 32% in A. digitifera. Nearly half of the all larvae settled on CCA regardless of species. FRA was also preferred by the larvae. Low settlement rates were observed on the Peyssonnelia spp., blue-green algae colonies and polychaete tubes. There was no significant difference in larval preference on a certain algae among species.

EXPERIMENT IN 2005
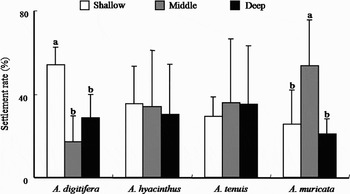
The total number of settlers per container was high in A. digitifera and A. hyacinthus (217 and 147 settlers in average), and was low in A. tenuis and A. muricata (26 and 76 settlers in average). Significant larval preference on a particular plate was observed in two out of four species; a shallow dominant species with corymbose colony A. digitifera and a middle and deep dominant species with branching colony A. muricata (ANOVA, P < 0.05; Figure 6). Approximately half of A. digitifera larvae settled on the plates conditioned at the shallow reef than on the other plates. In A. muricata, 54% of the larvae settled on the plates conditioned at the middle depth. The larvae of other two species A. hyacinthus (shallow dominant) and A. tenuis (middle dominant) did not show a preference for any plates.
Settlement rates of Acropora larvae in the 2005 experiment. Open, grey and filled bars mean the conditioned place of plates on shallow (2.5 m), middle (5.5 m) and deep (11 m) on Tomino Reef. Error bars mean standard deviations. Meaning of lower-case letters above bars is the same as in Figure 4.

More than half of the larvae of the four species settled on CCA colonies (Figure 5B). FRA were not preferred by the larvae in any species. The differences of the algal preference in settlement were not significant among species.
DISCUSSION
In this study, the hypothesis that Acropora coral larvae have species-specific settlement preferences for epibenthic algae was tested for clarification of the role of initial life stage in maintaining vertical zonation. To estimate the larval settlement selectivity on epibenthic algae in a laboratory experiment, it is essential to prepare settlement plates that provide the organisms which actually inhabit on the natural substratum. On the natural reef slope, the amount of CCA decreased with depth, in contrast, the number of Peyssonnelia spp. colonies increased (Figure 1). Although it was unable to make the perfect copy of the algal communities on the natural substrata, the coverage of CCA on the plates conditioned in the shallow depth (2.5m) was very high as well as the ambient CCA distributional pattern in the case when the conditioning period was long (approximately a half year). The remarkable difference of taxonomic composition between the plates and natural substratum was the dominance of FRA on the plates conditioned at the middle depth, whereas the abundance of FRA did not show a depth-related distribution on the natural substratum. However, because the concentrated distribution of FRA is commonly observed within the territory of damselfish which randomly distribute in branching coral area (i.e. middle depth in Tomino Reef), the occurrence of FRA on the settlement plates conditioned at the middle depth is worth using for the assessment of the larval preference. As a result, the encrusting algae on the plates would properly fulfil their roles and aims in the experiment. Although the bacteria communities on the substrata might have affected the coral settlement (Negri et al., Reference Negri, Webster, Hill and Heyward2001), the experiments were conducted under the hypothesis that the bacterial composition also reoccurred on the plate.
In the 2004 experiment, a species-specific preference for a particular plate was not detected, although most species preferred the plates upward-facing conditioned on the middle and lower slopes (Figure 4). These preferred plates were covered mainly by CCA and FRA. This settlement preference for settlement on CCA has been reported previously in other Acropora corals (Morse et al., Reference Morse, Iwao, Baba, Shimoike, Hayashibara and Omori1996). Although Acropora larvae avoid the upside of settlement plates in field (e.g. Maida et al., Reference Maida, Coll and Sammarco1994), they preferred the biota formed in upward-facing condition in this experiment (i.e. under same light condition). This means that coral larvae possess independent preferences for light environment and epibenthic algae, respectively. Because the surface of natural substratum is complex and diverse in any spatial scales, multiple environmental indicators should be required to search for a suitable place for coral settlement.
When the degree of settlement preference to upward-facing plates was compared among six Acropora species, it seemed to be higher in the dominants in shallow waters, A. digitifera and A. hyacinthus, than the other four species (Figure 4). That is, in the selective settlement mechanism of Acropora corals, the kind of favourite algae is not different but strength of the favour to algae might be different among species. The conditioning period of settlement plate was approximately two months in the 2004 experiment, and this period might have been too short to reproduce the ambient biota on the plate.
When the conditioning period was prolonged to five months (i.e. 2005 experiment), two species (A. digitifera and A. muricata) showed a species-specific preference (Figure 6). The algal species composition on the plates was significantly different between ‘shallow’ and ‘middle’ plates; the dominant algae was CCA on the shallow plates and FRA on the middle plates (Figure 2), while the former plates were preferred by A. digitifera and the latter were preferred by A. muricata. This result indicates that the epibenthic algae may play a role as a cue for the species-specific habitat selection of Acropora corals as a settlement inducer. However, even the A. muricata larvae intensively settled on CCA and no algal area (Figure 5B), which suggested that FRA were not selected as actual settlement place in touching directly but emitted water-soluble attractants for A. muricata larvae, otherwise CCA were strongly preferred by A. digitifera larvae regardless of the existence of FRA.
A natural inducer (bromotyrosine derivative) and two enhancers (carotenoids) were identified from CCA, and they had a synergistic effect in the metamorphosis of coral (Pseudosiderastrea tayamai) larvae (Kitamura et al., Reference Kitamura, Koyama, Nakano and Uemura2007). Such a synergistic effect could enhance the species-specific settlement selectivity in Acropora corals. However, the fact that the other two species (A. hyacinthus and A. tenuis) settled equally on each plate conditioned at different depths implies that epibenthic algae do not act as a sole factor in maintaining the vertical zonation of Acropora corals. The conditioning period of five months from winter to early summer in the 2005 experiment may not have been long enough for algal communities to fully develop on the plates; natural algal communities on natural substrata should be used for the settlement experiment to clarify the degree of the contribution of epibenthic algae to the selective settlement mechanism of Acropora corals.
Although the interspecific difference in post-settlement survival is also an important factor for regulating the coral distribution, there were no differences of post-settlement survival among four dominant species in Tomino Reef at least during half a year from settlement (Suzuki et al., Reference Suzuki, Hayashibara and Toyohara2009). Presumably, pre-settlement behaviours such as vertical distribution during swimming may contribute to maintain the zonation, although the effect of other settlement indicators such as light intensity should be examined.
ACKNOWLEDGEMENTS
We thank H. Shimizu, M. Katoh, M. Tamaki, and R. Fuseya for supporting field research. We also thank A. Iguchi, K. Sakamoto, K. Takeo, and T. Tukuda for their help in the experiments. This work was supported by the Experimental Research Budget for Conservation of the Global Environment, Ministry of the Environment, Japan. The sampling of corals was exceptionally permitted by the Okinawa Prefectural Government for research use.