Introduction
The Strategic Plan for Biodiversity 2011–2020, adopted under the Convention on Biological Diversity (CBD), established a roadmap toward the 2050 Vision for Biodiversity of Living in Harmony with Nature (CBD 2011). This Plan adopted 20 Aichi Biodiversity Targets (hereafter, Aichi targets) to catalyse practical, measurable, broad-based and coordinated action toward reducing the rate of biodiversity loss (CBD 2011). The Aichi targets are grouped under five Strategic Goals: address the underlying drivers of biodiversity loss (Goal A); reduce direct pressures on biodiversity (Goal B); improve biodiversity status (Goal C); enhance benefits to all from biodiversity (Goal D); and enhance implementation (Goal E). The Aichi targets serve as a flexible framework under which national governments can set their own biodiversity targets via their National Biodiversity Strategies and Action Plans (NBSAPs) and organize their reports to the CBD. Indicators are necessary to track progress toward these targets, to project future trends, and to inform prioritized and coordinated action (Walpole et al. Reference Walpole, Almond, Besancon, Butchart, Campbell-Lendrum, Carr and Collen2009, Sparks et al. Reference Sparks, Butchart, Balmford, Bennun, Stanwell-Smith, Walpole and Bates2011). However, the ‘bottom-up’ process in which governments are free to select their own targets and indicators has resulted in a diversity of national targets and indicators listed in NBSAPs and included in national reporting to the CBD, limiting the ability to track overall progress at the global level and coordinate collective action (Han et al. Reference Han, Josse, Young, Smyth, Hamilton and Bowles-Newark2017).
Despite the broad-based adoption of the Strategic Plan for Biodiversity 2011–2020 (hereafter, ‘2011–2020 Plan’), several barriers may have prevented the effective tracking of its implementation by national governments. These barriers include: limited capacity in some nations to generate their own relevant indicators (defined here as ‘national indicators’, Bubb et al. Reference Bubb, Chenery, Herkenrath, Kapos, Mapendembe, Stanwell-Smith and Walpole2011) to track national progress; limitations in the quality and quantity of data that underpin effective indicators (Scholes et al. Reference Scholes, Mace, Turner, Geller, Jürgens, Larigauderie and Muchoney2008, Han et al. Reference Han, Smyth, Young, Brooks, Sánchez de Lozada, Bubb and Butchart2014, Gill Reference Gill2015, Navarro et al. Reference Navarro, Fernández, Guerra, Guralnick, Kissling, Londoño and Muller-Karger2017); and limited access, ability or desire to fill gaps in indicator coverage through the use of disaggregated indicators that have been developed at global scales (defined here as ‘global indicators’, Bubb et al. Reference Bubb, Chenery, Herkenrath, Kapos, Mapendembe, Stanwell-Smith and Walpole2011). Also, many of the Aichi targets are not easily measured at global and/or national scales, do not include measurable endpoints, or cannot be easily scaled, leading to different targets at national versus global scales (BIP 2010, Sparks et al. Reference Sparks, Butchart, Balmford, Bennun, Stanwell-Smith, Walpole and Bates2011, Tittensor et al. Reference Tittensor, Walpole, Hill, Boyce, Britten, Burgess and Butchart2014). Furthermore, although the 2011–2020 Plan’s Pressure-State-Benefit-Response framework is a useful means to organize targets, the scientific and policy communities struggle to fully utilize the framework to generate causal storylines that identify the inter-relationships between goals and targets and thus, inform more targeted policy actions (Sparks et al. Reference Sparks, Butchart, Balmford, Bennun, Stanwell-Smith, Walpole and Bates2011).
Although an interim assessment of the success of the 2011–2020 Plan identified 55 scientifically credible global indicators (Tittensor et al. Reference Tittensor, Walpole, Hill, Boyce, Britten, Burgess and Butchart2014), governments often do not utilize these indicators in their national reporting because of uncertainty regarding the coverage, accuracy, suitability and added value of these indicators and their underlying datasets (Han et al. Reference Han, Josse, Young, Smyth, Hamilton and Bowles-Newark2017). Additional barriers include limited access to the underlying data comprising these global indicators and a lack of technical capacity to utilize these indicators (for example, to disaggregate global indicators to extract national-scale data) (Bowles et al. Reference Bowles-Newark, Chenery, Misrachi and Despot-Belmonte2015).
The National Reports submitted by governments to the Secretariat of the CBD serve as the formal reporting mechanism for countries to indicate their progress in implementing the CBD. During the 2011–2010 period, governments submitted reports in 2015 (5th National Reports) and again in 2019 (6th National Reports). The National Reports also contribute to broader assessments of CBD progress such as the Global Biodiversity Outlook reports (CBD 2014) and provide a basis for preparing official documentation for meetings held under the Convention. Although the use of indicators in the National Reports has largely improved between the 4th (submitted in 2010) and 5th National Reports, analyses of the 5th National Reports continue to reflect the above-mentioned barriers and a limited use of indicators and data to effectively track national and global targets (Ervin et al. Reference Ervin, De Silva, Hart, Shrestha, Supples and Ahmed2017). For example, only 36% of 4th National Reports contained a single quantitative indicator (Bubb et al. Reference Bubb, Chenery, Herkenrath, Kapos, Mapendembe, Stanwell-Smith and Walpole2011). An analysis of the 5th National Reports indicated a similar trend in which governments were unable to provide quantitative indicators to track many of the targets (CBD 2015). The limited use of indicators in the National Reports and their lack of consistency limits effective tracking of targets at the national, regional and global scales.
In an attempt to overcome this barrier, the CBD, through its Ad Hoc Technical Expert Group on Indicators (AHTEG), prepared guidance in 2015 on generic indicators that could be effectively used by countries to track progress toward the targets (CBD 2015). This guidance considered the availability of indicators, the quality and temporal and spatial coverage of the data underlying the indicators, and their suitability for tracking progress in the Aichi targets. The AHTEG report also identified specific global indicators for many of the generic indicators that were suitable to disaggregation to national scales for use in national reporting. In addition, the Biodiversity Indicators Partnership (BIP) and the UN Environment Programme World Conservation Monitoring Centre (UNEP-WCMC) have also invested heavily in building capacity for developing indicators within governments worldwide (Brown et al. Reference Brown, Reyers, Ingwall-King, Mapendembe, Nel, O’Farrell and Dixon2014).
With the 2011–2020 Plan coming to an end and consultations on a successor strategy (currently referred to as the ‘Post-2020 Global Biodiversity Framework’; hereafter ‘Post-2020 Framework’) underway, there is an opportunity to analyse and reflect on the formulation of targets and the use of indicators to track any future targets. A better understanding of the barriers preventing effective and consistent use of indicators to track targets at both national and global scales can help inform the development of the targets adopted in the Post-2020 Framework and prevent delays between the adoption of targets and the identification of associated indicators. The improved efficiency would also facilitate more timely and targeted conservation actions that can move the world closer to achieving the 2050 Vision for Biodiversity (CBD 2011).
Although previous analyses of the use of indicators in National Reports provide useful context in the formulation and adoption of targets, several details about current indicator use remain unexplored. For example, we do not know the extent to which countries take advantage of global indicators or follow AHTEG advice on which indicators to use. We do not know which factors might relate to the propensity to use global or AHTEG-recommended indicators. Finally, although others have commented that some goals of the 2011–2020 Plan are more readily measured than others at the global scale (Tittensor et al. Reference Tittensor, Walpole, Hill, Boyce, Britten, Burgess and Butchart2014), this assertion has yet to be quantified for national reporting. We analysed indicator use in the 5th National Reports that were submitted in 2015 (the most recent completed reporting cycle) to the Secretariat of the CBD to address each of these knowledge gaps. We addressed three hypotheses that could potentially explain variance in indicator use: (1) higher income countries would have more resources and capacity to develop indicators than lower income countries and therefore would present a greater number of indicators in their reports; (2) lower income countries would include a greater proportion of global indicators to cover gaps in indicator availability; and (3) countries with more biodiversity would be more engaged in the CBD and therefore include more indicators overall and more indicators recommended by the AHTEG. Building on these results and those of other assessments of national indicator use (Bubb et al. Reference Bubb, Chenery, Herkenrath, Kapos, Mapendembe, Stanwell-Smith and Walpole2011, CBD 2015), we then make recommendations about how the process for formulation of targets and indicators in the Post-2020 Framework could be improved.
Materials and methods
We tabulated indicators used in a sample of the 189 5th National Reports submitted to the Secretariat of the CBD (available at CBD 5th National Report Portal, 2015: www.cbd.int/reports/nr5/; does not include reports from the European Union and Palestine). We selected a sample of 40 reports in a randomized selection process stratified to represent the proportion of countries in each of the four World Bank income groups (low, lower middle, upper middle and upper; World Bank 2018) and to include representation of at least 15% of the nations in each of the nine CBD regions (Africa, Asia, Australia & Oceania, Caribbean, Central America, Europe, Middle East, North America, South America). The stratification was additionally designed to include at least 15% of the reports submitted in each of three languages: English, Spanish and French. Not analysing reports submitted in Arabic and Russian (the other two languages used in reports) caused an underrepresentation of countries from the Middle East and Central Asia, but we note that only 7% of the 189 reports are not available in English, Spanish or French and that our sample included reports from all inhabited continents and were (intentionally, as described) representatively distributed across income, geographic and language groups. The selected countries were Algeria, Andorra, Australia, Bahrain, Barbados, Bhutan, Bolivarian Republic of Venezuela, Brunei Darussalam, Cambodia, Colombia, Costa Rica, Egypt, Ethiopia, Greece, Jamaica, Japan, Jordan, Kiribati, Liberia, Luxembourg, Malaysia, Mexico, Nepal, Norway, Pakistan, Portugal, Republic of Korea, Republic of Palau, Republic of South Sudan, Romania, Rwanda, Saint Lucia, Singapore, Solomon Island, South Africa, Trinidad and Tobago, Turkey, United Republic of Tanzania, Vietnam and Zimbabwe.
For each report, we first identified the indicators used. An indicator was defined as a quantifiable measure, either of a single time period or a trend over multiple time periods, of biodiversity and biodiversity-related variables. Each identified indicator was categorized as either global (developed globally by an organization not associated with the government that issued the report) or national (developed from datasets exclusively from the nation by government agencies or independent parties from within the nation for all or a subset of the country’s land or marine territory). After initial review of the reports, we discovered limited use of regional indicators that were calculated for multiple countries in a geographic region; we tallied these indicators separately as ‘regional’ indicators and combined them with global indicators into an ‘international’ grouping for some statistical comparisons. In addition, we noted for each indicator whether it corresponded with one of the 78 generic or 147 specific indicators recommended by the AHTEG (specific indicators were nested within generic indicators; not all generic indicators had corresponding specific indicators; CBD 2016). To determine the number of indicators used to measure progress on Aichi targets in each of the five Strategic Goals of the 2011–2020 Plan, we additionally tallied each indicator appearing in a national report under the Strategic Goal it addressed.
We calculated summary statistics (mean, median, minimum, maximum, standard deviation) to compare the number of indicators reported at the three spatial scales, the proportion of indicators that were international, the proportion of indicators used that were recommended by the AHTEG, the number of times each AHTEG generic and specific indicator was used, and the number of indicators that addressed each Strategic Goal. Because most indicator count and proportion variables, even with standard transformations, did not fulfil the distribution and variance assumptions of parametric statistics (Shapiro–Wilk and Levene’s tests), we used non-parametric statistics for our analysis. Specifically, we used the Mann–Whitney U Test to compare the number of international and international indicators reported across the countries. We used the Kruskal–Wallis Rank Sum Test and post-hoc Dunn’s Tests to compare differences in the number of indicators that addressed each Strategic Goal and the use of the AHTEG-recommended indicators. Finally, we used Spearman’s Rank Correlation Coefficients to investigate the relationship between Gross National Income per Capita (World Bank 2018) and biodiversity (measured in two ways: the number of terrestrial ecoregions, calculated by overlaying a global ecoregion map (Olson et al. Reference Olson, Dinerstein, Wikramanayake, Burgess, Powell and Underwood2001) on country boundaries, and the number of bird species (BirdLife International 2019), a metric that is both available for all countries and correlated with other measures of biodiversity) and indicator use by each country.
Results
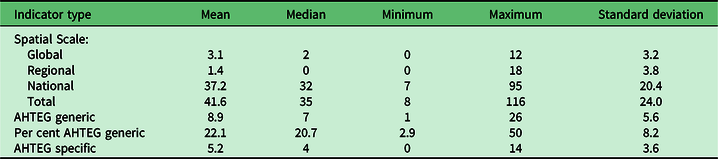
Although the average number of indicators presented in National Reports was high, the range varied widely among countries (Table 1; see Table S1 for a list of indicators used in each report). Most indicators reported in the 40 sampled 5th National Reports were national indicators (87%), with far fewer global and regional indicators (Table 1). National indicators were used 11 times more frequently than global ones (Table 1). Six countries did not report any global indicators (Figure S1). Reports included significantly more national than international (global and regional combined) indicators (U = 26.5, p < 0.001).
Numbers of indicators included in the 40 sampled 5th National Reports submitted in 2015 to the Secretariat of the Convention on Biological Diversity (CBD), including the number derived at different scales and that were recommended by the CBD’s Ad-Hoc Technical Expert Group (AHTEG) on Indicators

On average, just 22% (8.9 of 41.6) of the indicators included in the reports corresponded with generic indicators recommended by AHTEG and just 11% (5.2 of 41.6) corresponded with specific AHTEG-recommended indicators (Table 1). Again, there was wide variation in the adoption of AHTEG-recommended indicators among the reports sampled (Table 1). The reports included 6- to 8-fold more AHTEG-recommended indicators that addressed Strategic Goals B and C than addressed Goals A, D or E (Figs S2, S3). Similarly, the number of reports that used at least one AHTEG-recommended indicator that addressed Goals B and C was 3- to 4-times greater than for Goals A, D or E (Fig. S4).
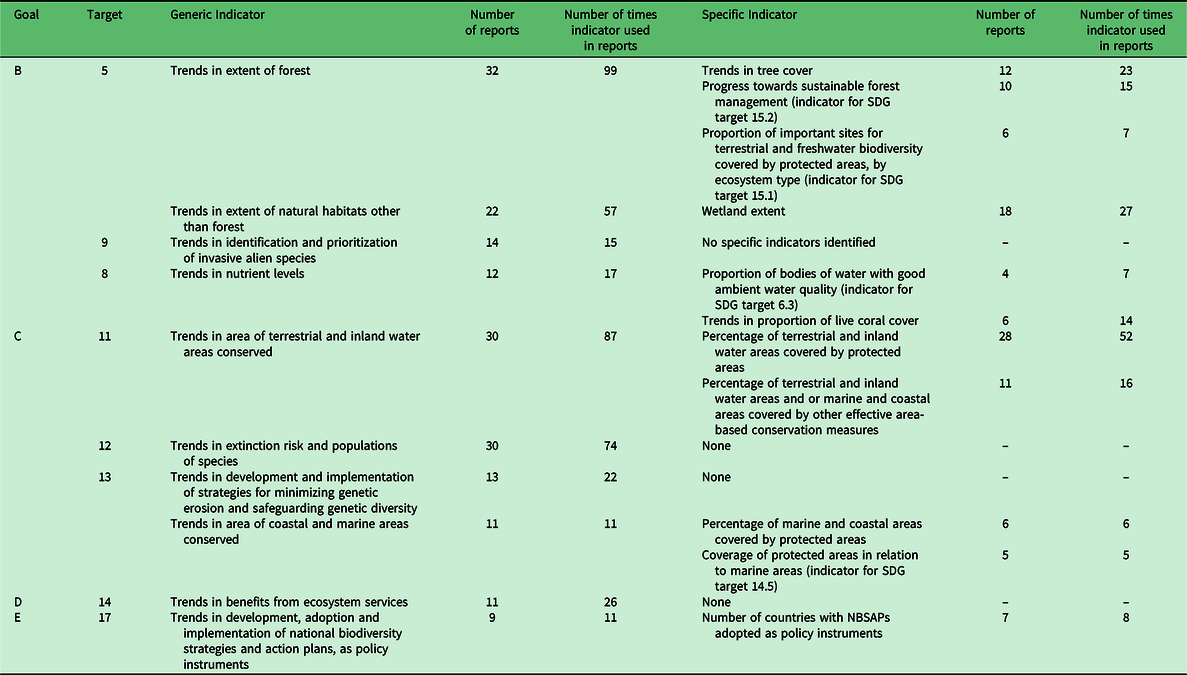
Across all reports reviewed, 22% (17 of 78) generic and 69% (101 of 147) specific indicators did not appear in any report. Eight of the 10 most commonly used generic and specific indicators corresponded to Aichi Targets in Strategic Goals B and C (Table 2). By far the most frequently reported AHTEG indicators relate to trends in forest and protected area extent and species’ extinction risk (Table 2).
The 10 most commonly used AHTEG generic and corresponding specific indicators in the 40 sampled 5th National Reports to the CBD. See Supplemental Materials for a complete list of generic and specific indicators used. Strategic Goals: B, reduce direct pressures; C, improve biodiversity status; D, enhance benefits to all; and E, enhance implementation. Goal A (address the underlying drivers of biodiversity loss) indicators were rarely used and are not listed here

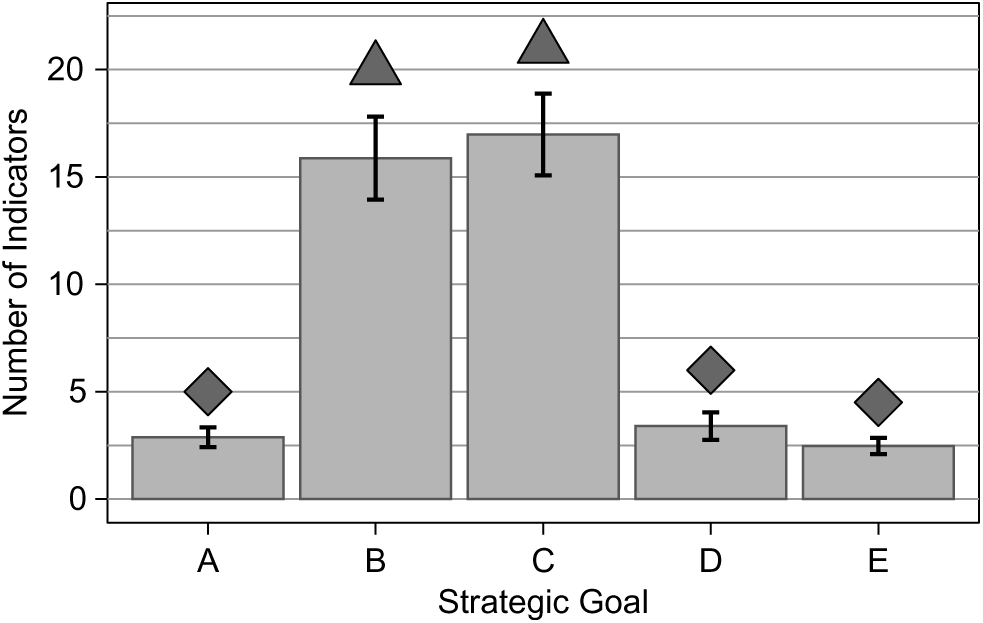
The indicators used in the 5th National Reports addressed targets in Strategic Goals B and C 5–7 times more frequently than Goals A, D and E (Fig. 1; Kruskal–Wallis Rank Sum, chi-squared = 110.52, df = 4, p < 0.0001; Dunn’s Tests, p < 0.0001 for differing means). All countries reported indicators for Goal B and C targets, but 9 countries (23%) did not report any indicators for Goal A targets, 11 countries (28%) did not report indicators for the Goal D targets, and 8 countries (20%) did not report any indicator for Goal E targets.
The number of indicators tagged to the Strategic Goals from a sample of 40 countries’ 5th National Reports to the Convention on Biological Diversity. Shown are averages and standard errors; goals marked with the same symbol do not differ in the numbers of indicators addressing them. See Table 1 for description of Goals.

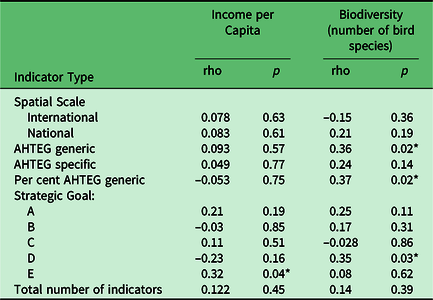
We found that the Gross National Income per Capita was significantly correlated with only one measure of the number of indicators used in the reports, the number of Goal E indicators reported (Table 3). The number of ecoregions and the number of bird species were highly correlated (rho = 0.80, p < 0.0001) and therefore we present detailed results only for the number of bird species (Table 3). The number of bird species was correlated with the number of Goal D indicators, the number of generic AHTEG indicators, and the percentage of indicators that corresponded to generic AHTEG indicators (Table 3).
Spearman rank correlations between gross national income per capita and biodiversity (measured as the number of bird species) and numbers of indicators included in 40 5th National Reports to the CBD. See Table 1 for description of goals. Asterisks highlight correlations significant at the p < 0.05 level

Discussion
Our survey of 40 randomly selected national reports to the CBD revealed clear patterns in indicator use by Parties to the Convention. Understanding the context for these patterns can provide insight into how targets and indicators can be more effectively developed and deployed in the post-2020 Framework to better measure and guide countries’ contributions to conserving biodiversity.
First, although authors reported metrics from numerous indicators, these indicators largely addressed only two of the five goals listed in the Strategy for Biodiversity 2011–2020: goals to reduce pressures (Goal B) and improve biodiversity status (Goal C), whereas few indicators reported on progress toward goals to reduce underlying drivers (Goal A), enhance benefits to all (Goal D) or enhance implementation (Goal E). This result is perhaps unsurprising considering that scientists have been reporting on the status of and pressures on biodiversity since at least the beginning of the 20th century. For example, the first national assessment of threatened species was published over a century ago (Hornaday Reference Hornaday1913), protected areas have been measured since the concept was conceived in the 19th century (Mackintosh Reference Mackintosh1985), and pressures on biodiversity such as pollution have been quantified since the 1960s (Carson Reference Carson1962). Concepts central to Goals A, D and E, such as mainstreaming biodiversity in society, spreading economic and other benefits of biodiversity across diverse groups, integrating indigenous knowledge and developing biodiversity policy instruments are much more recent and did not have indicators ready at the outset of the 2011–2020 period (Walpole et al. Reference Walpole, Almond, Besancon, Butchart, Campbell-Lendrum, Carr and Collen2009, Tittensor et al. Reference Tittensor, Walpole, Hill, Boyce, Britten, Burgess and Butchart2014). Indicators for several of the corresponding targets had not been developed at the time that the Aichi Targets were adopted in 2010, and indeed two of the targets, 15 (ecosystem resilience and contribution of biodiversity to carbon stocks) and 18 (integration of traditional knowledge and participation of indigenous and local communities), still had no associated indicators 4 years after formal adoption of the Aichi Targets (Tittensor et al. Reference Tittensor, Walpole, Hill, Boyce, Britten, Burgess and Butchart2014). Targets without indicators to track them have real consequences for implementation; the less measurable Aichi Targets have witnessed the least amount of progress (Green et al. Reference Green, Buchanan, Butchart, Chandler, Burgess, Hill and Gregory2019).
The indicators that appeared in the 5th National Reports were predominately of national origin, with limited use of global datasets. Governments are known for their reluctance to rely on indicators developed by research labs in other countries, with methods and re-measurement intervals out of their control or unclear to them, preferring instead measures contributed by their own scientists and institutes (Chenery et al. Reference Chenery, Ivory and Despot-Belmonte2015, Han et al. Reference Han, Josse, Young, Smyth, Hamilton and Bowles-Newark2017). National indicators are valuable because they are more likely to influence national policy. However, methods used are rarely standardized such that every country might use different ways of measuring, for example, forest cover change (Pereira et al. Reference Pereira, Ferrier, Walters, Geller, Jongman, Scholes and Bruford2013, Han et al. Reference Han, Josse, Young, Smyth, Hamilton and Bowles-Newark2017, Navarro et al. Reference Navarro, Fernández, Guerra, Guralnick, Kissling, Londoño and Muller-Karger2017). This lack of standardization limits the global conservation community’s capacity to aggregate and calculate collective action, thereby limiting the ability to track progress for targets at regional and global scales.
Despite an expressed desire by countries for consistency in reporting, the National Reports include few of the suggested general and specific indicators identified by the AHTEG (CBD 2015). Most indicators on the AHTEG list appeared in few of the reports surveyed or none at all. Without quantifying the use of these indicators in the 4th National Reports by the countries in our sample (i.e., before the AHTEG was formed), we cannot be certain that the AHTEG recommendations did not positively influence use of the generic and specific indicators. Nevertheless, this influence was limited at best, judging by the restricted uptake of these indicators in the 5th National Reports. It is possible that the AHTEG report on recommended indicators was released too late in the 5th national reporting cycle to have a major influence on report authors. The CBD released the AHTEG report in September 2014, only a few months before national reports were submitted in early 2015. Regardless, the end result has been that the goal of bringing about greater consistency in reporting remains largely unfulfilled. Countries report on a large variety of indicators on numerous aspects of biodiversity without any rigorous means of comparing progress across borders or ability to judge which policies and practices are most successful at conserving biodiversity. While not a stated goal of NBSAPs, comparing progress and success of interventions would improve capacity for coordinated and effective response to global biodiversity challenges.
An unanticipated result from our assessment was that national income group was not related to most of the measures of indicator use that we quantified. This result strengthens the assertion that progress toward some goals (e.g. B and C) is easier to measure than others. Regardless of income level and presumably resources available to national offices responsible for writing reports, it was hard to find indicators for Goal A and D targets. This finding also suggests that failure to utilize global or the AHTEG-recommended indicators more fully was unlikely the result of economic reasons. Perhaps instead, it was due to a disconnect between the technical community responsible for producing global indicators and the government policy offices that set targets and write the national reports. Indeed, only approximately 15 of the 196 parties to the CBD participated in the AHTEG (CBD 2015).
Interestingly, biodiversity, measured as bird species richness, was correlated with some measures of indicator use in the 5th National Reports. The pattern of these correlations was consistent with the assertion that megadiverse countries are more attuned to biodiversity and active in the CBD process. Greater use of Goal D indicators (enhance benefits to all) suggests that megadiverse countries are more conscious of sharing the benefits of biodiversity with their citizenry. Mexico, for example, has undertaken a concerted effort to document the value of its biodiversity to its people through the Natural Capital of Mexico project (Sarukhán et al. Reference Sarukhán, Urquiza-Haas, Koleff, Carabias, Dirzo, Ezcurra and Cerdeira-Estrada2015). The increased use of indicators recommended by AHTEG by megadiverse countries could be a result of these countries being more engaged with the CBD and its Strategy for Biodiversity 2011–2020. Indeed, the CBD even has a working group of Like-Minded Megadiverse Countries to provide input on decisions from the perspective of governments responsible for high levels of biodiversity.
The patterns of indicator use in the 5th National Reports described here suggest approaches that the Open-Ended Working Group, the body tasked with coordinating negotiations on the Post-2020 Framework, could take to avoid some of the shortcomings of the 2011–2020 Plan. With current interest in setting voluntary national contributions under the Post-2020 Global Biodiversity Framework akin to the Nationally Determined Contributions to the Paris Climate Agreement (Admiraal et al. Reference Admiraal, Den Elzen, Forsell, Turkovska, Roelfsema and Van Soest2015, Dinerstein et al. Reference Dinerstein, Vynne, Sala, Joshi, Fernando, Lovejoy and Mayorga2019), negotiators must acknowledge that consistent measurements are needed to monitor progress and calculate total contributions towards the targets, in order to ensure credibility of the process. Countries need to agree to a minimum, core set of consistent, measurable indicators for monitoring progress (Mace et al. Reference Mace, Barrett, Burgess, Cornell, Freeman, Grooten and Purvis2018). Targets must be scalable across countries with vastly varying biodiversity resources and pressures. Targets and the indicators used to monitor progress should be co-developed to ensure measurability, fit for purpose, and early deployment (Walpole et al. Reference Walpole, Almond, Besancon, Butchart, Campbell-Lendrum, Carr and Collen2009). Such an approach will both improve transparency and engender credibility in the process. As our results demonstrate, allowing countries to decide which indicators to report has led to inconsistency and uncertainty about whether targets are being reached. Similarly, targets developed without corresponding, suitable indicators tend to see little advancement (Green et al. Reference Green, Buchanan, Butchart, Chandler, Burgess, Hill and Gregory2019).
Identifying a core set of indicators for measuring targets will unquestionably be a challenging process. One example that can inform a structure for effective negotiations is the Intergovernmental Science-Policy Platform on Biodiversity and Ecosystem Services (IPBES). IPBES, which has released several successful and widely cited assessments (Archer et al. Reference Archer, Dziba, Mulongoy, Maoela and Walters2018, Fischer et al. Reference Fischer, Rounsevell, Torre-Marin Rando, Mader, Church, Elbakidze and Elias2018, Karki et al. Reference Karki, Senaratna, Okayasu, Suzuki, Acosta, Alhafedh and Anticamara2018, Rice et al. Reference Rice, Seixas, Zaccagnini, Bedoya-Gaitán, Valderrama, Anderson and Arroyo2018, Díaz et al. Reference Díaz, Settele, Brondízio, Ngo, Guèze, Agard and Arneth2019), has given national governments a strong say in the assessment themes, selection of chapter authors, and priorities. A similar, integrated process, in which both governments and technical experts are heavily involved from the onset, may be most likely to achieve consensus around core biodiversity targets and their respective indicators. Under this scenario, government representatives would provide input on which proposed targets and indicators would likely be supported once draft agreements are considered for adoption. Technical experts would provide suggestions on possible indicators that could be used to measure the targets and weigh in on the extent to which proposed indicators adhere to the SMART criteria: specific, measurable, ambitious, realistic and time-bound (CBD 2018e). In turn, policymakers could consider this technical information when formulating targets. Such an approach avoids the problem of setting targets without the involvement of the global indicator community (as arguably happened when establishing the Aichi Targets; Tittensor et al. Reference Tittensor, Walpole, Hill, Boyce, Britten, Burgess and Butchart2014) or without broad input from national governments.
Promisingly, this proposed approach to establishing the Post-2020 Framework is consistent with several decisions agreed upon by national delegates at the 14th CBD Conference of the Parties (COP14) in November 2018. Parties encouraged the development of data sets that can be disaggregated at different geographic scales and to share this information effectively (CBD 2018a). They called for guidance on data sources to support analyses of progress used in national reports (CBD 2018b) and urged coordination with IPBES to serve the assessment needs for the Post-2020 Framework as well as the biodiversity and ecosystem services components of the 2030 Agenda for Sustainable Development (CBD 2018d). Finally, the Parties urged diverse and inclusive participation and engagement by stakeholders in developing a post-2020 global biodiversity framework (CBD 2018c). Broad agreement with decisions already made enhances the political viability of the approach.
The frightening acceleration of biodiversity loss being witnessed today (Grooten & Almond Reference Grooten and Almond2018, Díaz et al. Reference Díaz, Settele, Brondízio, Ngo, Guèze, Agard and Arneth2019) calls for bold action to avert ecosystem collapse and the loss of natural support systems for human societies (Steffen et al. Reference Steffen, Rockström, Richardson, Lenton, Folke, Liverman and Summerhayes2018). The 2011–2020 Plan was the second time that the world’s governments agreed to a unified set of targets aimed at reversing biodiversity loss (a precursor framework was adopted in 2006 with a 2010 deadline; Walpole et al. Reference Walpole, Almond, Besancon, Butchart, Campbell-Lendrum, Carr and Collen2009). Experiences during this period and documented in this and other studies have provided valuable lessons for how best to identify and mobilize biodiversity targets and indicators for measuring them. Integrating government policymakers and indicator providers to develop a core set of measurable, scalable targets coupled with SMART indicators has the best chance at passing political hurdles while also setting the stage for transparent and defensible tracking of national contributions to positive biodiversity outcomes. Moving the world towards the 2050 Vision for Biodiversity of Living in Harmony with Nature will require targets that can be effectively and consistently tracked by indicators at all scales.
Supplementary material
To view supplementary material for this article, please visit https://doi.org/10.1017/S0376892919000365
Acknowledgements
The authors thank Miguel Fernandez and Emily Seddon for reviewing 5th National Reports in Spanish and French, respectively, and Anna Chenery and Kiernan Mooney for helpful suggestions of analyses and interpretations that improved previous drafts of the manuscript.
Financial support
This work was supported by the John D. and Catherine T. MacArthur Foundation, grants 15-109139-000-CSD and 17-1703-151770-CSD.
Conflict of interest
None.
Ethical standards
None.