1 Introduction
Fluid thread breakup is a widespread phenomenon in nature, industry, and daily life (Eggers et al. Reference Eggers, Fontelos, Leppinen and Snoeijer2007; Bhat et al. Reference Bhat, Appathurai, Harris, Pasquali, McKinley and Basaran2010; van Hoeve et al. Reference van Hoeve, Gekle, Snoeijer, Versluis, Brenner and Lohse2010; Tagawa et al. Reference Tagawa, Oudalov, Visser, Peters, van der Meer, Sun, Prosperetti and Lohse2012). As a common example, columnar water jets from a showerhead are unstable downstream of the nozzles and break into droplets in air. This breakup scenario is called Rayleigh–Plateau (R–P) instability (Plateau Reference Plateau1873; Rayleigh Reference Rayleigh1878), which is also called capillary instability at low flow rates where the driving force is interfacial tension (Eggers et al. Reference Eggers, Fontelos, Leppinen and Snoeijer2007; Eggers & Villermaux Reference Eggers and Villermaux2008). In contrast, a fluid thread covered by a thin film of another fluid within a tube can be stable (Duclaux, Clanet & Quere Reference Duclaux, Clanet and Quere2006). For instance, a long air bubble in an intravenous line maintains its shape while moving slowly with the liquid. This type of tightly confined fluid thread is often encountered in various processes, including pore-scale breakup in enhanced oil recovery (Olbricht Reference Olbricht1996) and droplet or bubble generation in microfluidic devices (Squires & Quake Reference Squires and Quake2005; Anna Reference Anna2016), where confined fluid threads are squeezed into fluid necks at channel junctions and eventually break into microdroplets. The interface is quasi-stable in the earlier necking stage and becomes unstable in the later collapse stage (Garstecki, Stone & Whitesides Reference Garstecki, Stone and Whitesides2005). The stage transition is thought to be an R–P instability (Link et al. Reference Link, Anna, Weitz and Stone2004; Garstecki et al. Reference Garstecki, Stone and Whitesides2005; De Menech et al. Reference De Menech, Garstecki, Jousse and Stone2008) or initiated not by an R–P instability but rather by a reversed flow from the thread tip to the neck (van Steijn, Kleijn & Kreutzer Reference van Steijn, Kleijn and Kreutzer2009). The mechanisms of the onset of interfacial instabilities are still puzzling.
Here, through newly designed numerical simulations and experiments at extremely low capillary numbers, we identify the transitions between the quasi-stable and unstable stages for confined fluid threads. Two breakup mechanisms are uncovered for different confinement situations in surprisingly simple terms.
2 Numerical and experimental methods
Numerical simulations are conducted using the Gerris flow solver (http://gfs.sf.net). Combining an adaptive quad/octree spatial discretization, geometrical volume-of-fluid interface representation, balanced-force continuum-surface-force surface tension formulation, and height-function curvature estimation, the method is shown to recover exact equilibrium (to machine accuracy) between surface tension and pressure gradient in the case of a stationary droplet, irrespective of viscosity and spatial resolution (Popinet Reference Popinet2009). The accuracy of the code has been validated in our previous studies for various interfacial flow problems (Chen et al.
Reference Chen, Ma, Yang and Popinet2013, Reference Chen, Xue, Zhang, Hu, Jiang and Sun2014). The motion of the fluid thread inside the continuous phase forms a thin lubrication film between the fluid thread and the channel wall (Taylor Reference Taylor1961). The ratio of the film thickness to the channel diameter was found to scale with
 $Ca^{2/3}$
(Bretherton Reference Bretherton1961), where
 $Ca$
is the capillary number. A thickness-based refinement criterion developed in the previous work (Chen & Yang Reference Chen and Yang2014) is used to resolve the film by at least two meshes in thickness direction. However, when
 $Ca\sim 10^{-6}$
, the ratio of the film thickness to the channel diameter is in the order of
 $10^{-4}$
. It is too costly to resolve such a film that plays only a minor role in determining the shape of the fluid thread. In practice, the film may vanish, and the interface may make contact with the wall under such a small
 $Ca$
. Therefore, the film is not resolved for cases under
 $Ca\sim 10^{-6}$
, while a contact angle of
 $180^{\circ }$
is set on the wall to make it fully hydrophobic. A curvature-based refinement criterion (Popinet Reference Popinet2009) is also applied to increase the grid resolution according to the thinning of the neck region during breakup. The breakup dynamics of confined fluid threads in various microfluidic configurations are considered in this paper. The geometry and boundary conditions will be described when mentioned. Grid independence studies are carried out for each configuration to obtain the proper interfacial mesh size to capture the breakup dynamics.
Experiments are performed in circular microchannels that are fabricated by a rapid prototyping method (Ghorbanian, Qasaimeh & Juncker Reference Ghorbanian, Qasaimeh and Juncker2010). Iron wires are cut and arranged on a cured polydimethylsiloxane (PDMS) flat piece. Wires are connected by dropping a small amount of melted paraffin into the gaps between the wires. The connected wires are then covered with the uncured PDMS. After the PDMS is cured, the wires are pulled out to form the desired configurations. To obtain a hydrophobic surface, the microchannels are filled with Rain-X
 $^{\unicode[STIX]{x00AE} }$
rain repellent and then washed with deionized water. The hydrophobic treatment also improves the sharpness of the interface during high-speed imaging. The openings of the microchannels are connected with plastic tubes to form microfluidic devices. The microfluidic device is mounted on the stage of an inverted microscope (Nikon Eclipse Ti, Japan). Fluids are introduced into the channel using syringe pumps (Pump 11 Elite, Harvard Apparatus Inc., USA). Breakup dynamics in the microchannel is recorded using a Phantom v7.3 high-speed camera (Vision Research Inc., USA) and Phantom Camera Control software. Photographs of the microfluidic devices can be found in the supplementary material available at https://doi.org/10.1017/jfm.2019.426.
3 Results and discussion
3.1 Critical mean neck radius for the axisymmetric breakup
Inspired by the axisymmetric configurations used in studying the breakup mechanism of unbounded fluid threads (Gordillo et al.
Reference Gordillo, Sevilla, Rodriguez-Rodriguez and Martinez-Bazan2005; Eggers et al.
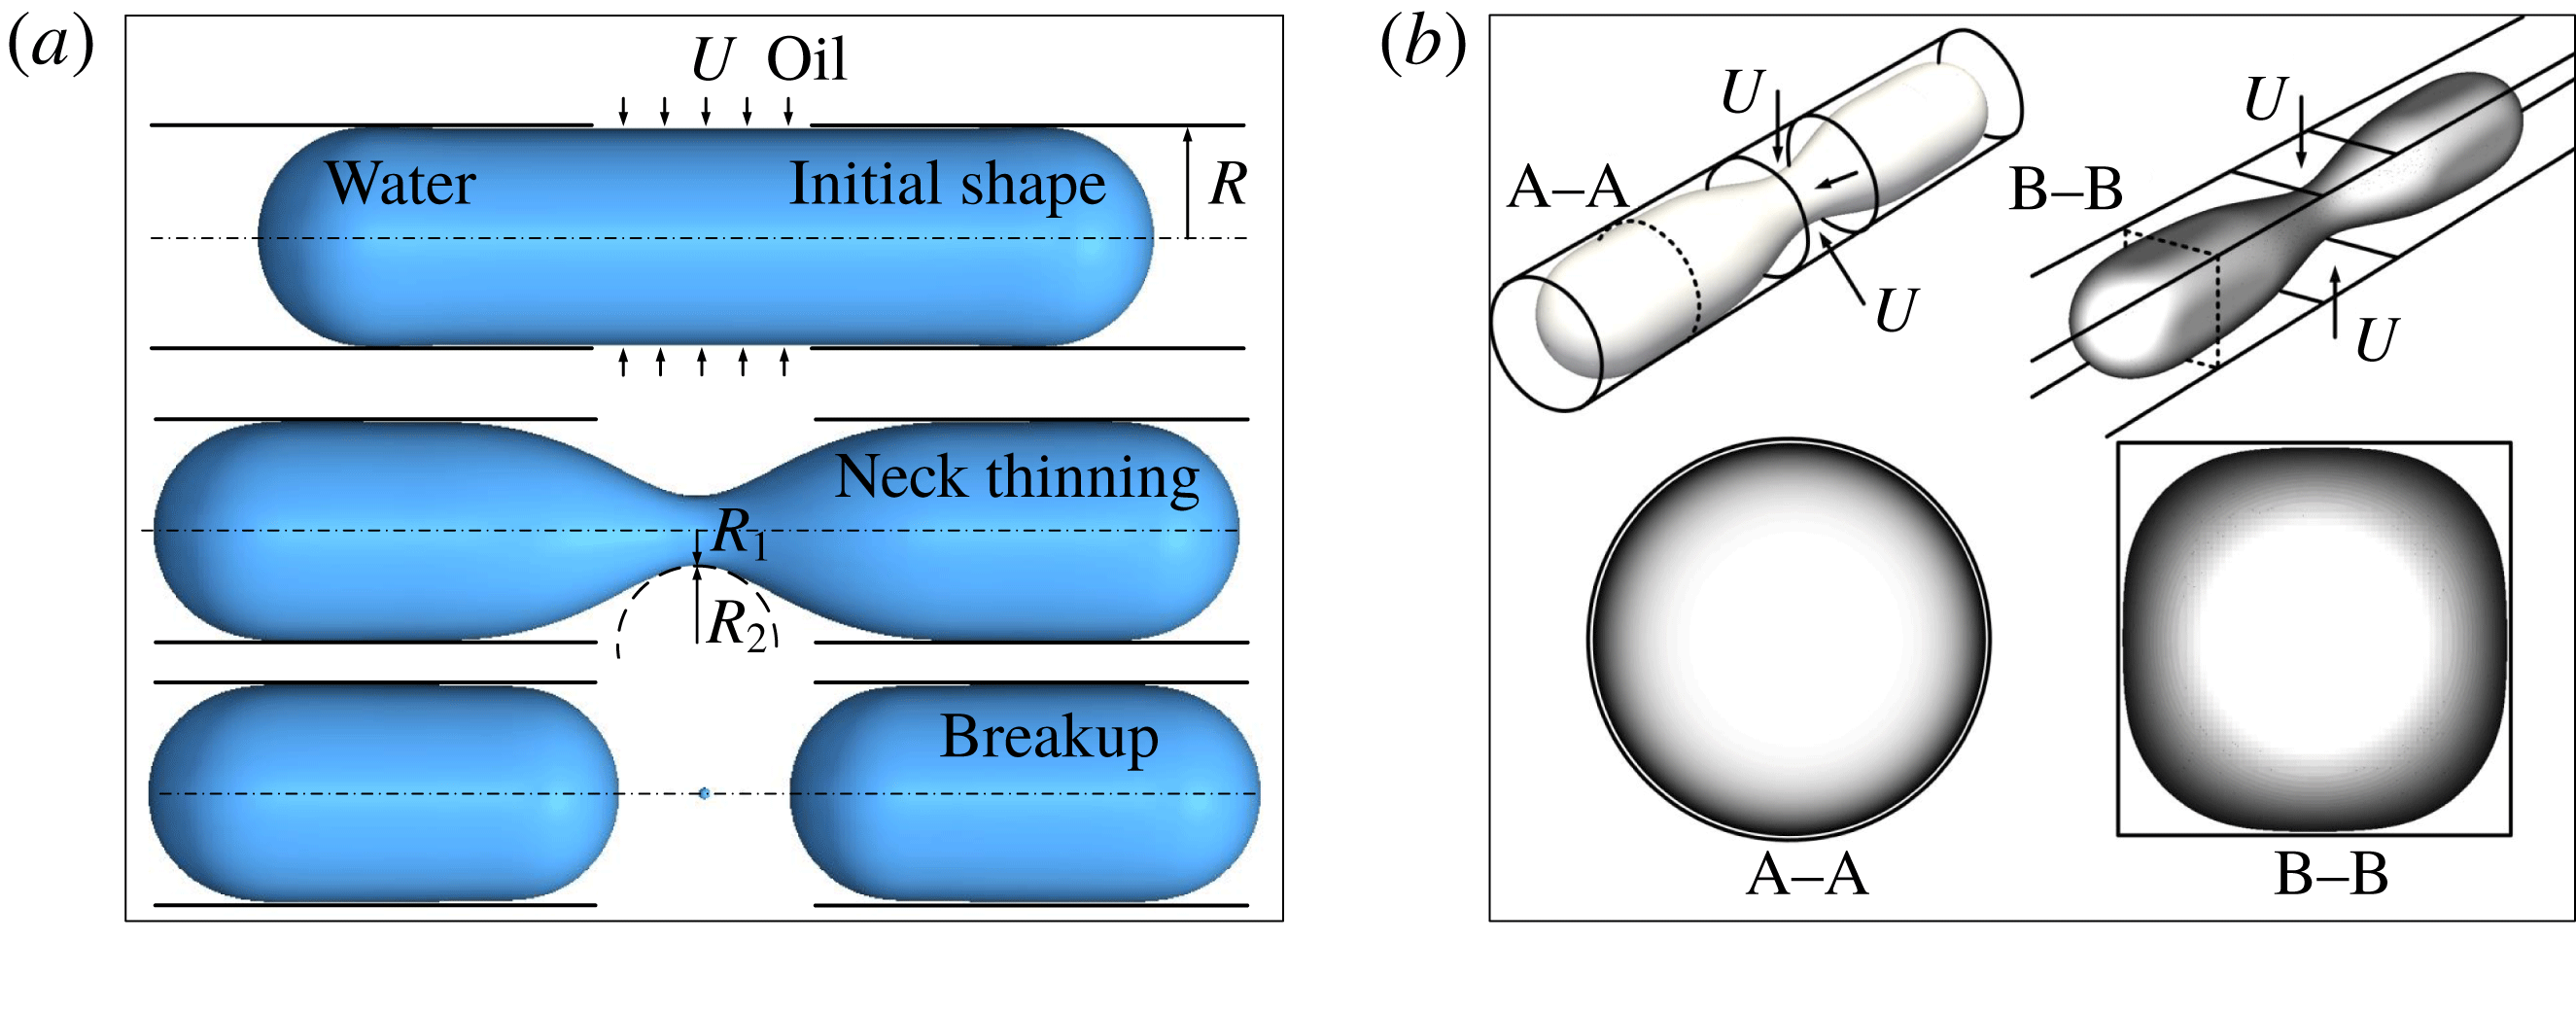
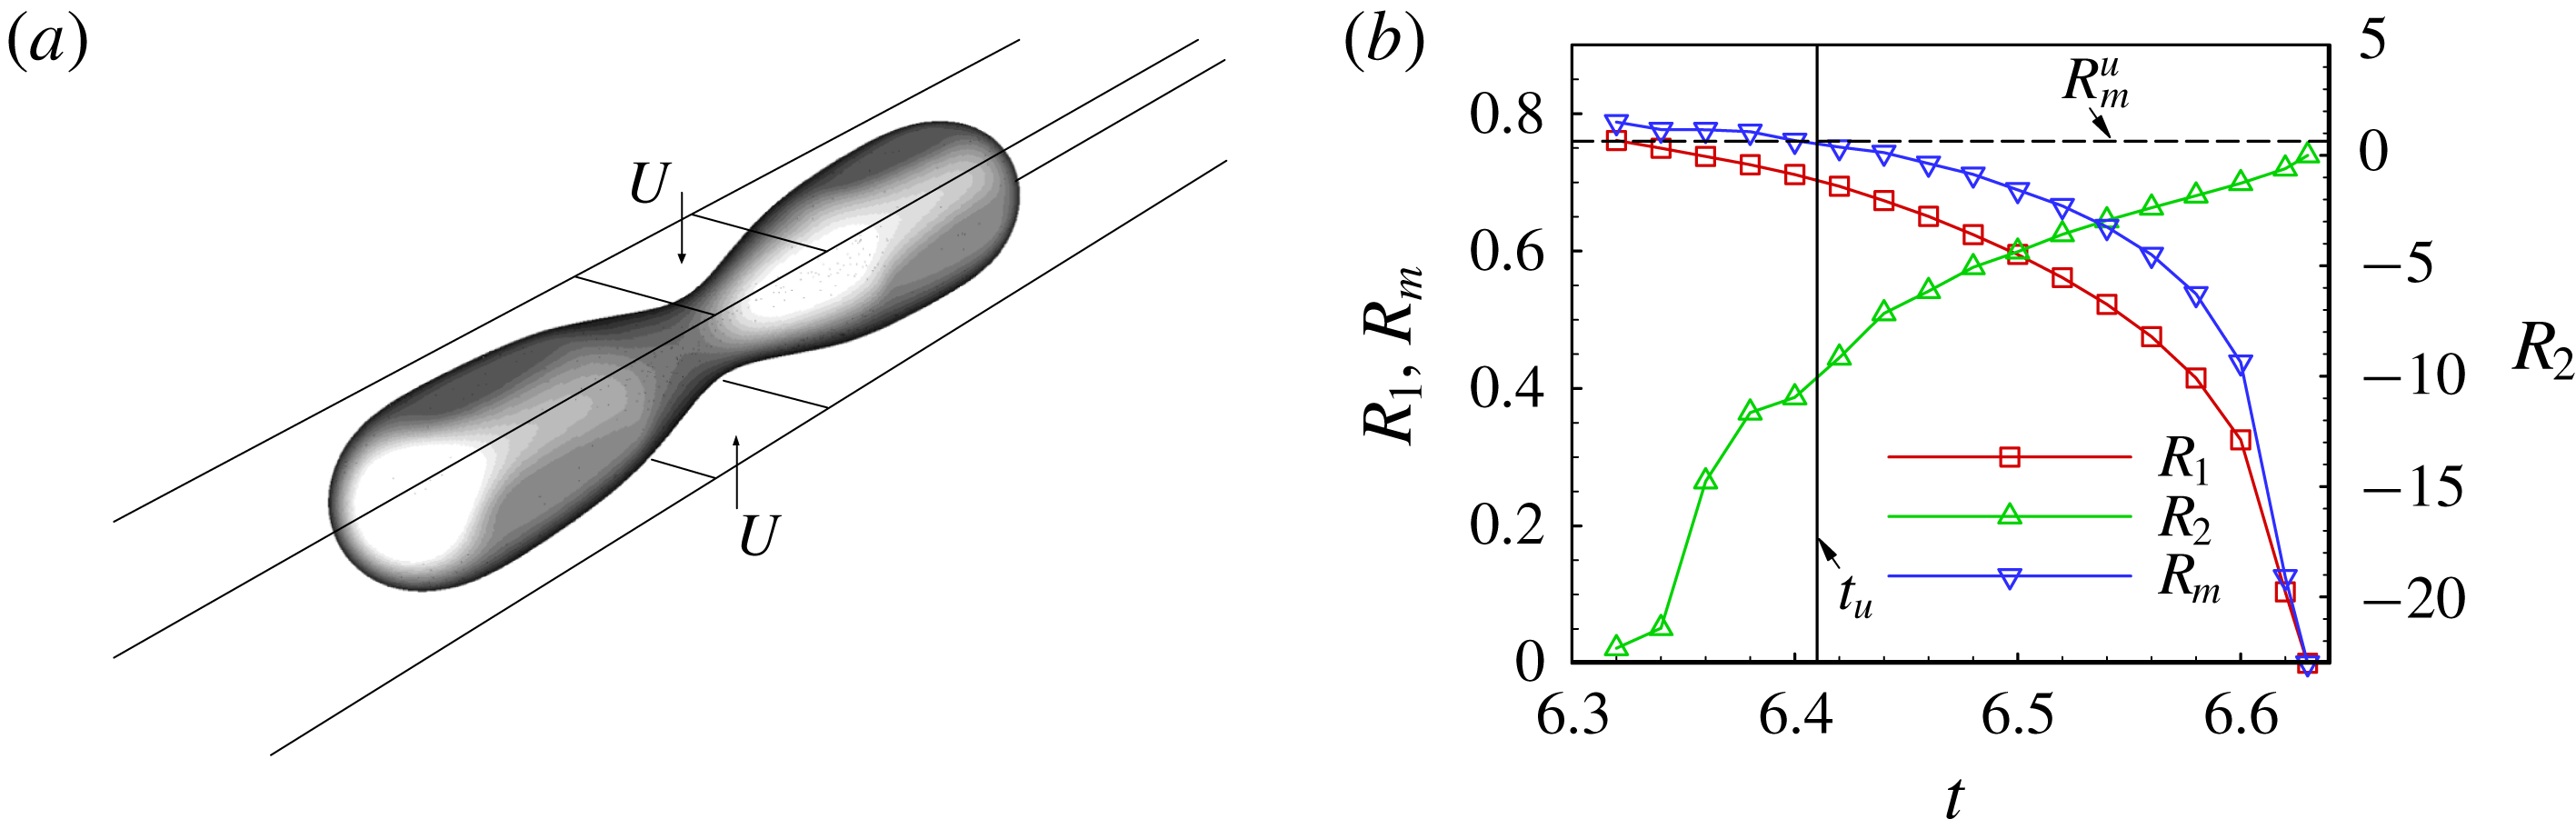
Reference Eggers, Fontelos, Leppinen and Snoeijer2007), we first investigate the breakup of an axisymmetric water thread that is tightly confined inside a circular microchannel, as shown in figure 1(a). A fluid neck forms under the squeezing of the oil side flow and then collapses. As illustrated in figure 1(b), a circular channel avoids the empty corners found in a rectangular channel through which oil inevitably flows causing leakage and making it difficult to deform the interface under low flow rates (Dollet et al.
Reference Dollet, van Hoeve, Raven, Marmottant and Versluis2008; Shui et al.
Reference Shui, Mugele, van den Berg and Eijkel2008). Using circular channels, we can overcome the leakage problem and study the breakup at extremely low flow rates. A water droplet (viscosity
 $\unicode[STIX]{x1D707}_{w}=1~\text{mPa}~\text{s}$
, density
 $\unicode[STIX]{x1D70C}_{w}=998~\text{kg}~\text{m}^{-3}$
) is initially tightly confined in a circular microchannel with radius
 $R=25~\unicode[STIX]{x03BC}\text{m}$
. The initial shape of the droplet is a cylinder with two hemispherical tips. The incoming oil (viscosity
 $\unicode[STIX]{x1D707}_{o}=8~\text{mPa}~\text{s}$
, density
 $\unicode[STIX]{x1D70C}_{o}=770~\text{kg}~\text{m}^{-3}$
) from the lateral opening (width of 50
 $\unicode[STIX]{x03BC}$
m) with a velocity of
 $U$
deforms the interface (interfacial tension
 $\unicode[STIX]{x1D70E}=5~\text{mN}~\text{m}^{-1}$
). A two-dimensional axisymmetric model is established to consider only a quarter of the cross-section of the configuration due to the axial and bilateral symmetries (figure S2(a) in the supplementary material). This simplification allows us to simulate the axisymmetric breakup efficiently and accurately for a wide range of small capillary numbers,
 $Ca=\unicode[STIX]{x1D707}_{w}U/\unicode[STIX]{x1D70E}$
.
Axisymmetric breakup of a confined fluid thread. (a) Sketch of the breakup process. (b) Comparison of droplet shapes in channels with circular and rectangular cross-sections during breakup.

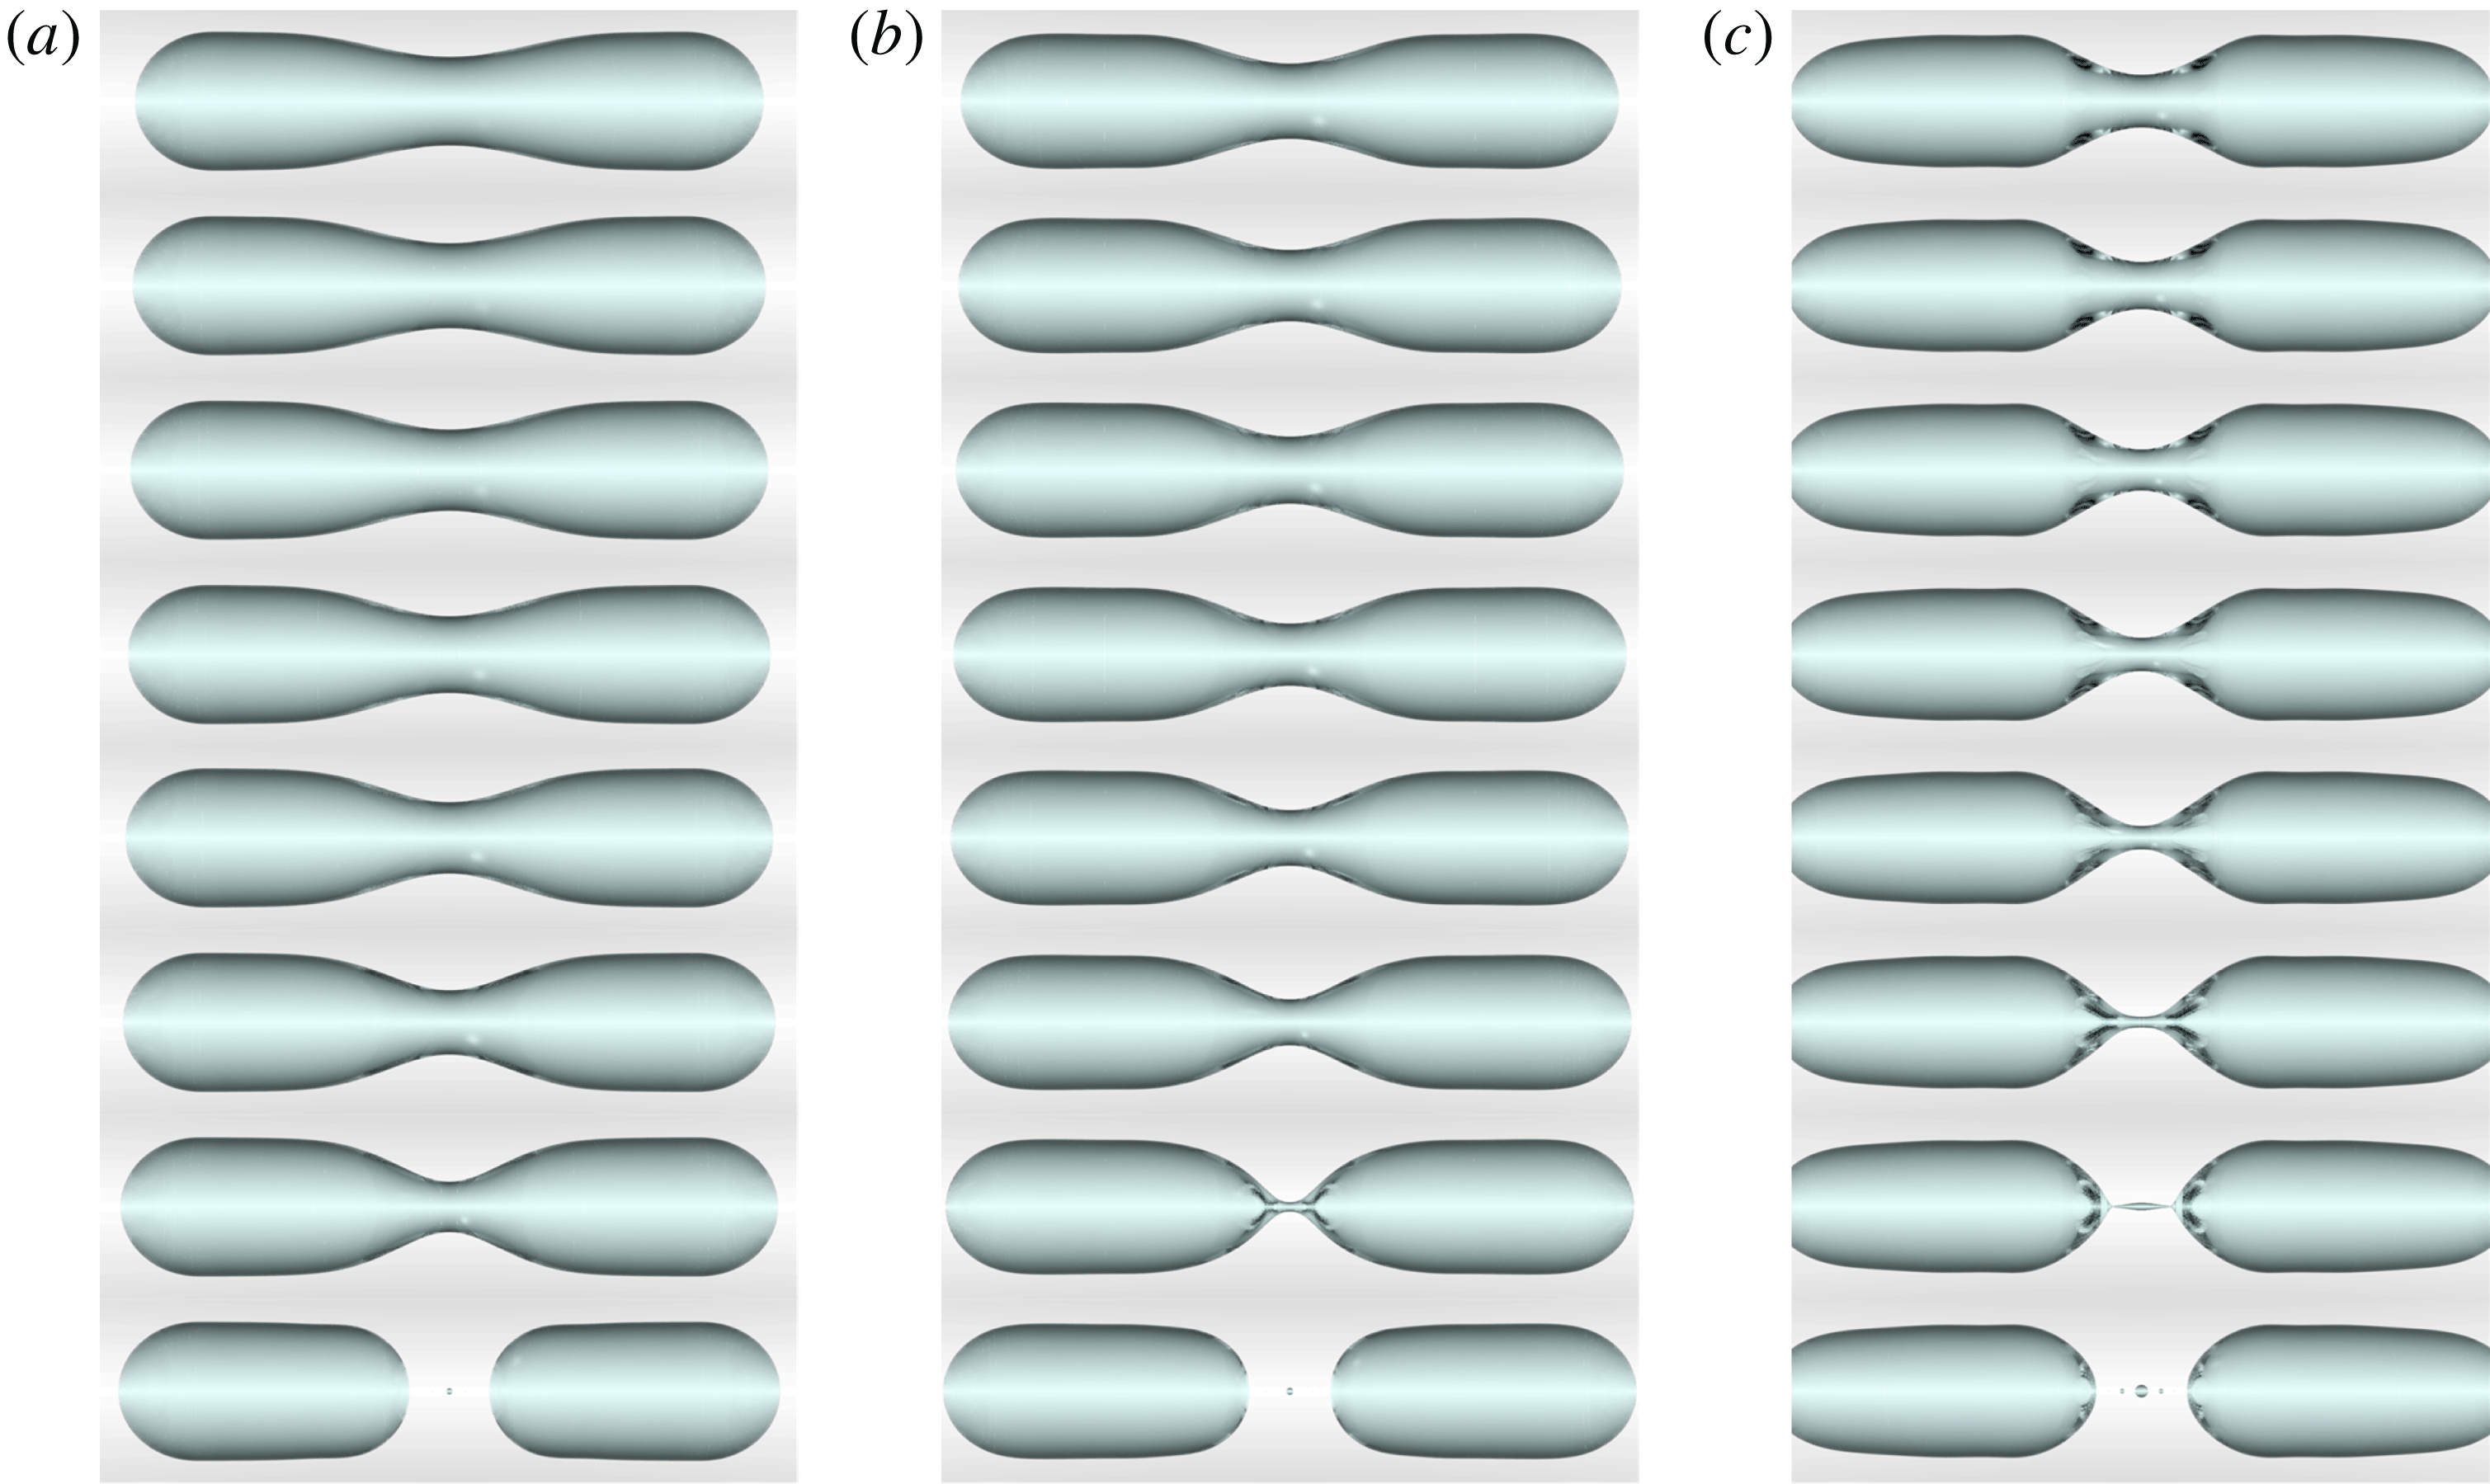
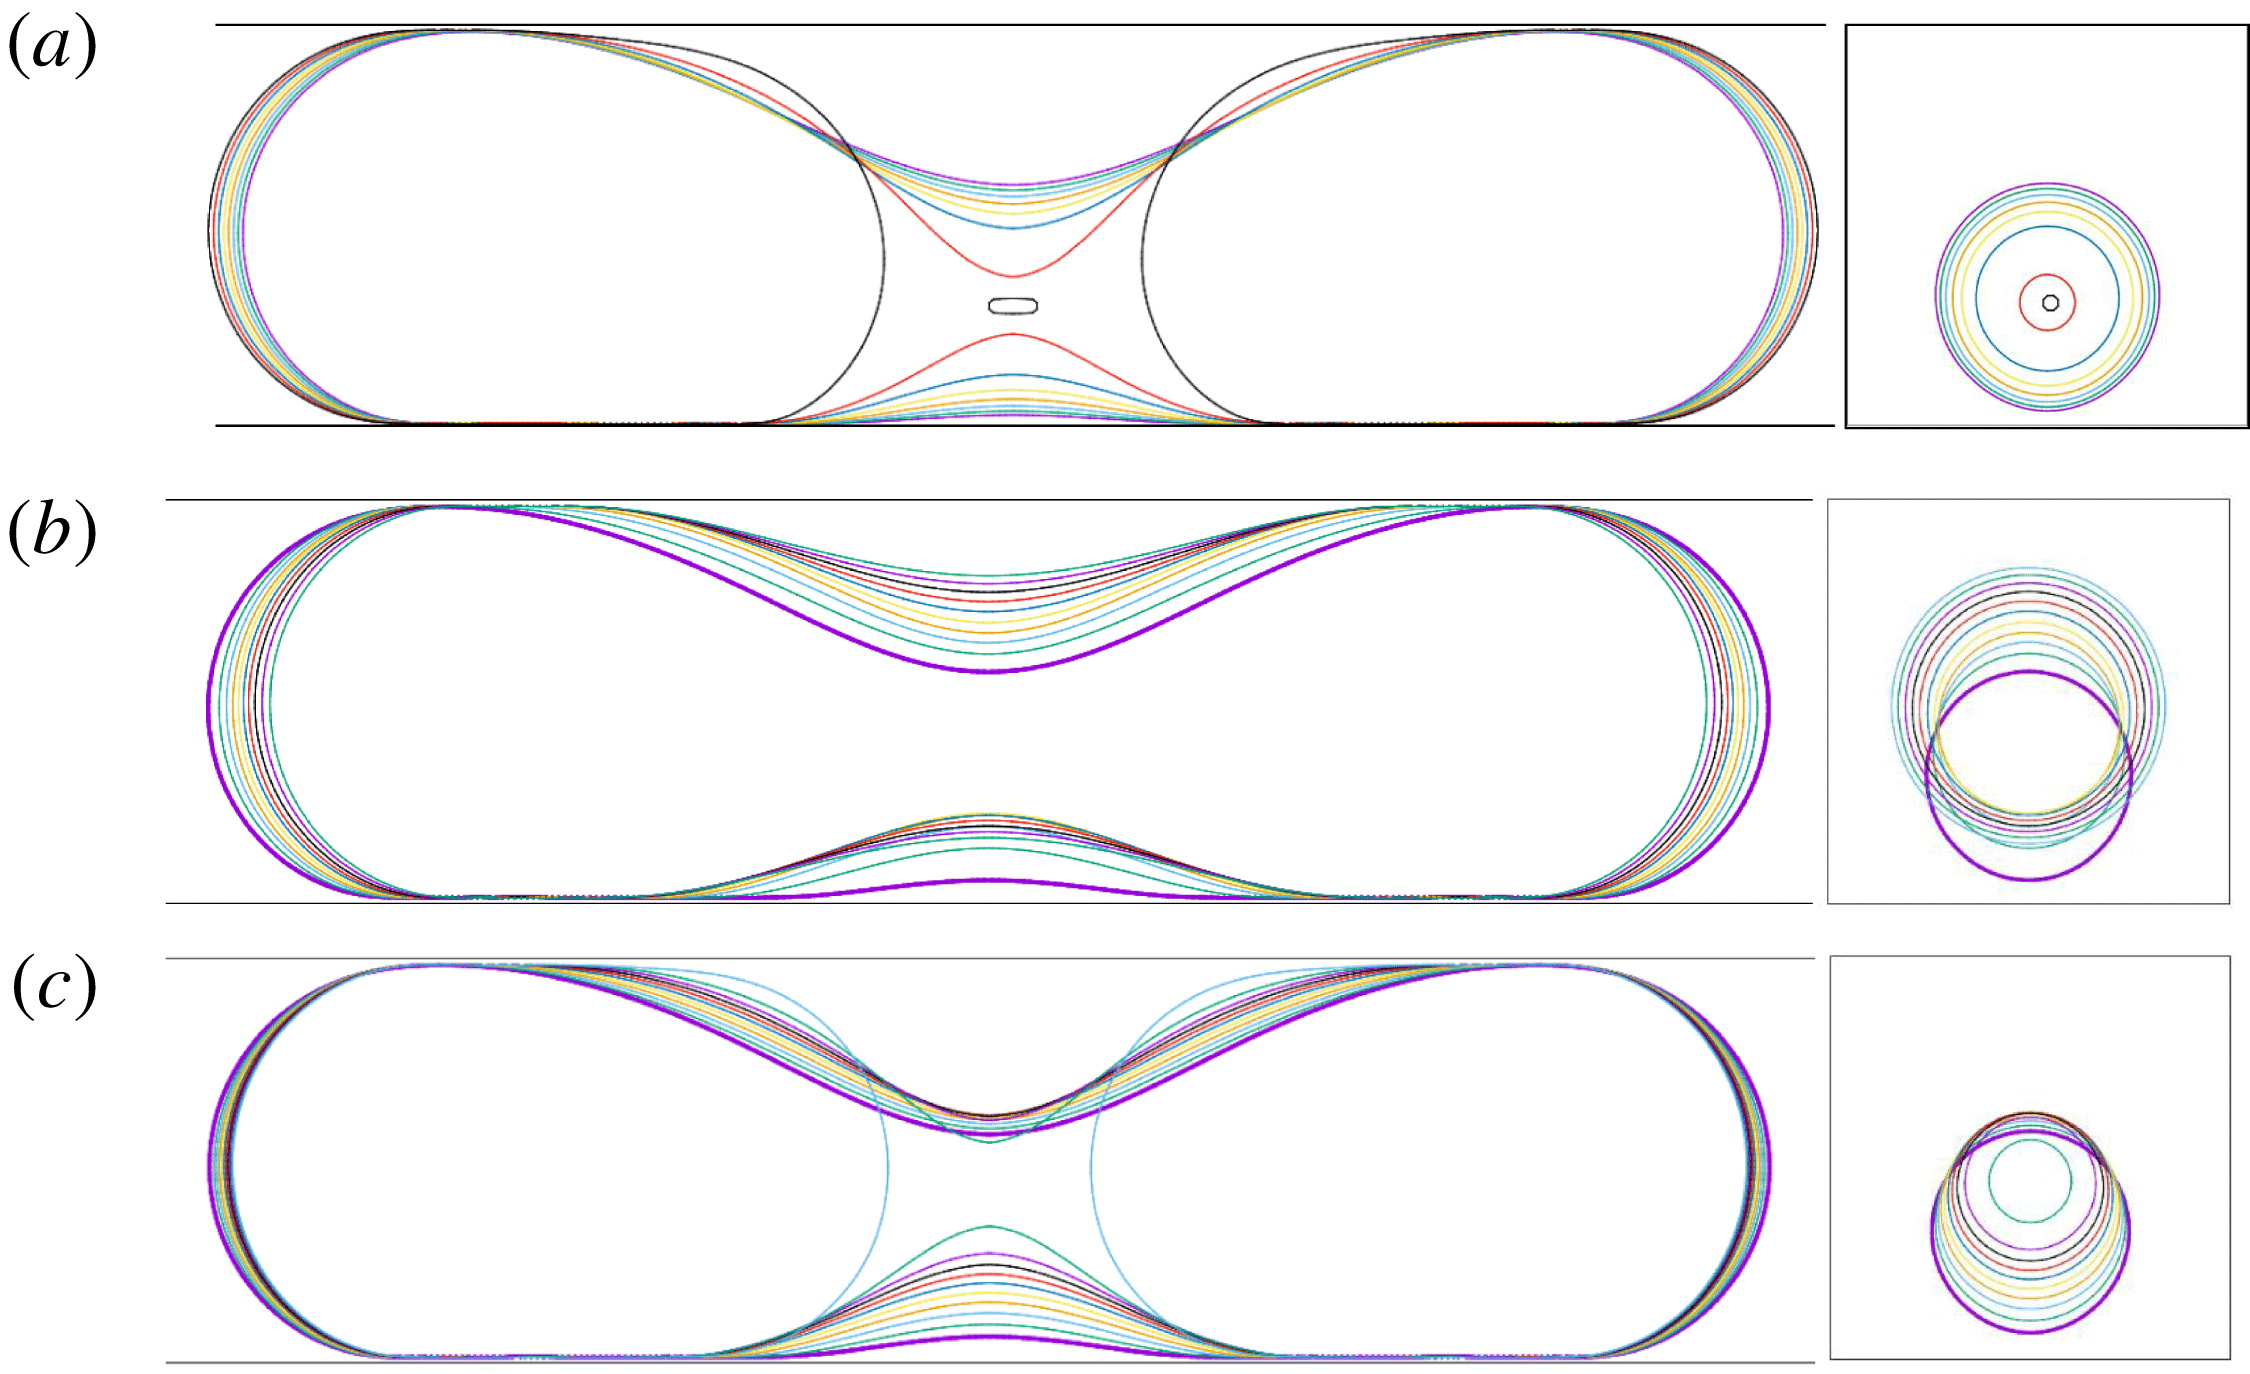
To provide intuitive insights into the breakup dynamics, photorealistic ray-tracing rendering is performed to show the breakup dynamics using the POV-Ray software (Persistence of Vision Pty. Ltd 2013). Figure 2 shows three series of images leading to the final collapse under three
 $Ca$
values varying from
 $2.0\times 10^{-5}$
to
 $2.0\times 10^{-3}$
. Thickness-based and curvature-based refinements allow us to obtain the detailed flow dynamics at the lubrication film near the channel wall, and the final collapse that leads to the generation of satellite droplets at the neck centre, respectively. The two ends of the fluid thread are hemispherical under
 $Ca=2.0\times 10^{-5}$
(figure 2
a) and
 $2.0\times 10^{-4}$
(figure 2
b), but have a bullet-like shape under
 $Ca=2.0\times 10^{-3}$
(figure 2
c). The breakup dynamics under
 $Ca=2.0\times 10^{-3}$
also shows obvious differences compared with those under the other two
 $Ca$
, i.e. the neck region is shorter and the final collapse generates a much larger satellite droplet at the neck centre. The effects of inertia are thus expected to play a major role in the breakup dynamics under
 $Ca=2.0\times 10^{-3}$
. Since we focus on the breakup dominated by capillary, conditions under
 $Ca$
on the order of
 $10^{-4}$
or smaller are considered to eliminate the effects of inertia.
Time evolutions of the axisymmetric breakup of a confined fluid thread with photorealistic ray-tracing rendering under different
 $Ca$
of
 $2.0\times 10^{-5}$
(a),
 $2.0\times 10^{-4}$
(b) and
 $2.0\times 10^{-3}$
(c). The time interval is constant for each series.

The neck evolutions during the axisymmetric breakup of the confined fluid thread are characterized by two principal radii at the neck centre,
 $R_{1}$
and
 $R_{2}$
, in the radial and axial directions (figure 1
a), respectively, and the mean radius
 $R_{m}$
is
 $R_{1}R_{2}/(R_{1}+R_{2})$
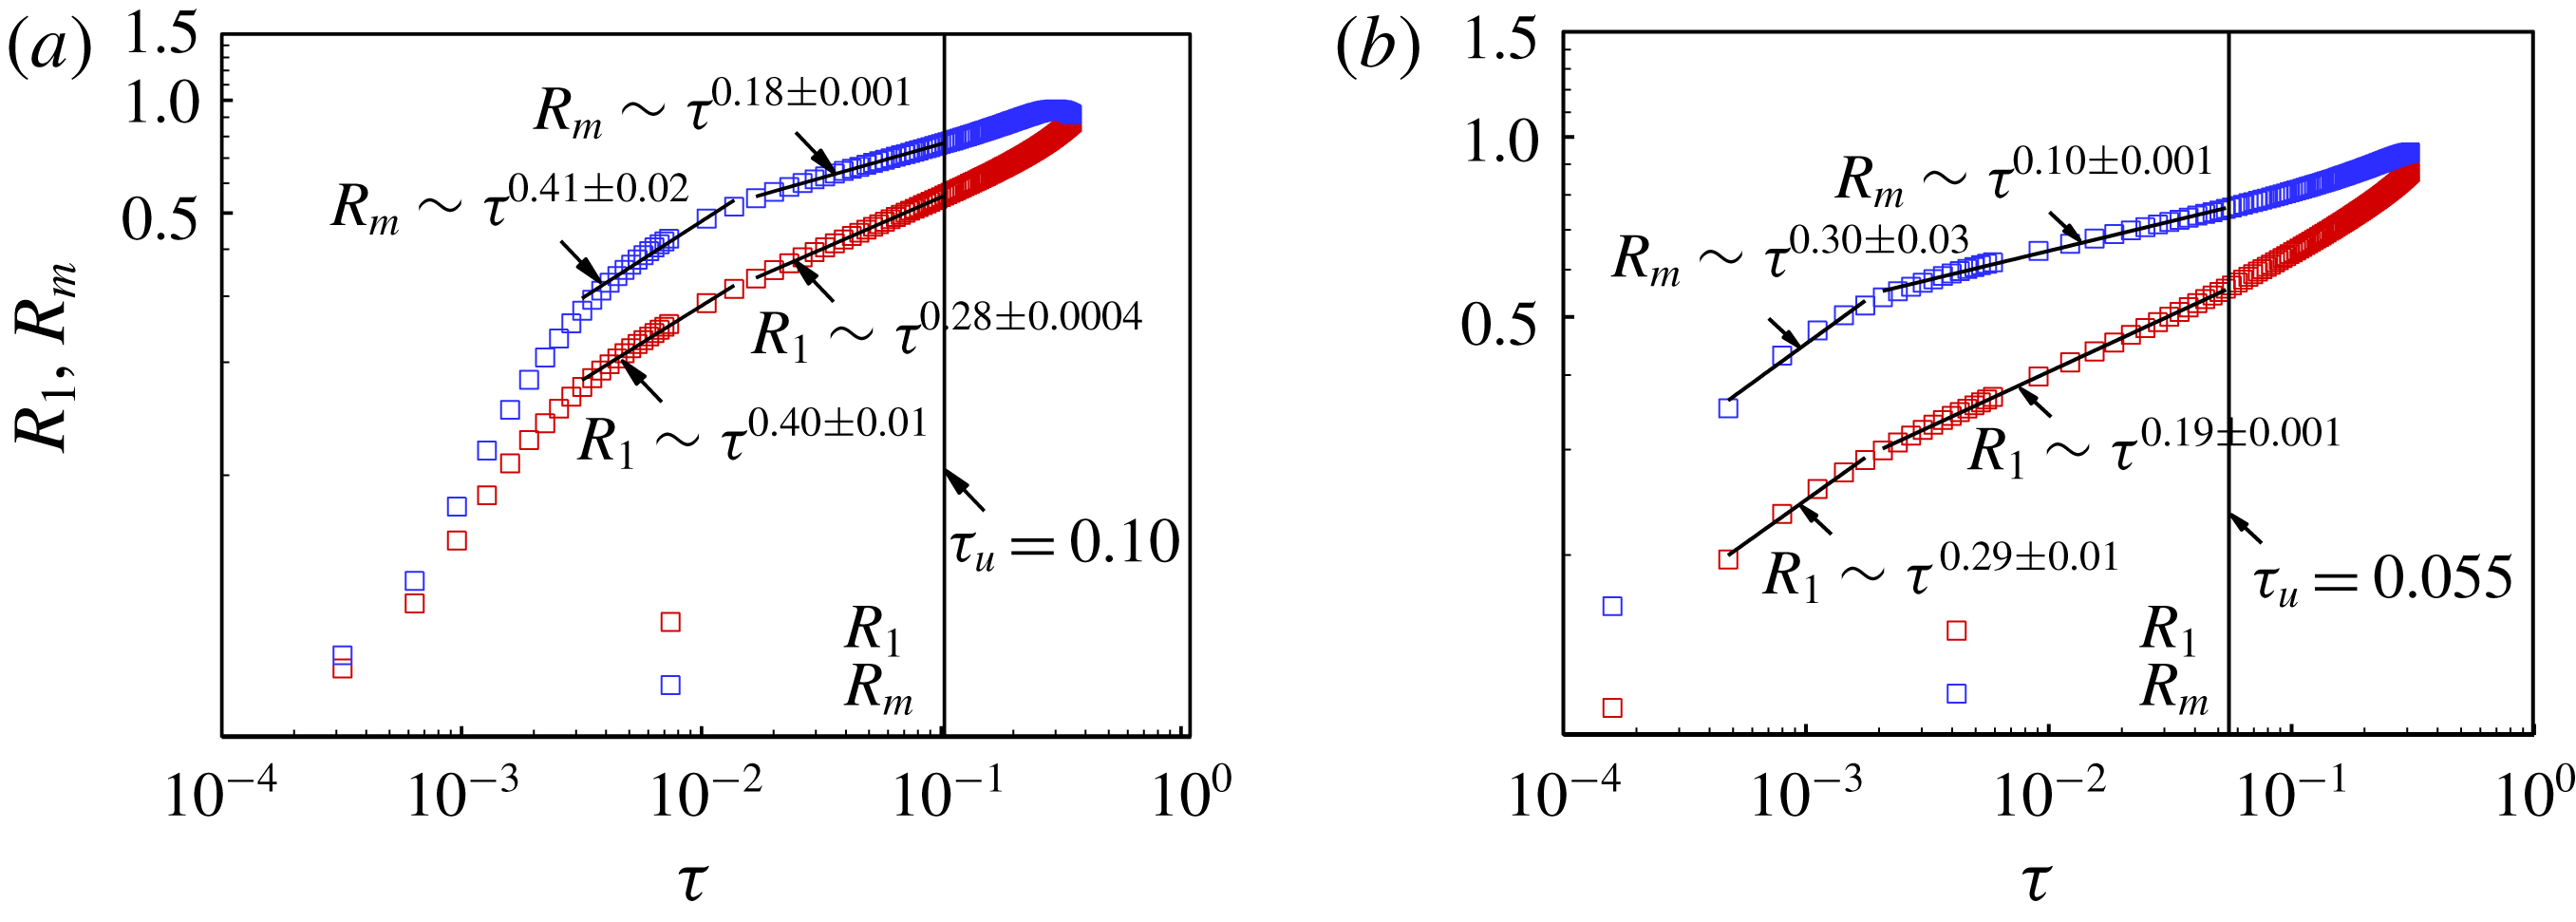
according to the Young–Laplace equation. Figures 3(a) and 3(b) show the evolutions of
 $R_{1}$
and
 $R_{m}$
for
 $Ca=2.0\times 10^{-4}$
and
 $2.0\times 10^{-5}$
, respectively, where
 $\unicode[STIX]{x1D70F}=t_{c}-t$
represents the time remaining until pinch-off, with
 $t$
the time and
 $t_{c}$
the time at pinch-off. The radii are normalized by
 $R$
, and time is scaled by
 $R/U$
. Note that, the normal direction of the neck surface is chosen here to point from the surface to the inside of the fluid thread.
 $R_{1}$
is always positive since the centre of
 $R_{1}$
is on the same side as the surface normal, while
 $R_{2}$
is negative when the centre of
 $R_{2}$
is on the opposite side of the surface normal, as it is during most of the time of the breakup. The centre of
 $R_{2}$
moves to the positive side of the surface normal, as it is at the final moments of the breakup due to the formation of the satellite droplet at the centre. In figure 3(a,b), we identify two stages where
 $R_{1}$
and
 $R_{m}$
exhibit power law behaviours with
 $\unicode[STIX]{x1D70F}^{\unicode[STIX]{x1D6FC}}$
, where the scaling constant
 $\unicode[STIX]{x1D6FC}$
is a signature of the physical mechanisms causing the collapse (van Hoeve et al.
Reference van Hoeve, Dollet, Versluis and Lohse2011). In the earlier necking stage before the first collapse stage for both
 $Ca$
numbers, the variations in the radii do not conform to any power law with a constant
 $\unicode[STIX]{x1D6FC}$
. We thus expect a critical condition representing the transition between the earlier necking stage and the collapse stages.
Time evolutions of
 $R_{1}$
and
 $R_{m}$
for axisymmetric breakup of a confined fluid thread under
 $Ca$
of
 $2.0\times 10^{-4}$
(a) and
 $2.0\times 10^{-5}$
(b).

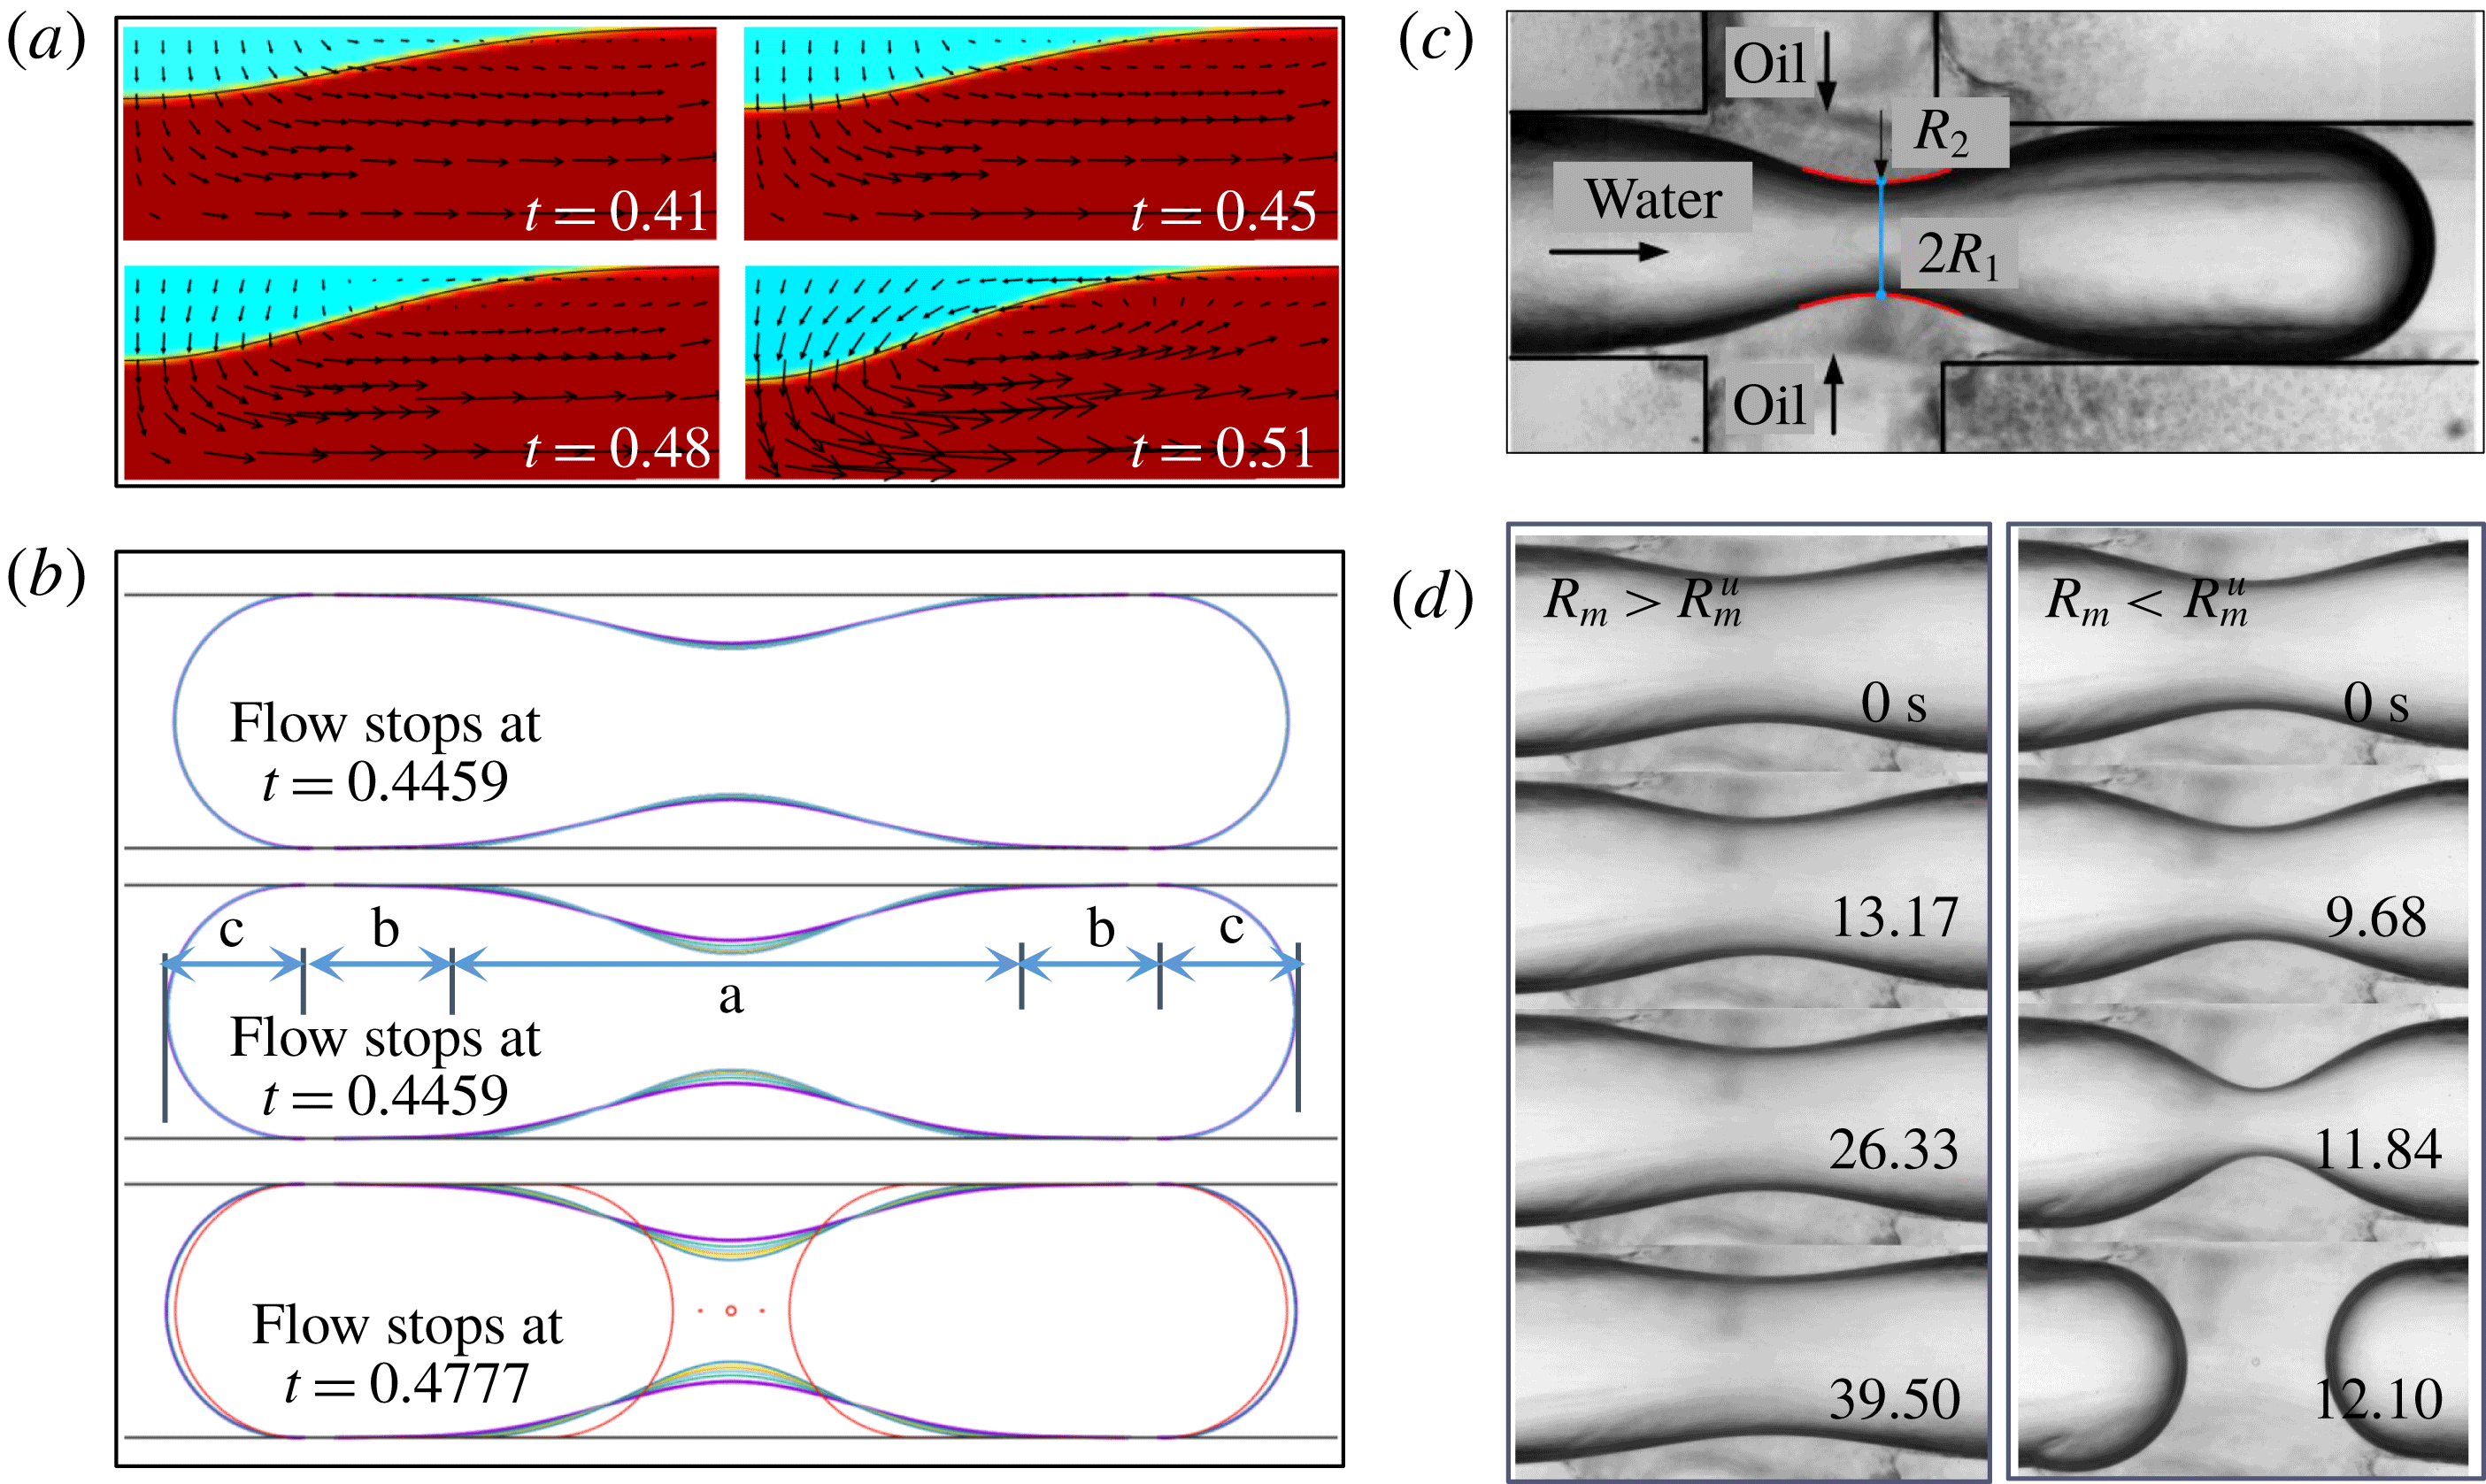
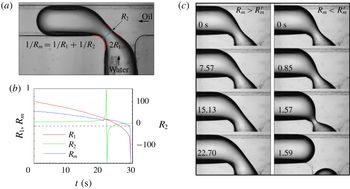
From the evolution of the flow field, we find a transition of the flow pattern near the neck. As shown in figure 4(a), oil flows expansively to squeeze the interface at
 $t=0.41$
and 0.45, while oil flows towards the neck centre at
 $t$
= 0.48 and 0.51. We obtain the critical time
 $t_{u}$
representing the flow transition with the help of the stop-flow method (Stone, Bentley & Leal Reference Stone, Bentley and Leal1986; Blanchette & Bigioni Reference Blanchette and Bigioni2006; Hoang et al.
Reference Hoang, Portela, Kleijn, Kreutzer and van Steijn2013). For a given simulation, resumable files are saved at different moments. For each file, the flow is stopped by setting the velocities of both the flow field and the inlet to zero. The resumable files are then carried on to determine
 $t_{u}$
by distinguishing different flow patterns. For
 $Ca=2.0\times 10^{-5}$
, we obtain
 $t_{u}$
and the corresponding critical mean radius
 $R_{m}^{u}$
,
 $(0.76\pm 0.002)$
. If the flow stops when
 $R_{m}>R_{m}^{u}$
, as shown in figure 4(b), the interface remains stationary after small relaxations (at
 $t=0.4459$
and 0.4745). If the flow stops when
 $R_{m}<R_{m}^{u}$
, the neck thins spontaneously until it collapses (at
 $t=0.4777$
). The mean radius of the stationary interface, corresponding to
 $R_{m}^{u}$
,
 $R_{m}^{st}$
, is approximately
 $0.72$
. The critical remaining time
 $\unicode[STIX]{x1D70F}_{u}=t_{c}-t_{u}$
is obtained for each
 $Ca$
number, as in figure 3(a,b). Here
 $\unicode[STIX]{x1D70F}_{u}$
preferably represents the duration of the late collapse stage, indicating that the transition of the flow pattern is equivalent to the transition between the earlier necking stage and the later collapse stage.
Determination of the critical mean radius
 $R_{m}^{u}$
at the neck centre for axisymmetric configurations. (a) Transition of the flow pattern during breakup for
 $Ca=2.0\times 10^{-5}$
. (b) Evolution of the interface during stop-flow simulations. The initial shapes are adapted from the simulation for
 $Ca=2.0\times 10^{-5}$
. (c) Stop-flow experiments to determine
 $R_{m}^{u}$
. Supplementary movies 1 and 2 are for
 $R_{m}>R_{m}^{u}$
and
 $R_{m}<R_{m}^{u}$
, respectively.

The existence of the abovementioned transition is further confirmed by stop-flow experiments in a flow-focusing microfluidic device with circular channels fabricated by the rapid prototyping method. As shown in figure 4(c), water flows into the channel junction from the left inlet and oil flows into the junction from the top and bottom inlets. Note that, since the flow rate of the oil phase is low, the interface is expected to have a rapid response to the oil flow to make the neck region axisymmetric. The physical and geometrical parameters are
 $\unicode[STIX]{x1D707}_{w}=1~\text{mPa}~\text{s}$
,
 $\unicode[STIX]{x1D70C}_{w}=998~\text{kg}~\text{m}^{-3}$
,
 $\unicode[STIX]{x1D707}_{o}=20~\text{mPa}~\text{s}$
,
 $\unicode[STIX]{x1D70C}_{o}=950~\text{kg}~\text{m}^{-3}$
,
 $\unicode[STIX]{x1D70E}=35~\text{mN}~\text{m}^{-1}$
, and
 $R=400~\unicode[STIX]{x03BC}\text{m}$
. During the stop-flow experiments, the water flow is switched off after the thread tip passes the channel junction. The oil flow is intermittently stopped and resumed to determine the critical shape of the neck. A MATLAB code (provided in the supplementary material) has been written to measure the two principal radii at the neck centre, as indicated in figure 4(c). The critical mean radius,
 $R_{m}^{u}$
, is found to be
 $(0.79\pm 0.04)$
, in agreement with the value of
 $(0.76\pm 0.002)$
obtained from simulations. When the flow stops at
 $R_{m}>R_{m}^{u}$
, the interface relaxes inwards, as in the simulations, and then slowly moves outwards. This outward motion may be attributed to the leakage of oil from the neck region through the gaps between the rough channel wall and the interface. When the flow stops at
 $R_{m}<R_{m}^{u}$
, the neck collapses irreversibly, as in the simulations.
3.2 Destabilizing mechanism of axisymmetric fluid threads
The above stop-flow studies provide direct evidence that the earlier necking stage is quasi-stable (Garstecki et al.
Reference Garstecki, Stone and Whitesides2005). Our simulations suggest that the internal pressure of the droplet is nearly constant during the quasi-stable necking stage. Using the pressure outside of the droplet tips as the reference pressure, the internal pressure of the fluid thread can be estimated by the capillary pressure of the tips,
 $\unicode[STIX]{x1D70E}/R_{m}$
, which equals
 $2\unicode[STIX]{x1D70E}/R$
since
 $R_{m}=R/2$
(
 $R_{1}=R_{2}=R$
at the tips). Additionally, the oil pressure outside the neck is almost evenly distributed during the quasi-stable stage. The capillary pressure is thus nearly constant along the neck interface, indicating that
 $R_{m}$
can be considered constant along the neck region. In the axisymmetric configuration, the neck interface is essentially a surface of revolution with constant mean curvature or a Delaunay surface (Delaunay Reference Delaunay1841).
 $R_{m}$
varies from
 $R$
to approximately
 $0.76R$
in the quasi-stable stage. The corresponding capillary pressure, varying from
 $\unicode[STIX]{x1D70E}/R$
to
 $1.32\unicode[STIX]{x1D70E}/R$
, is consistently smaller than the internal pressure,
 $2\unicode[STIX]{x1D70E}/R$
. The internal pressure pushes the interface outwards to stabilize it against inward collapse. The stabilization of the confined fluid thread thus originates from the domination of the internal pressure caused by the thread tips under confinement.
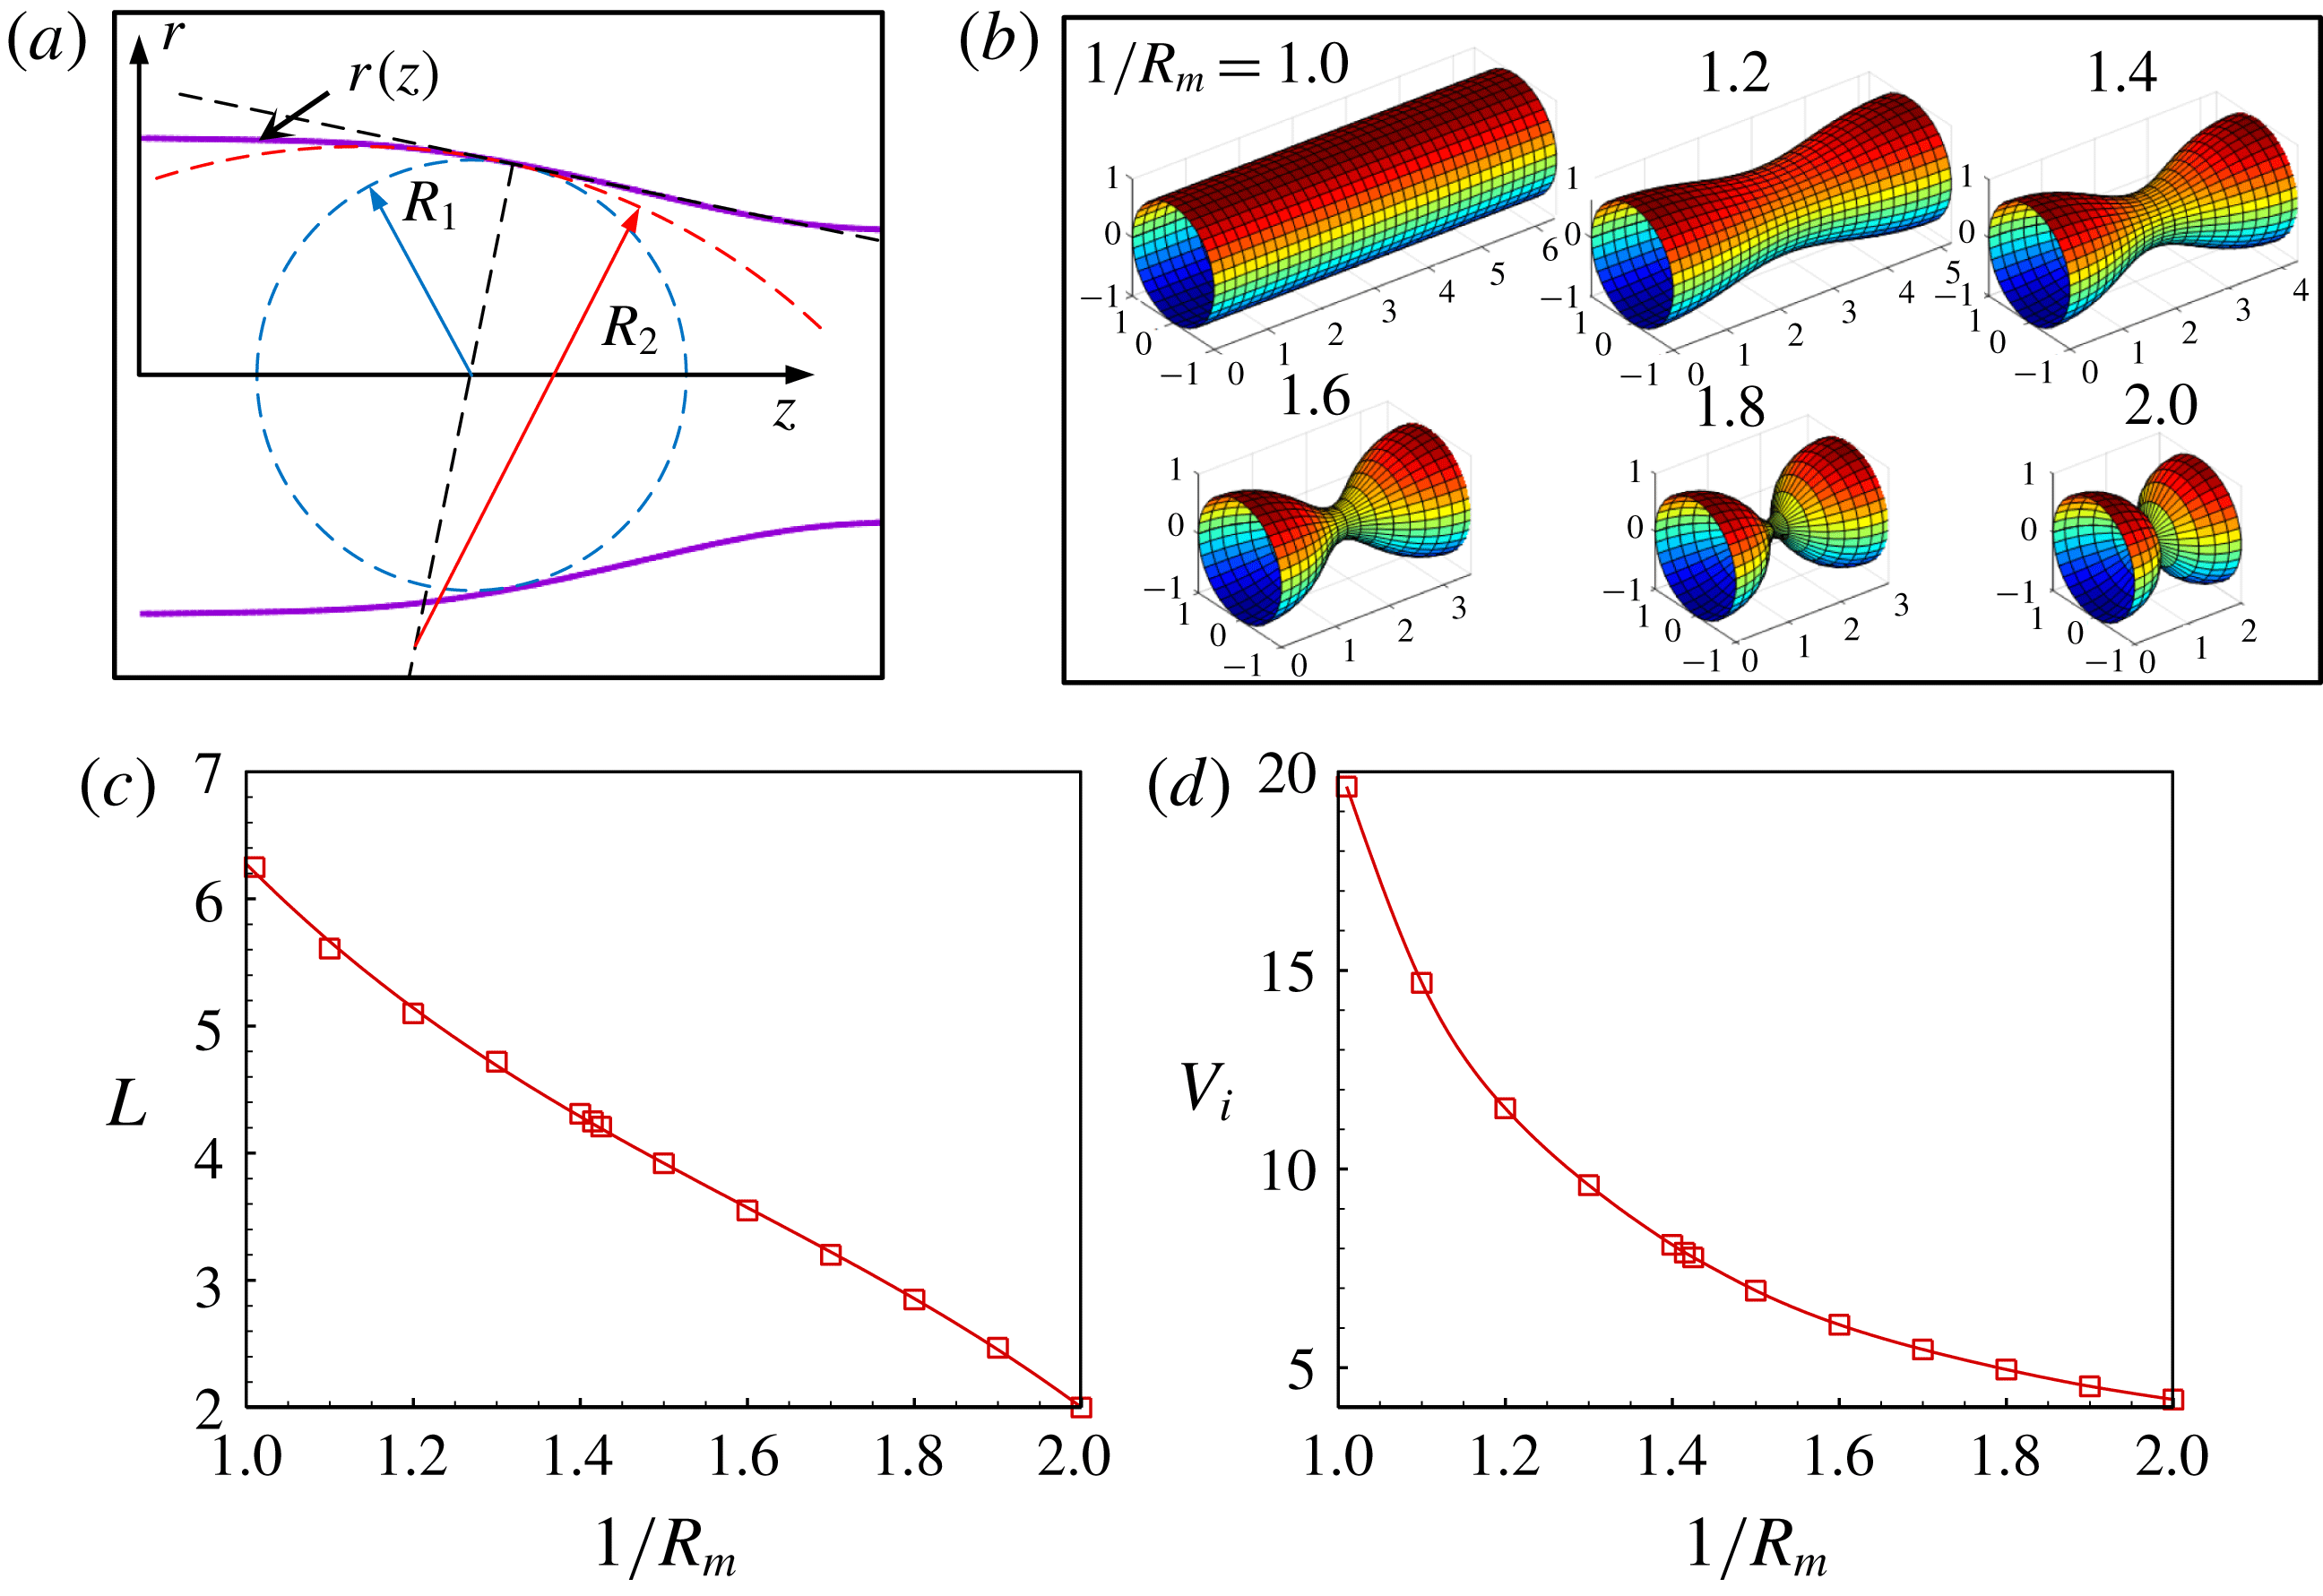
(a) Sketch of the neck profile consisting of a constant-mean-curvature curve. (b) Axisymmetric constant-mean-curvature surface with increasing
 $1/R_{m}$
. (c) Variation of the length of the neck region with
 $1/R_{m}$
. (d) Variation of the volume contained by the constant-mean-curvature surface with
 $1/R_{m}$
.

The constant-mean-curvature feature of the neck interface inspires us to propose a theoretical analysis to reveal an unrecognised destabilizing scenario of the capillary instability. As shown in figure 4(b), the shape of a tightly confined droplet can be divided into three types of regions at low flow-rate conditions: (a) the neck region, (b) two cylindrical regions and (c) two hemispherical head-ends. If representing the neck profile as
 $r(z)$
in the rotating coordinate system shown in figure 5(a), the two principal radii of curvature are derived from geometrical relationships as
 $$\begin{eqnarray}\displaystyle R_{1}(z)=r(z)[1+{\dot{r}}(z)^{2}]^{1/2} & & \displaystyle\end{eqnarray}$$
and
 $$\begin{eqnarray}\displaystyle R_{2}(z)=-{\displaystyle \frac{[1+{\dot{r}}(z)^{2}]^{3/2}}{\ddot{r}(z)}}, & & \displaystyle\end{eqnarray}$$
respectively. We consider a general situation in which the fluid thread is long enough to have all three types of regions during the breakup. Boundary conditions of
 $r(0)=R$
and
 ${\dot{r}}(0)=0$
are thus valid at the junction between the neck and cylindrical regions. The shapes of the neck for
 $1/R\leqslant 1/R_{m}\leqslant 2/R$
are obtained by solving
 $$\begin{eqnarray}\displaystyle 1/R_{m}=1/R_{1}(z)+1/R_{2}(z) & & \displaystyle\end{eqnarray}$$
using a MATLAB code (provided in the supplementary material). Note that it is possible to predict the shape of the entire fluid thread since the only additional variable for a given
 $1/R_{m}$
is the length of each cylindrical region, which can be obtained from volume conservation. Figure 5(b) shows the shapes of the constant-mean-curvature surface with the variation of
 $1/R_{m}$
. The shape changes from cylindrical to two intersecting hemispheres. The length of the neck region
 $L$
decreases near-linearly with
 $1/R_{m}$
, as shown in figure 5(c). The initial cylindrical shape has a maximum length of
 $2\unicode[STIX]{x03C0}R$
, according to Delaunay (Reference Delaunay1841). The length decreases to
 $2R$
for
 $1/R_{m}=2R$
. The volume contained by the constant-mean-curvature surface
 $V_{i}$
also decreases with
 $1/R_{m}$
, as shown in figure 5(d) (scaled by
 $R^{3}$
).
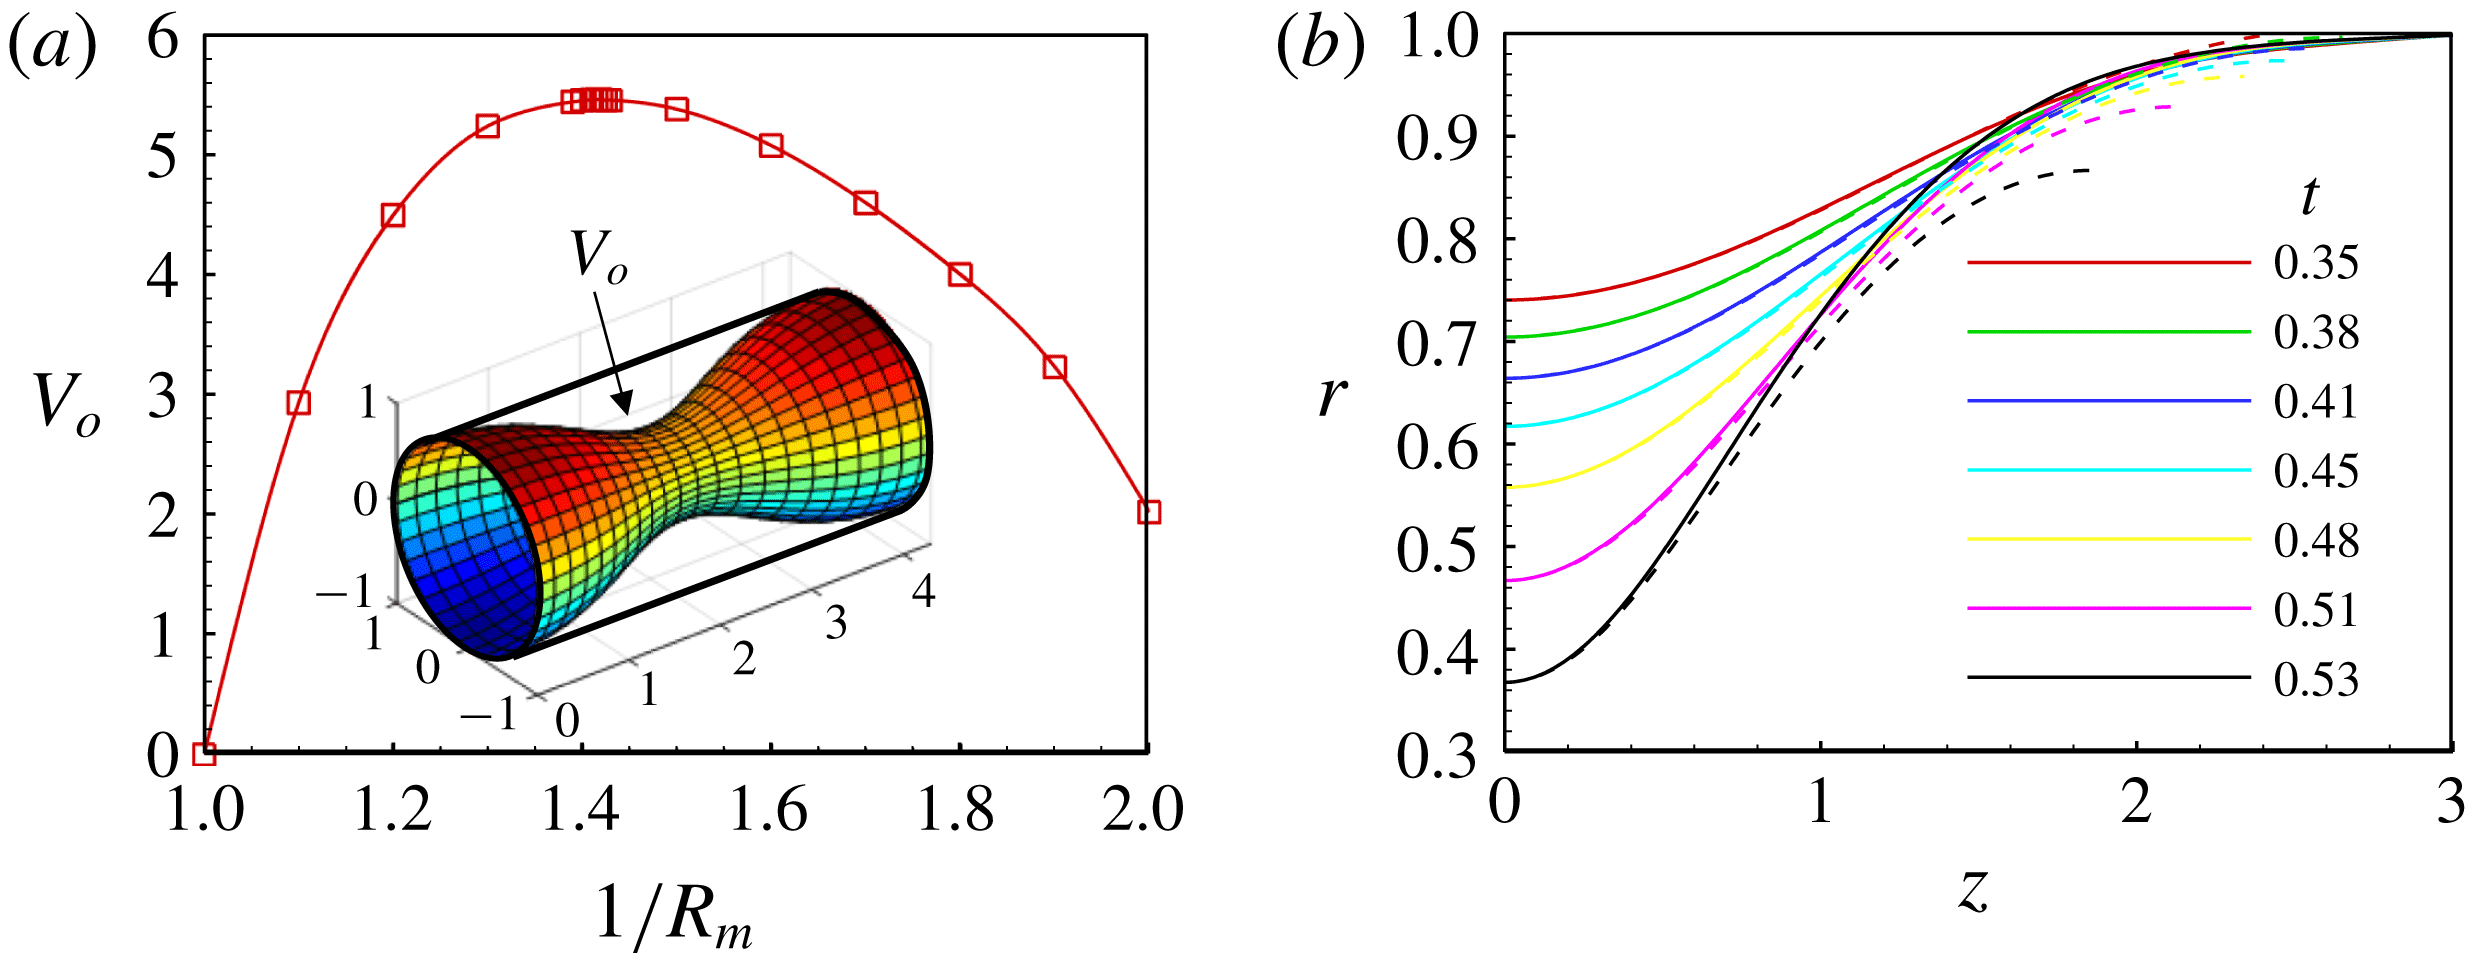
It is interesting to note that the volume between the neck interface and the columnar channel wall
 $V_{o}$
increases first and then decreases with increasing
 $1/R_{m}$
as shown in figure 6(a). During the whole process of necking, oil inevitably flows into the channel, resulting in the oil volume increasing with
 $1/R_{m}$
during the breakup. When the volume is larger than the maximum allowed for the constant-mean-curvature surfaces,
 $R_{m}$
can no longer be constant along the neck interface. A capillary pressure gradient thus emerges along the interface to promote an irreversible collapse. Figure 6(a) shows that the maximum oil volume for the constant-mean-curvature surfaces occurs at
 $R_{m}=(0.71\pm 0.001)$
. The corresponding
 $V_{o}$
is approximately 5.45. This critical
 $R_{m}$
is in good agreement with
 $R_{m}^{st}$
obtained numerically for
 $Ca=2.0\times 10^{-5}$
, approximately
 $0.72$
. We support this finding directly by comparing the simulated neck profiles for
 $Ca=2.0\times 10^{-5}$
with the corresponding constant-mean-curvature profiles as shown in figure 6(b). The constant-mean-curvature profiles are calculated by solving (3.3) using the values of
 $R_{1}$
and
 $R_{m}$
at the neck centre as boundary conditions. Good agreements are achieved before the critical moment
 $t_{u}$
, approximately 0.48. Note that there are disparities between the numerical and theoretical profiles near the joint of the neck region and the cylindrical region. They are likely due to dynamical effects in the flow-field that increase the oil pressure near the joint. Obvious differences are observed after
 $t_{u}$
, indicating that the neck profiles are no longer constant-mean-curvature profiles. The destabilization of the axisymmetrically confined fluid threads is clearly the result of the gradient of the capillary pressure induced by the confinements of both geometry and flow. This instability scenario can be termed confinement-induced capillary instability.
(a) Evolution of the oil volume between the interface and the cylindrical channel with the mean curvature for the constant-mean-curvature surface. (b) Comparison of the neck profiles between the numerical simulations (solid lines) and constant-mean-curvature profiles (dashed lines) using the neck radii from the simulations as boundary conditions.

To further validate the above finding, we calculate the static shapes of an axisymmetrically confined fluid thread for given
 $V_{o}$
(scaled by
 $R^{3}$
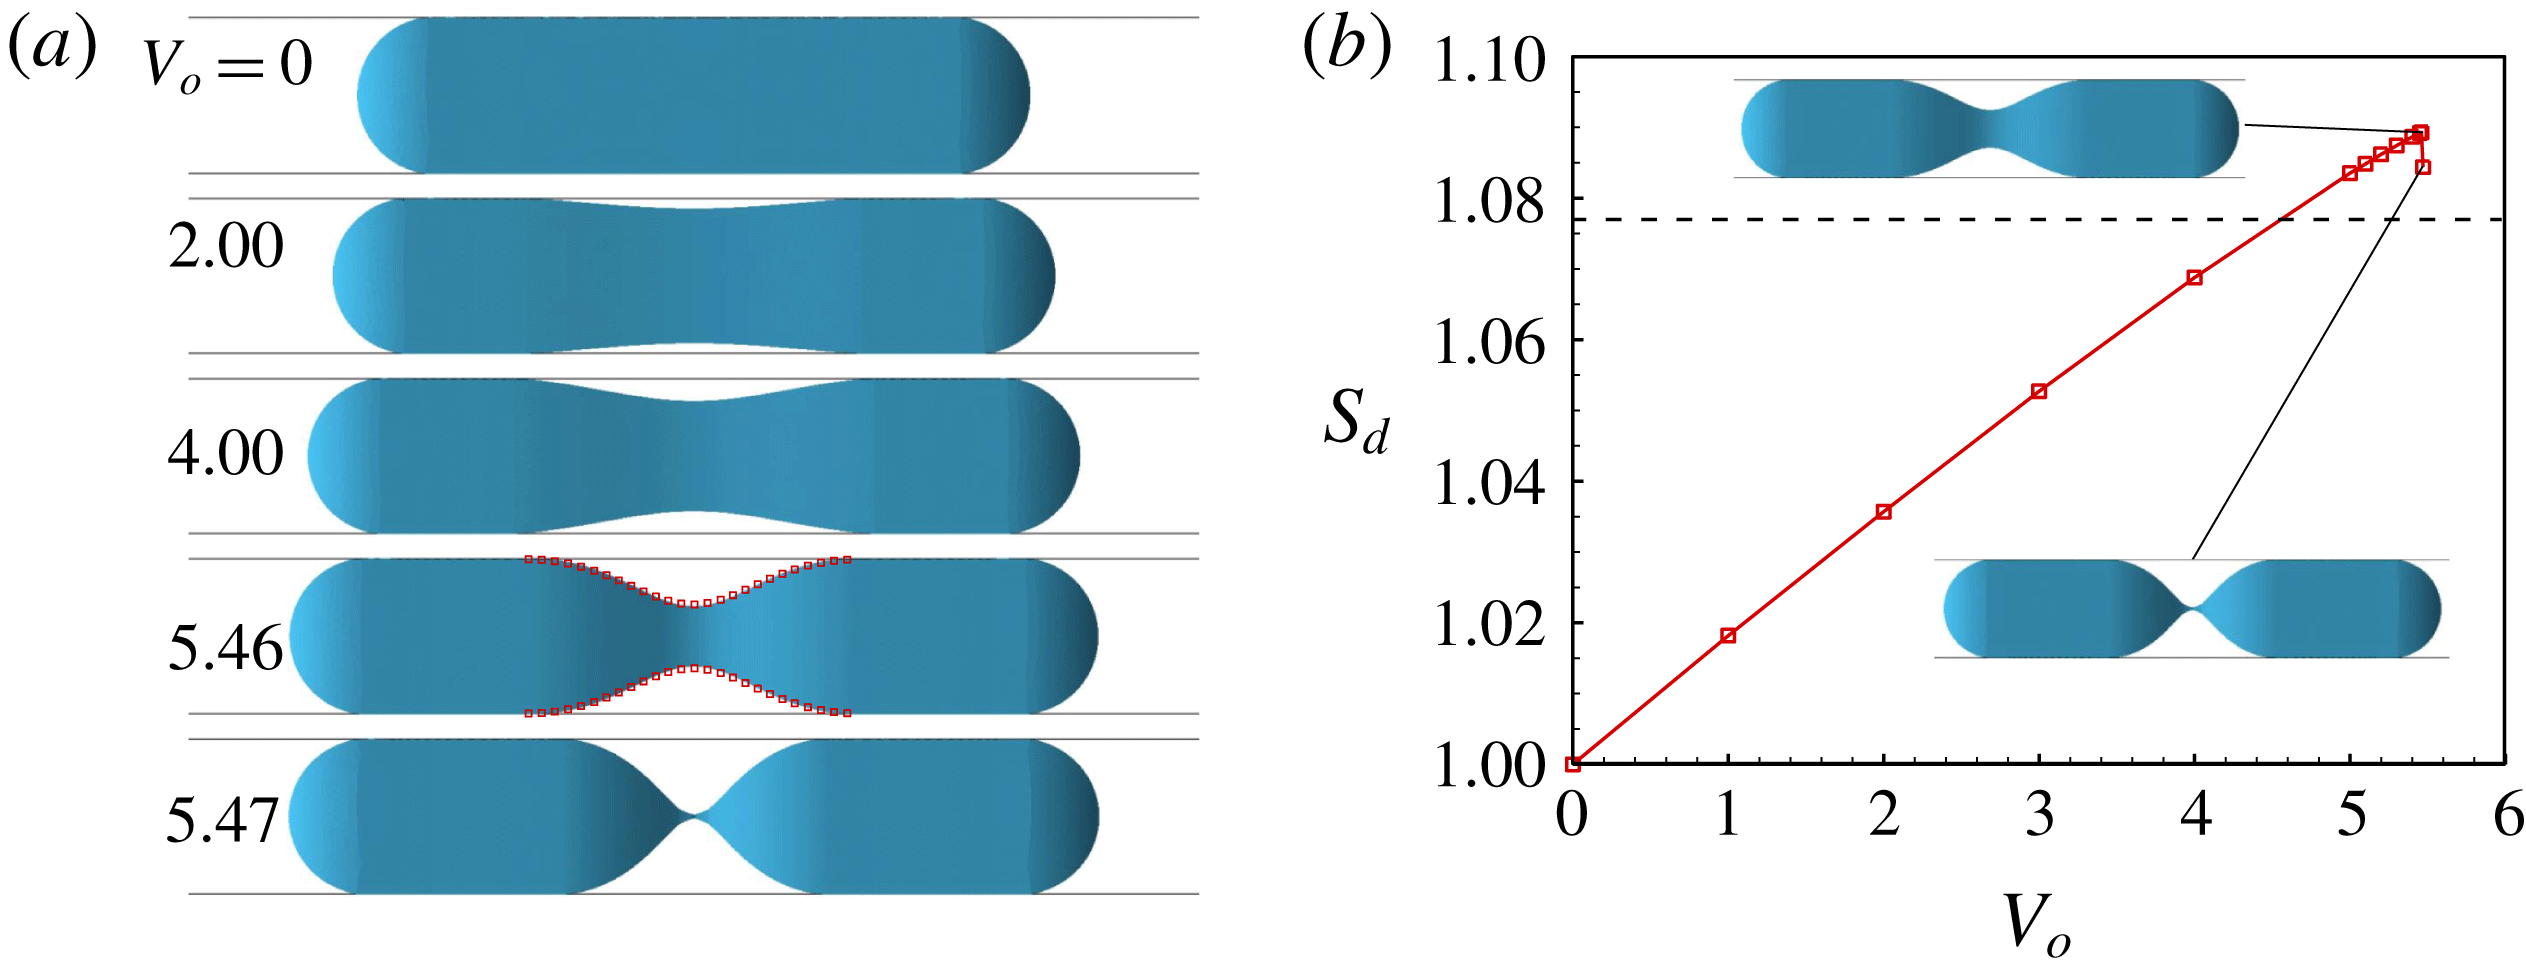
) using the Surface Evolver program that is able to evolve the surface towards its minimal energy (Brakke Reference Brakke1992). A fluid thread with a fixed volume is constrained in a circular tube. The outer fluid with a volume of
 $V_{o}$
is placed at the centre of the fluid thread to encircle it. Figure 7(a) shows several static shapes under different
 $V_{o}$
. The fluid thread is stable as
 $V_{o}$
varies from 0 to 5.46. When
 $V_{o}=5.47$
, the fluid thread becomes unstable and the interfacical meshes collapse to the centre since the Surface Evolver program cannot handle a topological change of interface. The critical
 $V_{o}$
is in good agreement with the above theoretical prediction, i.e. approximately 5.45. As shown in figure 7(a), the critical neck profile predicted theoretically is overlapped onto the static shape for
 $V_{o}=5.46$
, further indicating the good agreement. Figure 7(b) shows that the interfacial energy of the fluid thread
 $S_{d}$
increases with
 $V_{o}$
until
 $V_{o}=5.46$
. When
 $V_{o}=5.47$
, the interfacial energy is released to show a sudden jump. Note that, in practice, the fluid thread breaks into two identical droplets with round ends at
 $V_{o}=5.47$
. The corresponding
 $S_{d}$
can be calculated from volume conservation, as indicated by the dashed line in figure 7(b). The energy plot indicates that there is an energy barrier, determined by the critical shape, that must be overcome to induce the capillary instability.
(a) Static shapes of axisymmetrically confined fluid thread obtained by Surface Evolver for given
 $V_{o}$
. (b) Variation of the interfacial energy of the confined fluid thread
 $S_{d}$
with
 $V_{o}$
.

Additional simulations are carried out to investigate the influences of
 $Ca$
and the physical parameters of the two fluids on the critical neck shape. For the first case, only
 $U$
is altered to be
 $1/10$
of that in the case in figure 3(b), with a corresponding
 $Ca$
of
 $2.0\times 10^{-6}$
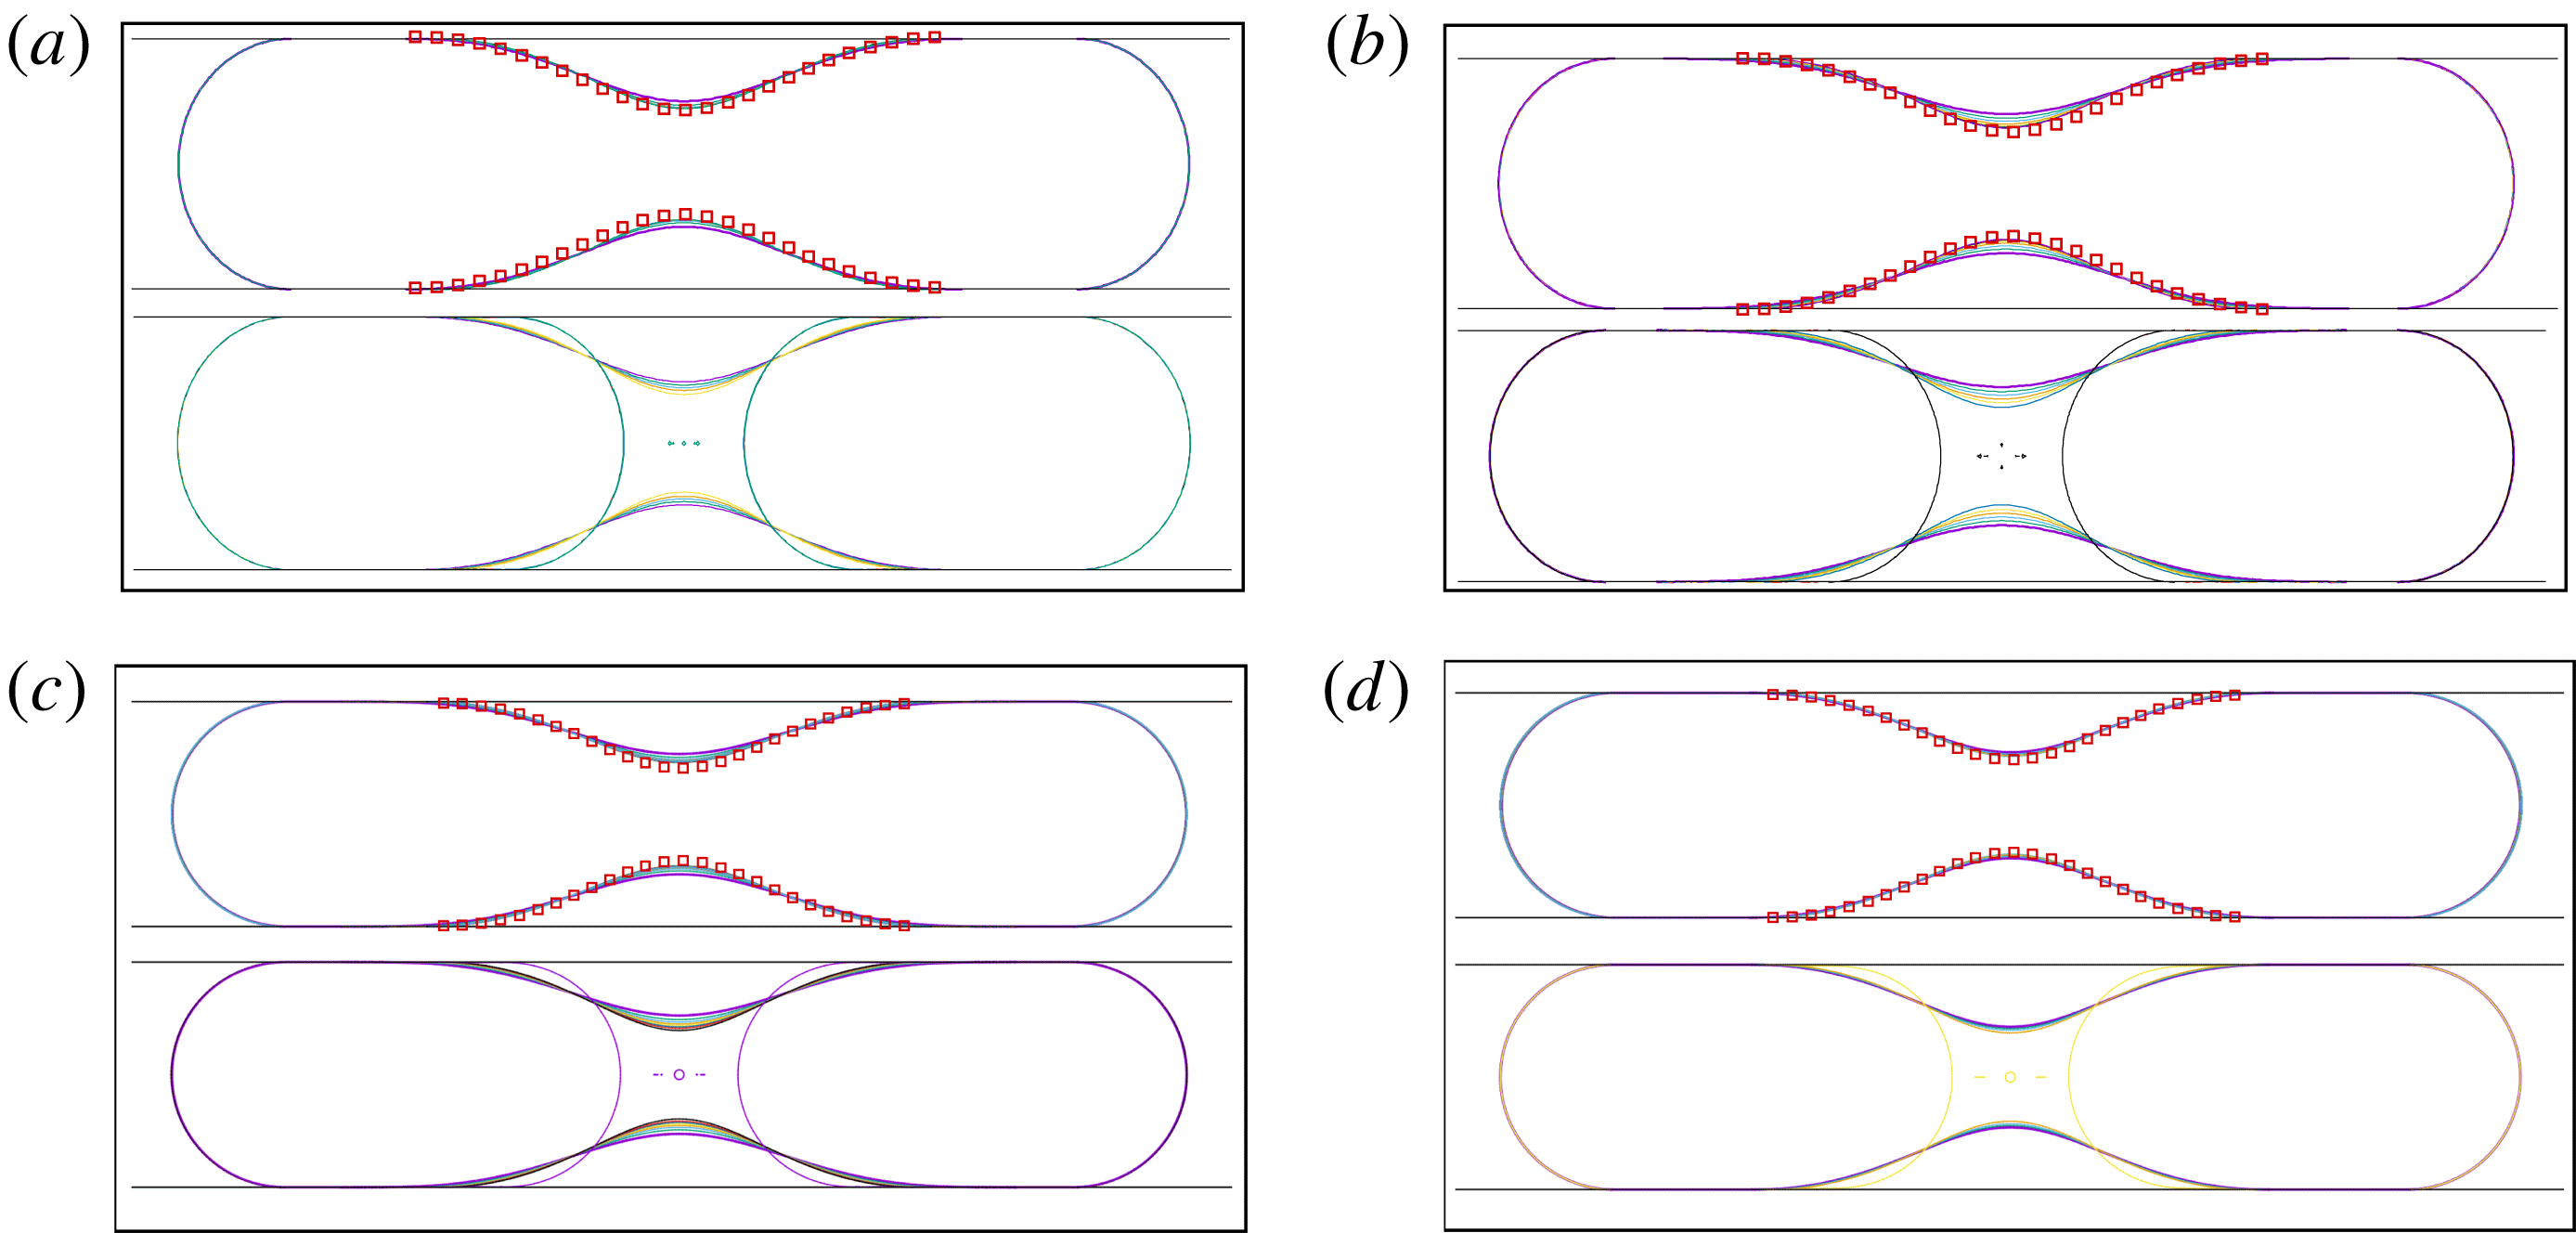
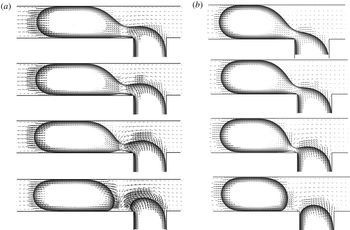
. The top and bottom images in figure 8(a) show the evolutions of the interface when the flow is stopped just before and after the critical moments, respectively. We find
 $R_{m}^{u}$
is measured to be approximately
 $0.73R$
and
 $R_{m}^{st}$
is approximately
 $0.71R$
, which is very close to the theoretical prediction. This means that
 $R_{m}^{u}$
and
 $R_{m}^{st}$
obtained from the stop-flow simulations converge to the theoretical value of
 $0.71R$
as
 $Ca$
decreases and approaches 0. For the second case, water is changed to air based on the case in figure 3(b).
 $R_{m}^{u}$
obtained from the stop-flow simulations in figure 8(b) is approximately
 $0.76R$
and
 $R_{m}^{st}$
is approximately
 $0.71R$
. For the third case, the viscosity ratio of the oil and water is reduced from 8 to 4, while the interfacial tension is increased from 5 mN m
 $^{-1}$
to 10 mN m
 $^{-1}$
. The corresponding capillary number
 $Ca$
is
 $1.0\times 10^{-5}$
. Stop-flow simulations in figure 8(c) indicate that
 $R_{m}^{u}$
and
 $R_{m}^{st}$
are approximately
 $0.75R$
and
 $0.72R$
, respectively. For the fourth case, we further reduce the viscosity ratio from 4 to 1 and increase the interfacial tension from 10 mN m
 $^{-1}$
to 40 mN m
 $^{-1}$
. The corresponding
 $Ca$
is
 $2.5\times 10^{-6}$
.
 $R_{m}^{u}$
and
 $R_{m}^{st}$
are then
 $0.72R$
and
 $0.71R$
, respectively. The critical neck profile predicted theoretically is overlapped onto the top images in the four frames in figure 8, to show the agreements between the numerical simulations and the theoretical prediction. Therefore, it is safe to conclude that the confinement-induced capillary instability is not affected by the physical parameters of the two fluids.
Interfacial evolutions just before and after the critical moments determined by stop-flow simulations for four conditions with different flow and physical parameters. The top and bottom images in each of the four frames are for before and after the critical moments, respectively. (a) Only
 $U$
is altered to be
 $1/10$
of that in the case in figure 3(b). The corresponding capillary number
 $Ca$
is
 $2.0\times 10^{-6}$
. (b) Water is changed to air based on the case in figure 3(b). (c) The viscosity ratio of oil and water is 4, while the interfacial tension is 10 mN m
 $^{-1}$
. The corresponding
 $Ca$
is
 $1.0\times 10^{-5}$
. (d) The viscosity ratio of oil and water is 1, while the interfacial tension is 40 mN m
 $^{-1}$
. The corresponding
 $Ca$
is
 $2.5\times 10^{-6}$
.

Droplet breakup in a flow-focusing configuration with a square microchannel. (a) Schematic of the simulation set-up. (b) Time evolutions of the three radii for
 $Ca=6.2\times 10^{-4}$
. The three radii are scaled with
 $H/2$
, and the time is scaled with
 $H/2U$
. The critical time
 $t_{u}$
is determined by stop-flow simulations.

Droplet-based microfluidics utilizes the breakup of a confined fluid thread to generate monodispersed droplets. Microfluidic channels fabricated by soft lithography have rectangular cross-sections. To determine if the confinement-induced mechanism is valid for fluid threads in rectangular channels, droplet breakup in a flow-focusing configuration with a square microchannel is studied numerically. As shown in figure 9(a), the oil phase with a velocity of
 $U$
flows into the channel with a height
 $H$
(25
 $\unicode[STIX]{x03BC}$
m) and from the top and bottom openings to squeeze a long water droplet at its centre. The physical parameters are the same as those in figure 3. The time evolutions of the three radii for
 $Ca=6.2\times 10^{-4}$
are shown in figure 9(b). We find that the neck region is approximately axisymmetric at the centre since
 $Ca$
is small. Stop-flow simulations demonstrate that
 $R_{m}^{u}=(0.76\pm 0.01)(H/2)$
, agreeing with that in the axisymmetric configuration. The confinement-induced capillary instability is thus also applicable for fluid threads in square microchannels, as long as the fluid thread has an axisymmetric neck region.
Rapid collapse of the neck region and determination of the critical mean radius at the neck centre
 $R_{m}^{r}$
. (a) Experimental configuration and measurements of two principal radii of curvature for fluid thread breakup in a T-junction of a cross-flowing configuration. The physical parameters are the same as those in figure 2(c). (b) Time evolution of the radii at the neck centre for
 $Ca=2.0\times 10^{-5}$
. (c) Interfacial evolution before and after the critical moment from experiments using the stop-flow method. Supplementary movies 3 and 4 are for
 $R_{m}>R_{m}^{r}$
and
 $R_{m}<R_{m}^{r}$
, respectively.

3.3 Destabilizing mechanism of non-axisymmetric fluid threads
The above investigations combine simulations, experiments, and theory to reveal the confinement-induced breakup mechanism of axisymmetric fluid threads. We also experimentally study the breakup of a non-axisymmetric fluid thread with circular channels in a cross-flowing configuration, as shown in figure 10(a). The channel diameter and the fluid properties are the same as those in figure 4(c). Water and oil flow from the bottom and right inlets, respectively, into the channel junction. The water thread is squeezed by the oil phase to break up at the channel junction into water droplets. The usage of circular channels avoids leakage in the corners of rectangular channels. This enables us to investigate the fluid thread breakup in the cross-flowing configuration under an extremely low flow-rate condition. It is thus reasonable to assume that the main radius is constant around the cross-section of the neck centre, except the region that contacts with the wall. The shape of the neck can then be represented by the two principal radii indicated in figure 10(a). Figure 10(b) shows the evolution of the three radii measured from high-speed images under
 $Ca=2.0\times 10^{-5}$
. The measurement procedure and code can be found in the supplementary material. The collapse occurs more rapidly than that in the axisymmetric configuration, suggesting the existence of a different destabilization mechanism. The stop-flow experiment in figure 10(c) shows that the critical mean radius
 $R_{m}^{r}$
is
 $(0.51\pm 0.01)R$
. The capillary pressure at the neck centre is approximately
 $2\unicode[STIX]{x1D70E}/R$
, which is equal to the internal pressure of the fluid thread determined by the hemispherical tip with
 $R_{m}$
of
 $R/2$
, i.e.
 $0.50R$
. The destabilizing mechanism is thus quite simple – the fluid thread becomes unstable when the capillary pressure at the neck centre balances the internal pressure.
Several destabilizing mechanisms, essentially the same as the one described above, have been identified in other confined situations. For example, approximately half a century ago, Roof (Reference Roof1970) considered the breakup of an oil thread inside a water-filled pore. He indicated theoretically, based on the balancing of the capillary pressure, that for a given shape of constriction, there is a minimum size to the protruding portion of the oil that permits breakup. Subsequently, Beresnev, Li & Vigil (Reference Beresnev, Li and Vigil2009) analysed the distribution of the capillary pressure in a channel with a sinusoidal profile. A geometrical criterion for the spontaneous breakup was developed by comparing the capillary pressure in the troughs to that in the crests. The criterion reduces to the condition for the occurrence of the R–P instability for a free liquid jet in gas. For a fluid thread in a step-emulsification microfluidic device with rectangular channels, a so-called ‘curvature balance model’ for droplet breakup was proposed based on a quasi-static balance between the curvature of the thread inside the inlet channel and the curvature of the ‘bulb’ downstream of the step (Dangla et al. Reference Dangla, Fradet, Lopez and Baroud2013). It was also found that the balance is not dependent upon the fluid properties.
The breakup of a fluid thread in a cross-flowing configuration with rectangular microchannels was believed to be triggered by the backward flow in the corners, from the thread tip to the neck (van Steijn et al.
Reference van Steijn, Kleijn and Kreutzer2009). They used the pressure in the gas thread as the reference pressure to calculate the pressure in the liquid at the squeezing interface and at the thread tip. The pressure difference over the gutters was thus expressed by subtracting the latter pressure from the prior pressure. Experimental measurements of the radii showed that the pressure difference changes sign when the gas thread begins to collapse. This proposed critical condition was indeed essentially the same as the abovementioned mechanism based on the balancing of the capillary pressure. However, it was believed that this change causes the reversed flow in the gutters, which drives the liquid back to the squeezed neck to force the thread to collapse. The existence of the backward flow was determined through the observation of velocity fields only near the neck region (van Steijn et al.
Reference van Steijn, Kleijn and Kreutzer2009). Conversely, our experiments involving a cross-flowing configuration with a circular cross-section (figure 10) demonstrate that the critical geometrical condition happens even when there is no corner at all. To look into this contradiction, numerical simulations are carried out for a fluid thread in a cross-flowing configuration within square microchannels. The channel height and fluid properties are the same as those in the simulations in figure 9. The velocity vectors in the plane of
 $0.1H$
from the top wall are shown in figure 11 for two situations with different lengths of the generated droplets. It is clear that the backward flow in the corners does not start from the thread tip, but only exists near the neck region. The accelerating collapse of the neck region causes the backward flow that drives the oil phase towards the neck centre, similar to the axisymmetric breakup in figure 4(a).
Velocity vectors in the plane of
 $0.1H$
from the top wall during the thread breakup in a T-junction. The capillary number based on the oil phase is
 $6.2\times 10^{-4}$
. The lengths of the generated droplets are approximately
 $2.5H$
(a) and
 $2.0H$
(b) by varying the flow rate of the water phase.

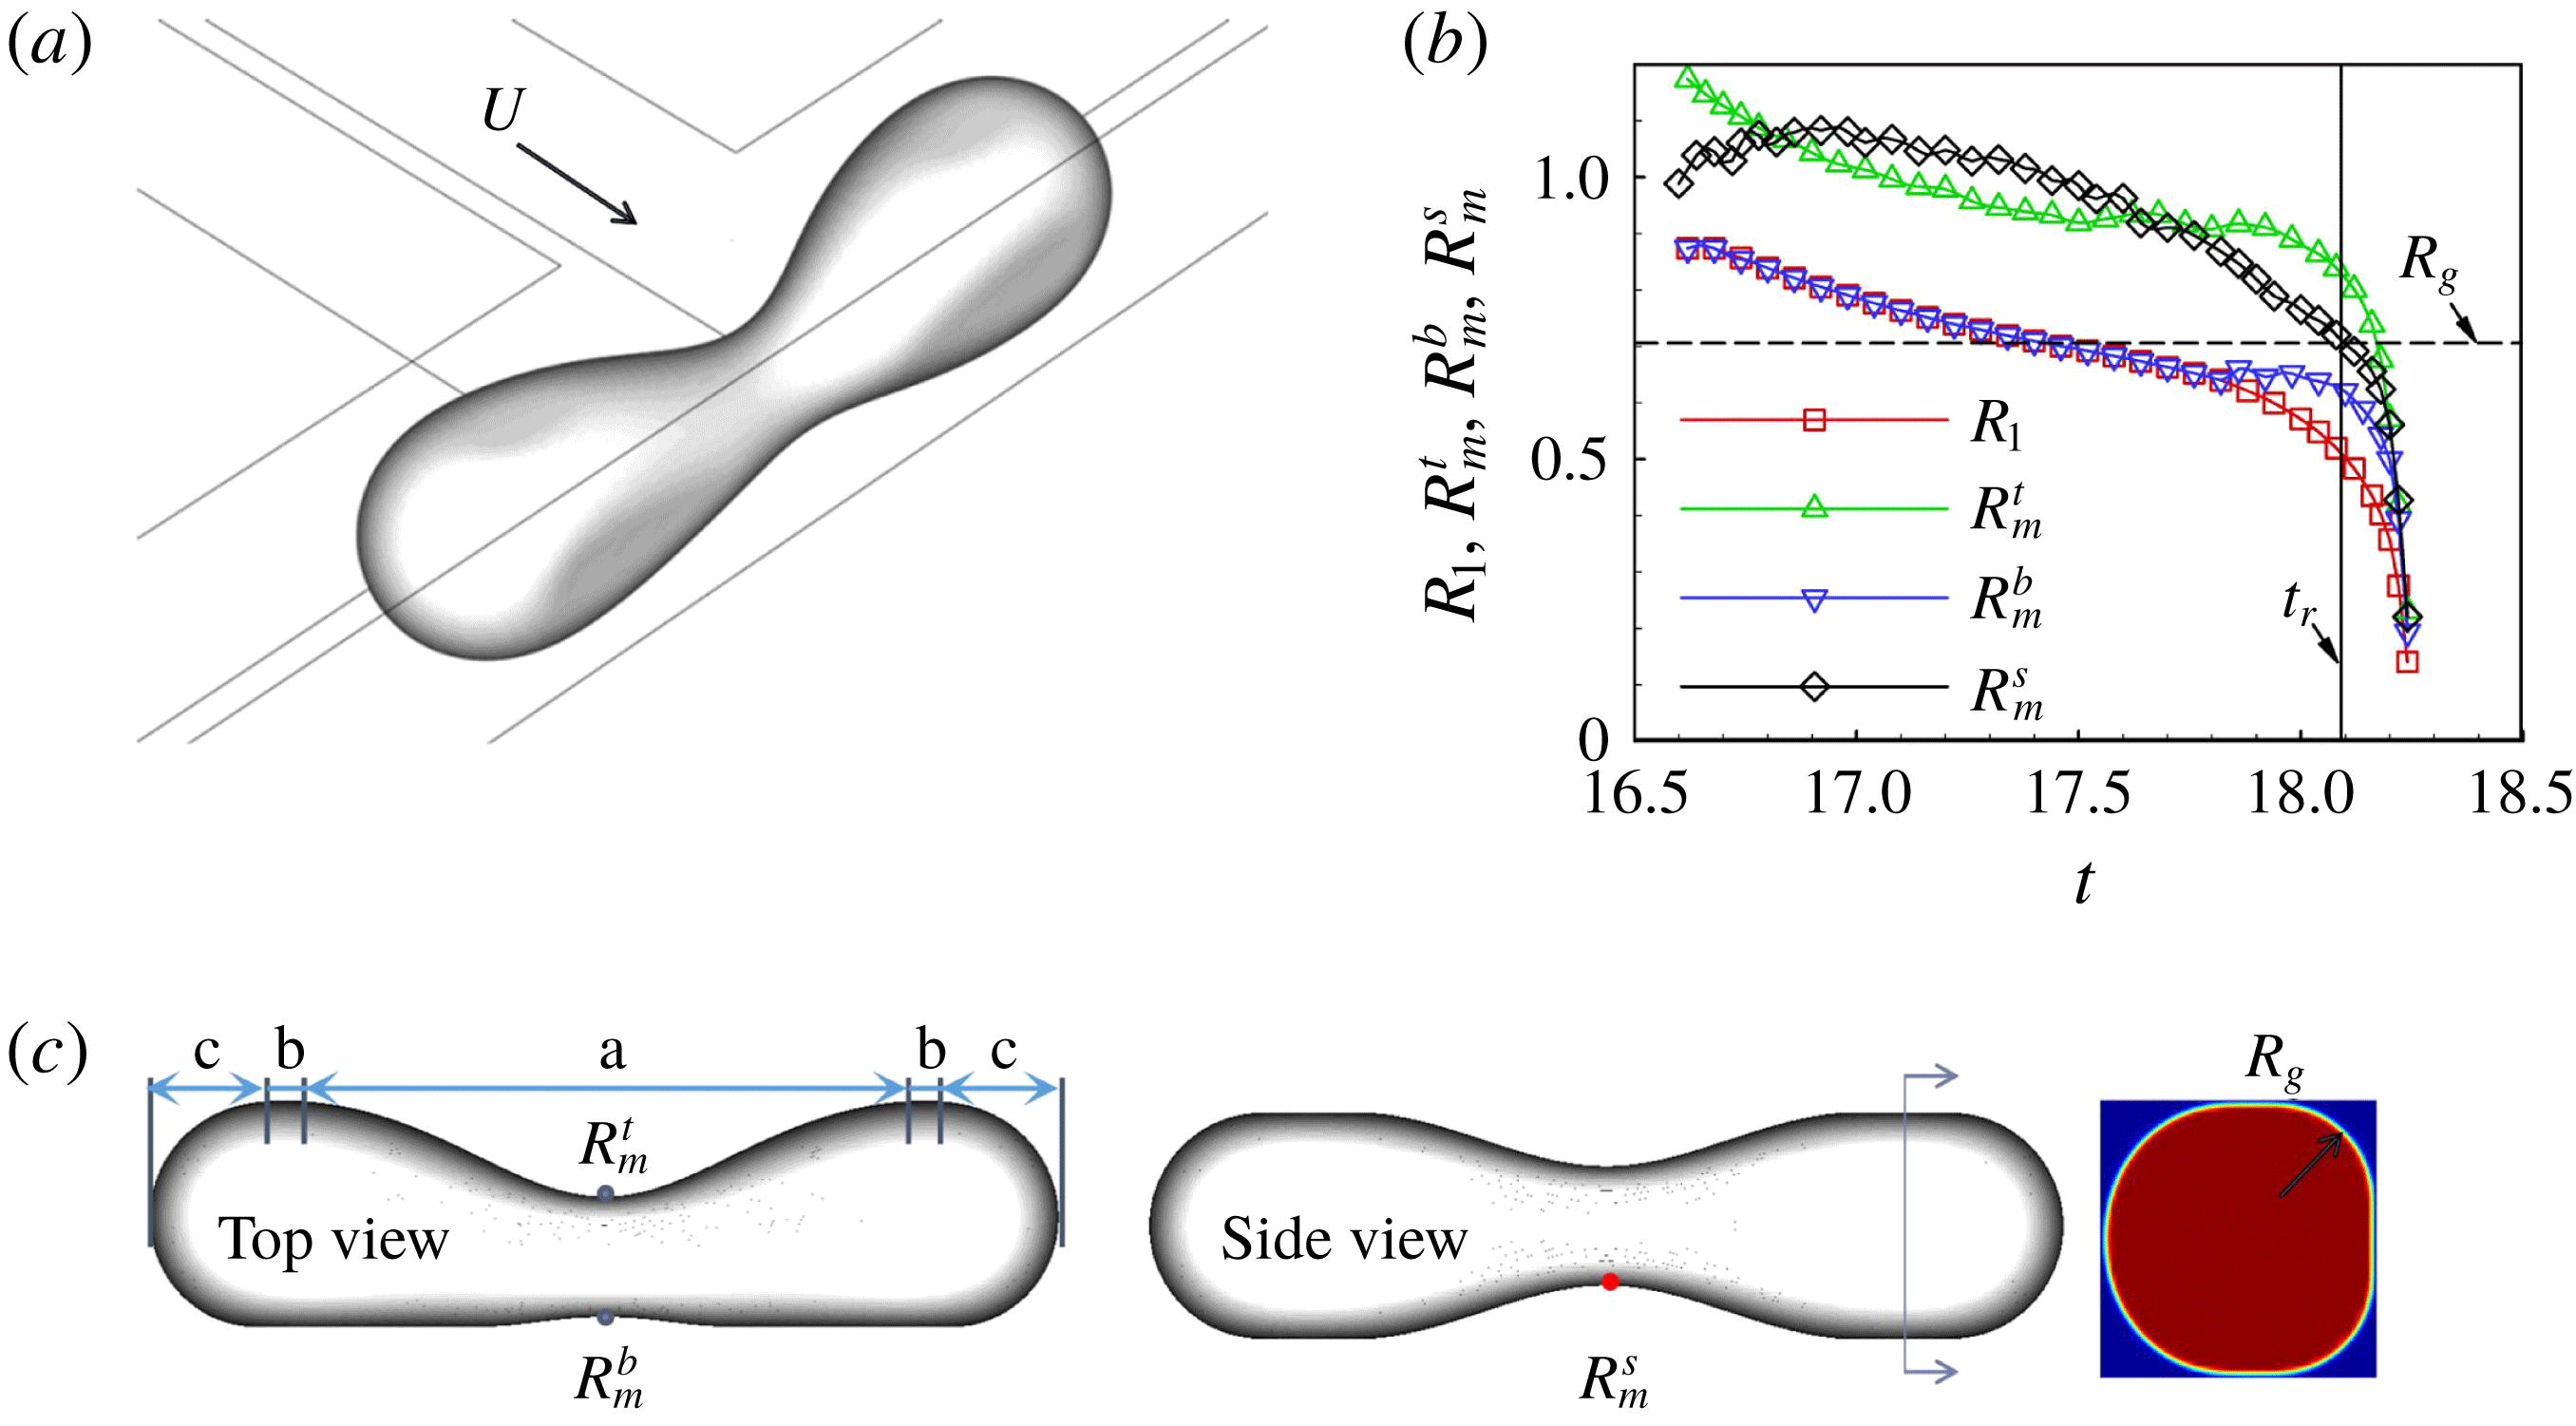
For another non-axisymmetric configuration, droplet breakup in a T-junction (as shown in figure 12
a), Hoang et al. (Reference Hoang, Portela, Kleijn, Kreutzer and van Steijn2013) stated that the autonomous breakup starts when the curvature at the neck becomes larger than the curvature everywhere else. The mechanism responsible for the autonomous breakup was believed to be similar to the end-pinching mechanism (Stone et al.
Reference Stone, Bentley and Leal1986). However, the end-pinching mechanism was proposed analytically to be a consequence of the motion generated via capillary pressure gradients in the region near the end of the droplet (Stone et al.
Reference Stone, Bentley and Leal1986), not via the competition of the curvatures that determines the capillary pressure. Meanwhile, Hoang et al. (Reference Hoang, Portela, Kleijn, Kreutzer and van Steijn2013) obtained a simple relation between the critical neck thickness (twice the
 $R_{1}$
defined here) for autonomous breakup and the height-to-width ratios of the rectangular channels. Since the relation was the same as that for the cross-flowing configuration, Hoang et al. (Reference Hoang, Portela, Kleijn, Kreutzer and van Steijn2013) suggested that the breakup mechanism was similar to the aforementioned backward-flow mechanism (van Steijn et al.
Reference van Steijn, Kleijn and Kreutzer2009). The breakup mechanism of droplet breakup in a T-junction is thus still unclear. The accuracy is also questionable when using
 $R_{1}$
to represent the neck shape.
Droplet breakup in a T-junction. (a) The schematic diagram of the simulation set-up. (b) The time evolution of the radii for
 $Ca=6.2\times 10^{-4}$
. (c) The critical droplet shape determined by stop-flow methods.

We revisit droplet breakup in a T-junction through numerical simulations. The geometrical set-up is shown in figure 12(a), where a T-junction comprises two square microchannels. The oil phase flows with a velocity
 $U$
into the T-junction from one channel to deform a confined water droplet at the centre of the T-junction. The fluid properties are the same as those for the axisymmetric simulations in § 3.1 and
 $H$
of the square channels is 30
 $\unicode[STIX]{x03BC}$
m. Both the fluid properties and geometrical parameters are identical to those in previous experimental (Link et al.
Reference Link, Anna, Weitz and Stone2004; Jullien et al.
Reference Jullien, Ching, Cohen, Menetrier and Tabeling2009) and numerical (Hoang et al.
Reference Hoang, Portela, Kleijn, Kreutzer and van Steijn2013) studies. Figure 12(b) depicts the evolutions of
 $R_{1}$
and the three mean radii at three key positions of the neck centre under
 $Ca=6.2\times 10^{-4}$
. As indicated in figure 12(c), the three mean radii are the top and bottom mean radii from the top view,
 $R_{m}^{t}$
and
 $R_{m}^{b}$
, and the mean radius from the side view,
 $R_{m}^{s}$
. Owing to the asymmetric flow, the three radii are not equal.
 $R_{m}^{t}$
is larger than
 $R_{m}^{b}$
since the oil flow compresses the droplet from the top. Figure 13(a) shows the evolutions of the droplet profiles on the longitudinal symmetry plane and the cross-section across the neck centre. As the profiles have the same time interval, a rapid change of the neck profile is observed close to the final breakup. The profiles of the cross-section are circles which are nearly concentric.
Evolutions of droplet profiles on the longitudinal symmetry plane and the cross-section across the neck centre, during the breakup under
 $Ca=6.2\times 10^{-4}$
, when flow stops just before (b) and after (c) the critical moment.

Stop-flow simulations are carried out to obtain the critical neck shape as shown in figure 12(c).
 $R_{1}$
at the critical moment
 $t_{r}$
is found to be approximately
 $0.52(H/2)$
, agreeing with
 $0.53(H/2)$
in Hoang et al. (Reference Hoang, Portela, Kleijn, Kreutzer and van Steijn2013). Non-negligible distinctions between
 $R_{1}$
and the three mean radii at
 $t_{r}$
are observed in figure 12(b), indicating that it is not accurate to use
 $\unicode[STIX]{x1D70E}/R_{1}$
to represent the capillary pressure. The evolutions of the droplet profiles when the flow is stopped just before and after
 $t_{r}$
are shown in figures 13(b) and 13(c), respectively. When the flow is stopped just before
 $t_{r}$
, the neck centre moves towards the oil inlet. After the neck centre reaches the centre of the channel, the neck shape becomes nearly axisymmetric and expands slowly owing to the leakage of the oil phase from the corners. When the flow is stopped just after
 $t_{r}$
, the motion of the interface at the neck centre couples both the motion towards the oil inlet and the collapse motion towards the neck centre. The profiles on the cross-section show a consistent decrease of
 $R_{1}$
. The upper profile on the longitudinal symmetry plane moves towards the oil inlet first and then collapses towards the neck centre. The motion towards the oil inlet indicates that, after the oil flow is stopped, the internal pressure inside the neck turns to push the upper interface outward to stabilize the interface. Naturally, the shape of the upper interface cannot be expected to represent the critical neck shape.
The abovementioned breakup mechanism for a fluid thread in the cross-flowing configuration inspires us to look into the internal pressure of a droplet in a rectangular channel. For a static non-wettable long fluid thread in a rectangular channel, the internal pressure of the droplet is
 $\unicode[STIX]{x1D70E}/R_{m}^{un}$
, where
 $R_{m}^{un}$
is the mean radius of the unconfined droplet interface, including the droplet tips and corner interface at the columnar region (Wong, Radke & Morris Reference Wong, Radke and Morris1995).
 $R_{m}^{un}$
at the corner interface reduces to the radius of the circular arcs
 $R_{g}$
in the cross-section of the columnar region. Utilizing this geometrical feature, Wong et al. (Reference Wong, Radke and Morris1995) developed an explicit solution of
 $R_{g}$
for a static non-wettable long fluid thread under
 $Ca\rightarrow 0$
, i.e.
 $$\begin{eqnarray}\displaystyle R_{g}^{st}=\unicode[STIX]{x1D706}H/[1+\unicode[STIX]{x1D706}+[(1-\unicode[STIX]{x1D706})^{2}+\unicode[STIX]{x03C0}\unicode[STIX]{x1D706}]^{1/2}], & & \displaystyle\end{eqnarray}$$
where
 $\unicode[STIX]{x1D706}$
is the ratio of the channel width
 $W$
and height
 $H$
. For the square channel here,
 $\unicode[STIX]{x1D706}=1$
and
 $R_{g}^{st}\approx 0.53(H/2)$
. Under a finite
 $Ca$
, the interface is altered by the droplet motion and the corner flow around the droplet to divide the mean radius from
 $R_{g}^{st}$
(Wong et al.
Reference Wong, Radke and Morris1995). We then quantify the internal pressure by measuring
 $R_{g}$
from the cross-section of the columnar region in figure 12(c). Due to the asymmetry of the flow-field,
 $R_{g}$
at the left two corners are larger than those at the right two corners. The smaller
 $R_{g}$
at the right corners thus determines the internal pressure through a higher capillary pressure. Here
 $R_{g}$
stays constant during the breakup and is measured to be approximately
 $0.71(H/2)$
. When
 $R_{g}$
is indicated on figure 12(b) with a dashed line, we find that it is approximately equal to
 $R_{m}^{s}$
at
 $t_{r}$
,
 $(0.70\pm 0.02)(H/2)$
. The equality relation of the critical
 $R_{m}^{s}$
and
 $R_{g}$
indicates essentially the same breakup mechanism as for the abovementioned fluid threads in a cross-flowing condition. Again, the fluid thread becomes unstable when the capillary pressure at the neck centre balances the internal pressure, which occurs here, only at parts of the neck interface due to the asymmetric flow under a finite
 $Ca$
.
3.4 Critical droplet lengths for obstructed breakup
The above analyses show that the critical conditions for the onset of capillary instability for small
 $Ca$
numbers are geometrical for confined fluid threads. This finding is consistent with previous experimental studies (Link et al.
Reference Link, Anna, Weitz and Stone2004; Jullien et al.
Reference Jullien, Ching, Cohen, Menetrier and Tabeling2009) on droplet breakup in a T-junction. Jullien et al. (Reference Jullien, Ching, Cohen, Menetrier and Tabeling2009) classified the droplet dynamics into non-breakup, non-obstructed breakup, and obstructed (or blocked) breakup. For obstructed breakup, the droplet touches the walls of the T-junction, i.e. droplets keep obstructing the T-junction before breakup. For non-breakup and non-obstructed breakup, there is a tunnel between the droplet and the wall. A droplet shorter than a
 $Ca$
-dependent length opens a tunnel on one side of the junction by a random disturbance, and eventually moves in the opposite direction without breakup. A longer droplet can break under the non-obstructed condition. When
 $Ca$
is low enough, the non-obstructed breakup cannot happen. Jullien et al. (Reference Jullien, Ching, Cohen, Menetrier and Tabeling2009) identified experimentally that there exists a critical initial droplet length,
 $L_{cr}$
. For a droplet with a length larger than
 $L_{cr}$
, obstructed breakup happens, independent of
 $Ca$
. Inspired by this finding, we predict
 $L_{cr}$
based on the critical neck shape from the stop-flow simulations as shown in figure 12(c). The critical droplet shape from the top view in figure 12(c) can be divided into five regions: the neck region (a), two plug-shaped regions (b) and two hemispherical head-ends (c). For different initial droplet lengths, neither the critical shape of the neck region nor the shape of the head-ends changes. The shortest breakable droplet should thus have a volume that comprises only those of the neck region and two head-ends. A shorter droplet cannot reach the critical neck shape for obstructed breakup since the volume is not large enough to reach the critical neck shape for breakup. According to the critical droplet shape in figure 12(c),
 $L_{cr}$
is calculated by subtracting the length of the two plug-shaped regions from the length of the initial droplet to give approximately
 $3.07H$
. This length is close to
 $\unicode[STIX]{x03C0}H$
, which is used by Link et al. (Reference Link, Anna, Weitz and Stone2004) to predict the boundary between no breakup and breakup according to the R–P stability criterion for the same combination of fluids. Jullien et al. (Reference Jullien, Ching, Cohen, Menetrier and Tabeling2009) found that
 $L_{cr}$
is altered by the viscosity ratio of the dispersed and continuous phases, and is
 $2.62H$
and
 $4.20H$
for a viscosity ratio of 0.11 and 1.67, respectively. For the fluids considered here, the viscosity ratio is approximately 0.13. The
 $L_{cr}$
obtained is thus consistent with the experimental study of Jullien et al. (Reference Jullien, Ching, Cohen, Menetrier and Tabeling2009). It is likely that the viscosity ratio influences the critical shape through the asymmetric flow field around the neck and the leakage flow at the corners.
Similarly,
 $L_{cr}$
for the axisymmetric configuration in figure 1(a) can be determined theoretically (corresponding to the critical
 $R_{m}=0.71R$
) to be approximately
 $4.52R$
or
 $2.26D$
(with the diameter
 $D=2R$
). Simulations with different initial droplet lengths are carried out for
 $Ca=2.0\times 10^{-4},2.0\times 10^{-5}$
and
 $2.0\times 10^{-6}$
to find
 $L_{cr}$
for the obstructed breakup. Different from the simulations in figure 1, that consider the obstructed breakup using only a quarter of the cross-section of the configuration, half of the cross-section is used here to consider the situations of non-breakup and non-obstructed breakup (see the supplementary material for the schematic of the computational domain). All three types of droplet dynamics are obtained for
 $Ca=2.0\times 10^{-4}$
, but only non-breakup and obstructed breakup are observed for
 $Ca$
of
 $2.0\times 10^{-5}$
and
 $2.0\times 10^{-6}$
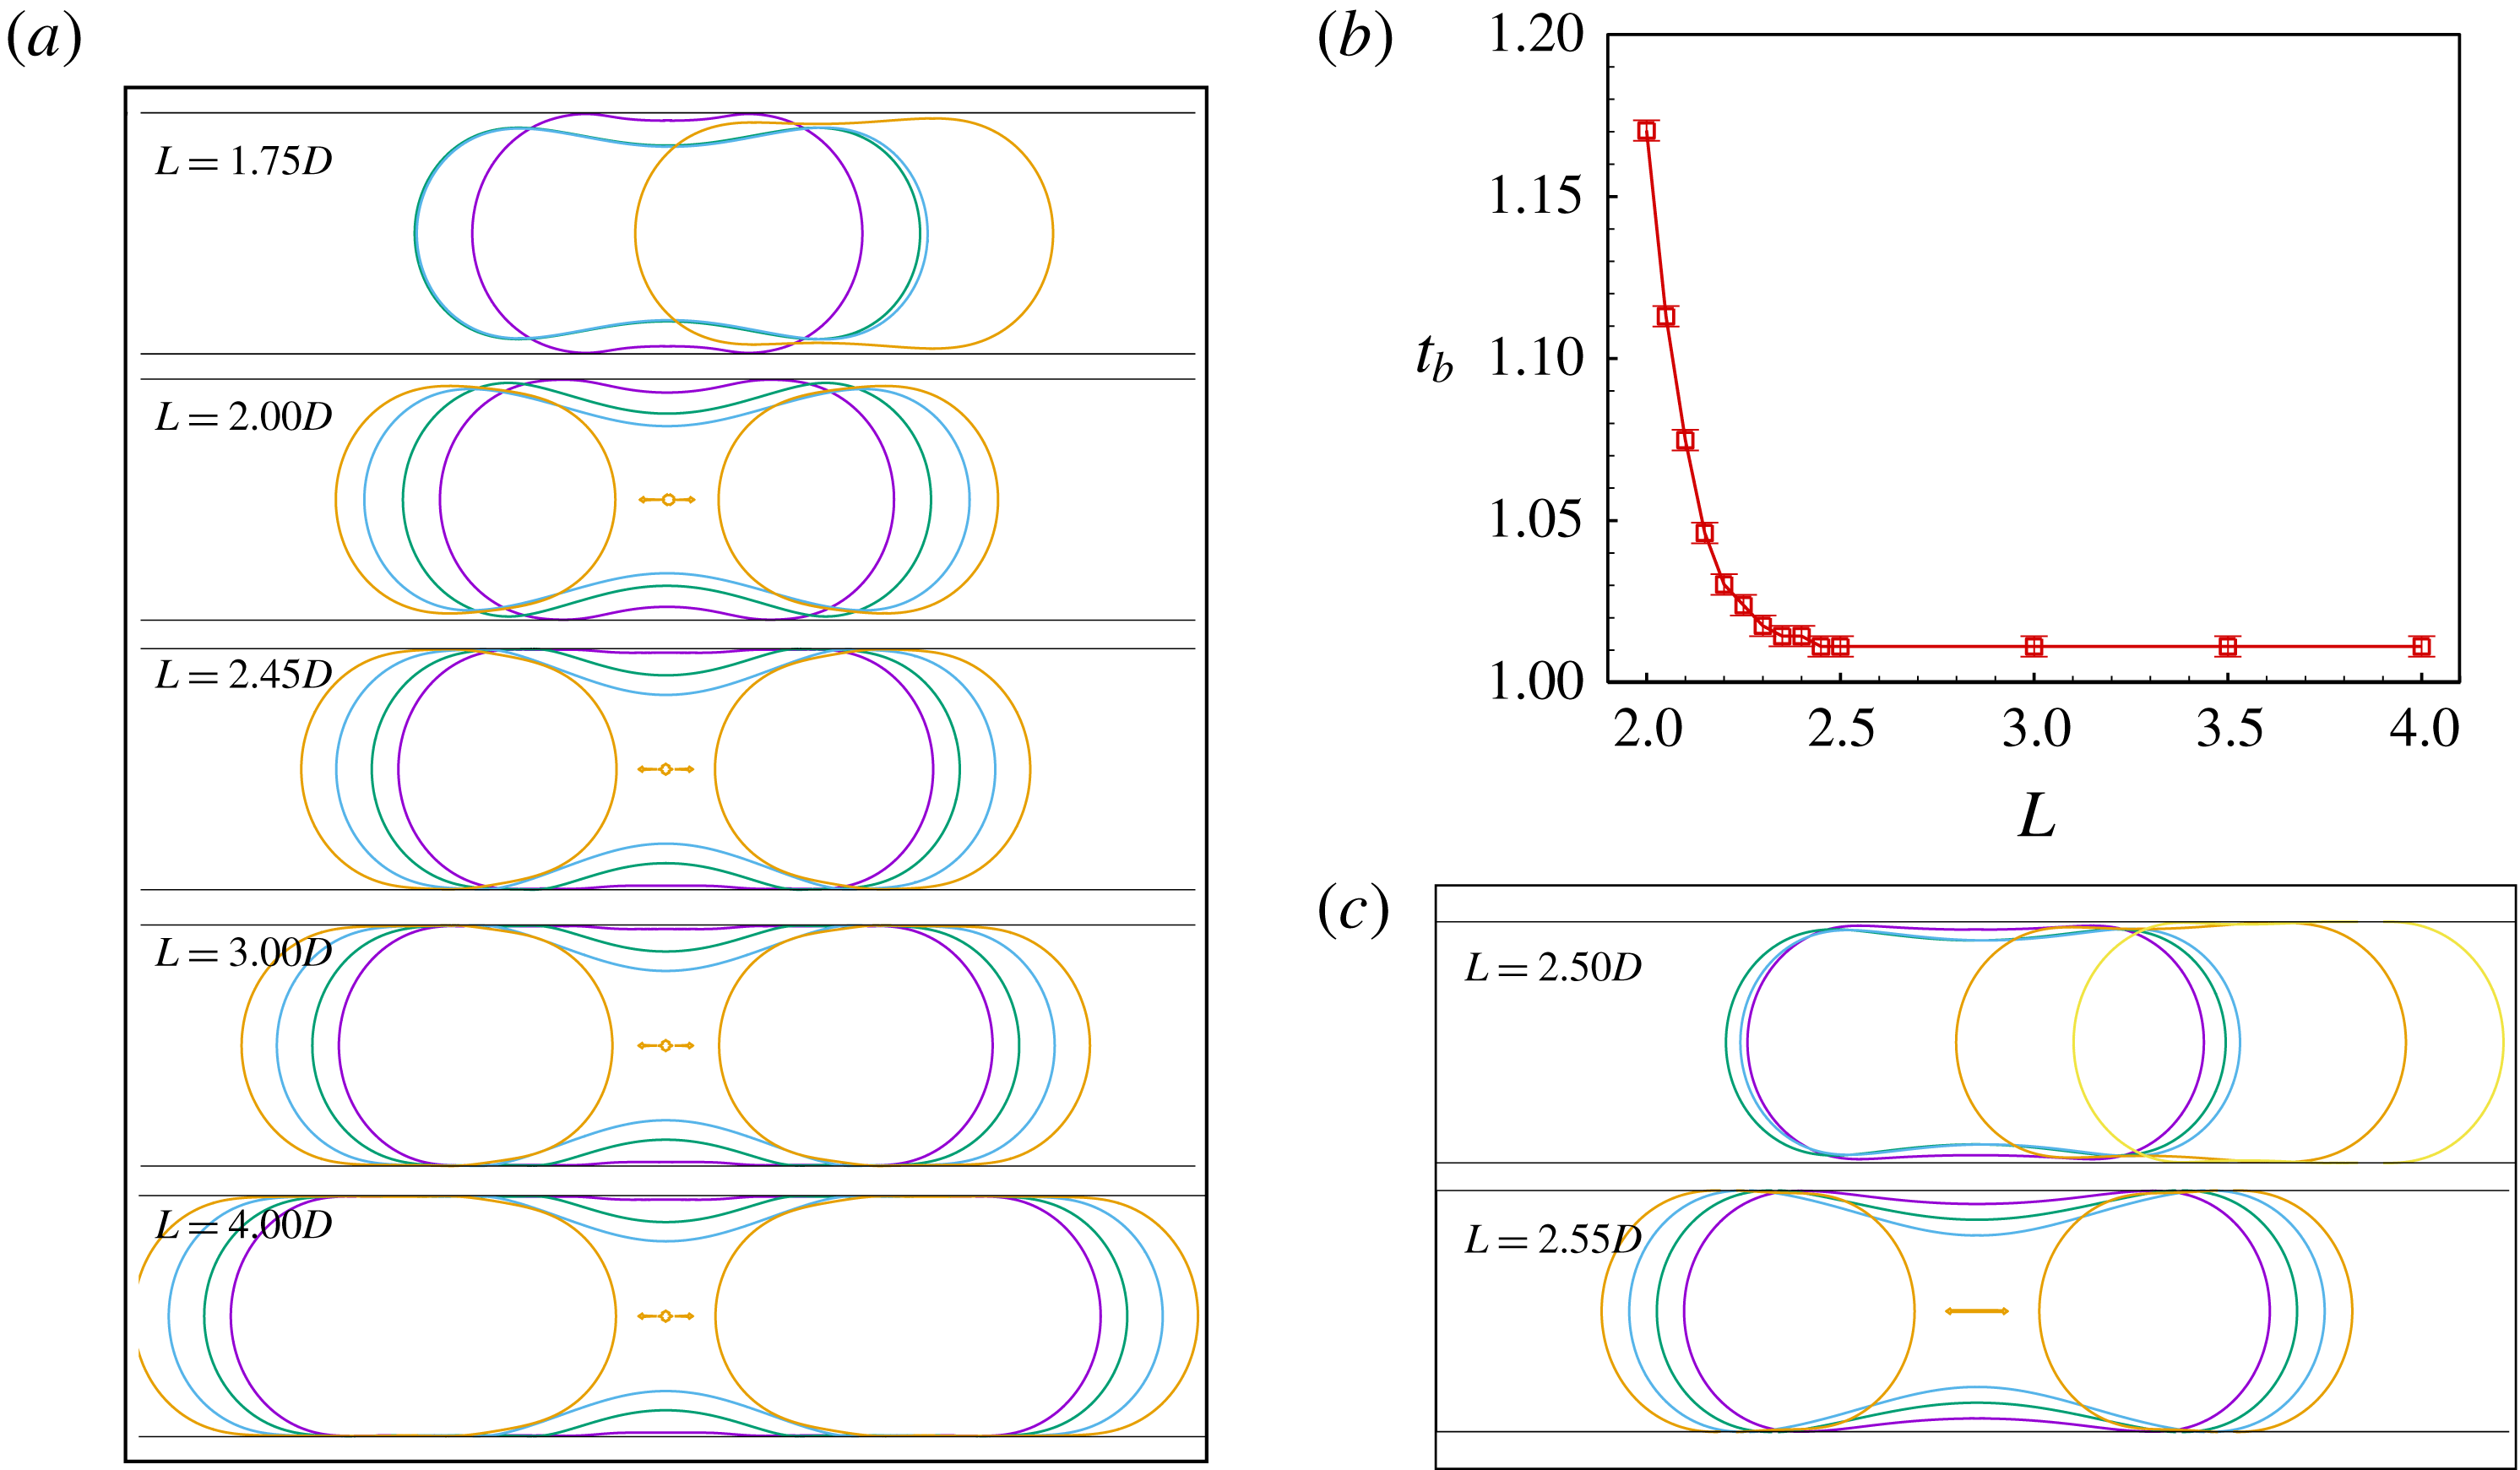
. Figure 14(a) shows the droplet dynamics for
 $Ca=2.0\times 10^{-4}$
under different initial droplet length
 $L$
. When
 $L=1.75D$
, the neck region cannot reach the critical shape for breakup. The droplet moves to one side due to the asymmetric flow outside the neck surface. When
 $L=2.00D$
, the droplet breaks with a tunnel between the interface and the wall. When the tunnel vanishes, the neck evolutions are obviously the same for
 $L=2.45D$
,
 $3.00D$
and
 $4.00D$
. Previous experiments (Jullien et al.
Reference Jullien, Ching, Cohen, Menetrier and Tabeling2009) distinguished non-obstructed breakup and obstructed breakup by the width of the opening tunnel. If the width was below the optical resolution, the breakup was classified as the obstructed one. Our work is different in that we use the time period required for breakup
 $t_{b}$
to distinguish these two types of breakup. Figure 14(b) shows that
 $t_{b}$
decreases with
 $L$
but then shows independence of
 $L$
. The physical reason for the independence is that, when the droplet length is large enough to cause obstructed breakup, the shape revolution at the neck region will not be affected by
 $L$
.
 $L_{cr}$
for
 $Ca=2.0\times 10^{-4}$
is thus obtained from figure 14(b) to be approximately
 $2.43D$
. This value is in agreement with the theoretical prediction of
 $2.26D$
. The difference between the theoretical and numerical predictions may be due to the disparities between the numerical and theoretical neck profiles near the joint of the neck region and the cylindrical region, as observed previously in figure 6(b). Figure 14(c) shows that the non-obstructed breakup vanishes as
 $Ca$
decreases to
 $2.0\times 10^{-5}$
.
 $L_{cr}$
for
 $Ca=2.0\times 10^{-5}$
and
 $2.0\times 10^{-6}$
are obtained directly from the boundary between non-breakup and obstructed breakup to be
 $2.53D$
and
 $2.68D$
, respectively.
 $L_{cr}$
thus increases only by approximately 10 % as
 $Ca$
decreases by two orders of magnitude. This slow variation of
 $L_{cr}$
with
 $Ca$
is roughly in agreement with the experimental observations for droplet breakup in a T-junction (Jullien et al.
Reference Jullien, Ching, Cohen, Menetrier and Tabeling2009), that
 $L_{cr}$
is independent of
 $Ca$
(in a range between
 $4\times 10^{-4}$
and
 $2\times 10^{-1}$
). As the variation of
 $L_{cr}$
with
 $Ca$
is related to the non-breakup situation, the flow through the tunnel between the droplet and the wall should be considered. The flow dynamics is beyond the scope of the present paper and will be considered in a future study.
(a) Three types of droplet dynamics, non-breakup, non-obstructed breakup, and obstructed breakup, for different
 $L$
under
 $Ca=2.0\times 10^{-4}$
. (b) Evolution of the breakup time with
 $L$
for
 $Ca=2.0\times 10^{-4}$
. (c) Two types of droplet dynamics, non-breakup and obstructed breakup, for different
 $L$
under
 $Ca=2.0\times 10^{-5}$
.

4 Concluding remarks
The present study highlights the essential role of capillarity and ultimately illuminates the two origins of capillary instability of confined fluid threads in microfluidic channels. Distinct from an unbounded fluid thread, a confined fluid thread is stabilized by its internal pressure and destabilized by the gradient of the capillary pressure induced by confinements or local capillary pressure that exceeds this internal pressure. The revealed mechanisms not only explain the underlying physics but also can be used to invent new configurations of microfluidic devices that can further improve the precision and efficiency of droplet/bubble generation.
Acknowledgements
This work was partly supported by the National Natural Science Foundation of China (grant nos 11772343, 11832017, 11572334 and 11402274), the CAS Key Research Program of Frontier Sciences (QYZDB-SSW-JSC036), the CAS Strategic Priority Research Program (XDB22040403) and the Beijing Institute of Technology Research Fund Program for Young Scholars.
Supplementary movies and material
Supplementary movies and material are available athttps://doi.org/10.1017/jfm.2019.426.