Introduction
Recent models of major depressive disorder (MDD) have suggested that aberrant neural activity at nexus sites in the rostral anterior cingulate cortex (rACC; Mayberg, Reference Mayberg1997, Reference Mayberg2003; Seminowicz et al. Reference Seminowicz, Mayberg, McIntosh, Goldapple, Kennedy, Segal and Rafi-Tari2004) and dorsomedial prefrontal cortex (dmPFC; Sheline et al. Reference Sheline, Price, Yan and Mintun2010; Zhou et al. Reference Zhou, Yu, Zheng, Liu, Song, Qin, Li and Jiang2010) may disrupt the integration of distributed cognitive and affective networks. Functional magnetic resonance imaging (fMRI) connectivity analyses have confirmed the importance of relative levels of activity within these distributed ventral and dorsal networks to states of acute MDD (Anand et al. Reference Anand, Li, Wang, Wu, Gao, Bukhari, Mathews, Kalnin and Lowe2005a; Greicius et al. Reference Greicius, Flores, Menon, Glover, Solvason, Kenna, Reiss and Schatzberg2007; Sheline et al. Reference Sheline, Price, Yan and Mintun2010; Zhou et al. Reference Zhou, Yu, Zheng, Liu, Song, Qin, Li and Jiang2010) and remission from these states (Anand et al. Reference Anand, Li, Wang, Wu, Gao, Bukhari, Mathews, Kalnin and Lowe2005b), while evidence across modalities indicates that the putative nexus sites are not only are dynamically involved in this change (Buchsbaum et al. Reference Buchsbaum, Wu, Siegel, Hackett, Trenary, Lennert and Reynolds1997; Mayberg et al. Reference Mayberg, Brannan, Mahurin, Jerabek, Brickman, Tekell, Arturo Silva, McGinnis, Glass, Martin and Fox1997; Kennedy et al. Reference Kennedy, Evans, Krüger, Mayberg, Meyer, McCann, Arifuzzman, Houle and Vaccarino2001) but also may be predictive of it (Mayberg et al. Reference Mayberg, Brannan, Mahurin, Jerabek, Brickman, Tekell, Arturo Silva, McGinnis, Glass, Martin and Fox1997; Wu et al. Reference Wu, Buchsbaum, Gillin, Tang, Cadwell, Wiegand, Najafi, Klein, Hazen and Bunney1999; Kennedy et al. Reference Kennedy, Evans, Krüger, Mayberg, Meyer, McCann, Arifuzzman, Houle and Vaccarino2001; Pizzagalli et al. Reference Pizzagalli, Pascual-Marqui, Nitschke, Oakes, Larson, Abercrombie, Schaefer, Koger, Benca and Davidson2001).
Within acute-state MDD, extensive resting-state positron emission tomography (PET) studies have tended to indicate hypoactive dorsal PFC and rACC metabolism that normalizes upon immediate remission (reviewed in Davidson et al. Reference Davidson, Pizzagalli, Nitschke and Putnam2002; Fitzgerald et al. Reference Fitzgerald, Oxley, Laird, Kulkarni, Egan and Daskalakis2006; Drevets et al. Reference Drevets, Price and Furey2008). Task-based fMRI studies have shown dorsal PFC regions to be either hypoactive during emotional tasks (e.g. Siegle et al. Reference Siegle, Thompson, Carter, Steinhauer and Thase2007) or hyperactive during reappraisal (e.g. Lemogne et al. Reference Lemogne, le Bastard, Mayberg, Volle, Bergouignan, Lehéricy, Allilaire and Fossati2009) or working memory tasks (e.g. Harvey et al. Reference Harvey, Fossati, Pochon, Levy, Lebastard, Lehéricy, Allilaire and Dubois2005). Hypoactive executive control over emotion at dorsal PFC sites has also been linked to hypoactive rACC function (e.g. Siegle et al. Reference Siegle, Thompson, Carter, Steinhauer and Thase2007), which may more proximally mediate the disrupted emotion regulation of ventral, limbic areas in acute MDD. Conversely, abnormal frontally generated, error-related negativity (ERN) localized to the region of the rACC (Alexopoulos et al. Reference Alexopoulos, Murphy, Gunning-Dixon, Kalayam, Katz and Kanellopoulos2007; Chiu & Deldin, Reference Chiu and Deldin2007) has been linked to subsequent failure to recruit more dorsal cognitive control regions (Holmes & Pizzagalli, Reference Holmes and Pizzagalli2007, Reference Holmes and Pizzagalli2008).
In contrast to this relatively detailed picture of the acute state and despite evidence that MDD is a predominately recurrent disorder (Judd, Reference Judd1997), neuroimaging studies in well-established remission/recovery are rare. Available remitted-state evidence suggests persisting aberrant brain activity within the dmPFC and the rACC, with additional links to relapse/recurrence from short-term manipulations during PET, including amine depletion studies (Bremner et al. Reference Bremner, Innis, Salomon, Staib, Ng, Miller, Bronen, Krystal, Duncan, Dayton, Lawrence, Malison, Holley, Soufer and Charney1997, Reference Bremner, Vythilingam, Ng and Vermetten2003; Neumeister et al. Reference Neumeister, Nugent, Waldeck, Geraci, Schwarz, Bonne, Bain, Luckenbaugh, Herscovitch, Charney and Drevets2004) and sad mood induction (Liotti et al. Reference Liotti, Mayberg, McGinnis, Brannan and Jerabek2002), showing decreased resting-state activity in regions of the PFC following symptom induction (Bremner et al. Reference Bremner, Innis, Salomon, Staib, Ng, Miller, Bronen, Krystal, Duncan, Dayton, Lawrence, Malison, Holley, Soufer and Charney1997, Reference Bremner, Vythilingam, Ng and Vermetten2003; Liotti et al. Reference Liotti, Mayberg, McGinnis, Brannan and Jerabek2002) but with some evidence of increased baseline resting-state medial PFC/rACC activity in relapse/recurrence-prone patients (Bremner et al. Reference Bremner, Innis, Salomon, Staib, Ng, Miller, Bronen, Krystal, Duncan, Dayton, Lawrence, Malison, Holley, Soufer and Charney1997, Reference Bremner, Vythilingam, Ng and Vermetten2003). Outside of symptom induction studies, the finding of increased dorsal PFC-mediated cognitive control during a 30-s fMRI block-design expression-matching task (Norbury et al. Reference Norbury, Selvaraj, Taylor, Harmer and Cowen2010) contrasts with event-related potential (ERP) evidence during executive function of diminished ability to mount effortful frontal cognitive control, including reduced N450 (Vanderhasselt & De Raedt, Reference Vanderhasselt and De Raedt2009; Georgiadi et al. Reference Georgiadi, Liotti, Nixon and Liddle2011); an apparent inconsistency that might be explained through temporal variance in the neural correlates of cognitive control.
Currently, however, there are no event-related neuroimaging studies providing data on the immediate neural correlates of executive function in remitted-state MDD; and although remitted-state PET studies (Bremner et al. Reference Bremner, Innis, Salomon, Staib, Ng, Miller, Bronen, Krystal, Duncan, Dayton, Lawrence, Malison, Holley, Soufer and Charney1997, Reference Bremner, Vythilingam, Ng and Vermetten2003; Liotti et al. Reference Liotti, Mayberg, McGinnis, Brannan and Jerabek2002) raise questions about whether areas proximate to the identified nexus sites (Mayberg et al. Reference Mayberg, Brannan, Mahurin, Jerabek, Brickman, Tekell, Arturo Silva, McGinnis, Glass, Martin and Fox1997; Sheline et al. Reference Sheline, Price, Yan and Mintun2010) play a role in vulnerability to MDD, these have not been tested through targeted studies. The recognition of these gaps in research has included calls for more longitudinal mapping of key PFC areas in MDD (Sheline et al. Reference Sheline, Price, Yan and Mintun2010), and for prospective data that might help to identify differences in vulnerability within patient groups ‘during continuation or maintenance treatments’ (Mayberg, Reference Mayberg2007, p. 729).
Motivated by salient gaps in the literature, we conducted a targeted region of interest (ROI) analysis assessing the role of the dmPFC [Brodmann area (BA) 9] and the rACC (BA 24/32) in vulnerability to MDD through a main analysis comparing remitted-state, high predicted recurrence-risk MDD patients to controls; testing the hypothesis that baseline event-related activity within the ROIs would significantly differentiate the predicted high-vulnerability patients from controls. To give as full an account as possible of vulnerability within MDD, we also conducted a subsidiary follow-up analysis assessing baseline ROI activity against observed recurrence during a 1-year follow-up, hypothesizing that baseline ROI activity would significantly differentiate the observed high-vulnerability recurrence group from the observed low-vulnerability group and controls. Based on clinical evidence (Maj et al. Reference Maj, Veltro, Pirozzi, Lobrace and Magliano1992; Ramana et al. Reference Ramana, Paykel, Cooper, Hayhurst, Saxty and Surtees1995) we estimated a 40% 1-year recurrence rate in our patient population and in the secondary, more exploratory analysis we aimed to investigate both task-related activity and delayed effects of task observable in post-event processing (i.e. functional activity observable during correct baseline events immediately following our primary events of interest). As the dmPFC and rACC have been shown to become functionally active during error commission (EC) and negative feedback (reviewed in Ridderinkhof et al. Reference Ridderinkhof, Ullsperger, Crone and Nieuwenhuis2004), experiences long hypothesized as having particular importance within cognitive vulnerability–stress models of MDD (Beck, Reference Beck1987; Abramson et al. Reference Abramson, Metalsky and Alloy1989), we developed an executive function paradigm aimed at generating blood oxygen level-dependent (BOLD) correlates of EC and incorporating negative feedback. Our ROIs were centred on the nexus sites identified in the literature discussed earlier: the rACC (BA 24/32: Talairach x = 1, y = 44, z = 10) (Mayberg et al. Reference Mayberg, Brannan, Mahurin, Jerabek, Brickman, Tekell, Arturo Silva, McGinnis, Glass, Martin and Fox1997); and the more recently identified dmPFC nexus (BA 9: Talairach x = 18, y = 34, z = 29) (Sheline et al. Reference Sheline, Price, Yan and Mintun2010).
Method
Clinical
Patients were recruited through physician referral from general adult psychiatric clinics in Nottingham, UK. Controls were mainly recruited through posters displayed at a General Hospital and a community surgery in Nottingham. Following complete description of the study, written, informed, capacitous consent was given by all participants. The study was approved by the Local Research Ethics Committee and was compliant with the Code of Ethics of the World Medical Association (Declaration of Helsinki).
All potential recruits underwent an initial psychiatric assessment by senior clinical psychiatrists (N.L.N., G.W. and P.F.L.), including a detailed history of personal and family psychiatric/medical disorder, use of any current/past medication and any drug or alcohol problems; followed by the Structured Clinical Interview for DSM-IV Axis I Disorders (SCID; First et al. Reference First, Spitzer, Gibbon and Williams1997); two measures of depressive symptoms, the 17-item Hamilton Depression Rating Scale (HAMD; Hamilton, Reference Hamilton1960) and the Beck Depression Inventory –II (BDI-II; Beck et al. Reference Beck, Steer, Ball and Ranieri1996); two measures of personality, the Short Eysenck Personality Ques tionnaire – Revised (EPQ-R; Eysenck & Eysenck, Reference Eysenck and Eysenck1991) and the Personality Disorders Questionnaire, 4th Edition Plus (PDQ-4 + ; Hyler, Reference Hyler1994); a measure of IQ, the Ammons Quick Test (QT; Ammons & Ammons, Reference Ammons and Ammons1962); a measure of cognitive function, the Folstein Mini-Mental State Examination (MMSE; Folstein et al. Reference Folstein, Folstein and McHugh1975); the Edinburgh Handedness Inventory (EHI;Oldfield, Reference Oldfield1971); and an fMRI safety questionnaire.
A clinical consensus meeting followed initial screening to determine inclusion/exclusion. Minimum inclusion for the patient group required at least two previous episodes of DSM-IV major depression, diagnosed through the SCID, now in sustained remission/recovery (with normalized function for at least 3 months and a 17-item HAMD score <8). Exclusion criteria were co-morbid Axis I psychiatric disorder (with particular care to exclude bipolar II disorder and anxiety disorders); personality disorder; drug/alcohol disorder; untreated medical disorder; any previous or current central nervous system (CNS) disease; or fMRI safety issues. In addition to these criteria, potential controls were excluded if there was evidence of current or past psychiatric disorder.
Patients were followed up over 1 year for evidence of recurrence, determined through use of the SCID at 4-month intervals combined with clinical data from case-notes and treating clinicians.
Image acquisition
Imaging data were acquired in all subjects at baseline, using a Phillips 3-T scanner and standardized preparation aimed at minimizing performance variance and anxiety (including scripted explanation, practice sessions of the task and habituation within the scanner). The imaging sequence comprised: T1 image acquisition; T2* image stabilization; T2* data acquisition (using gradient echo–echo planar imaging collecting 252 volumes of 36 slices, image matrix 64 × 64, voxel size 3 mm × 3 mm × 3 mm, field of view 19.2 cm, echo time 40 ms and repetition time 2300 ms) during two separate 10-min trials of a Go/No-Go (GNG) task with visual negative feedback (VNF). Go (x) or No-Go (k) stimuli were projected for 266 ms using white letters on a black screen with an inter-stimulus interval (jittered and pseudo-random) between 3100 and 3700 ms, so that each subject had 159–160 stimuli per block, of which 32–33 were ‘k’ and the remainder ‘x’; subjects were asked to respond as quickly as possible to ‘x’ stimuli by a single button-press and to withhold response to ‘k’ stimuli. The VNF component ‘Too Slow’ was projected for 266 ms using white letters on a black screen 1015 ms after correct but late responses, with maximum allowed response times (ceilings) set individually, derived from response times during a final pre-scanning GNG trial (aimed at increasing pre-potency of the Go response and producing a minimum 20% errors). Apart from ‘Too Slow’, no other type of feedback was used during this experiment. The following events were coded separately: correct, within-time, response to ‘x’ as ‘correct hit’ (CH); correct but late response to ‘x’ stimulus associated with presentation of ‘Too Slow’ as ‘visual negative feedback’ (VNF); non-response as ‘miss’ (MISS); double button-press as ‘double press’ (DP); incorrect button-press response following ‘k’ stimulus as ‘error commission’ (EC); and correctly withheld response to ‘k’ stimulus as ‘correct reject’ (CR).
Image analysis
First-level analysis
PAR/REC format data from the 3-T Philips system were converted to Analyze format using MRIcro (www.mricro.com). The converted images were then analysed using SPM5 (www.fil.ion.ucl.ac.uk/spm). Images were preprocessed by reorienting, slice timing, spatial realignment, co-registration, segmentation, normalization and smoothing to 8 mm. Events of interest were modelled as stick functions corresponding to response times for CH, EC and VNF, with movement parameters modelled as regressors of no interest. Contrasts of interest compared EC against baseline (EC > CH) and VNF against baseline (VNF > CH). To identify any persistence of BOLD effect into the subsequent trial in the recurrence analysis, we conducted an additional post-event comparison of two contrasts of interest: ‘post-error commission’ [CH following EC (pEC-CH) > CH following CH (pCH-CH)] and ‘post-visual negative feedback’ [CH following VNF (pVNF-CH) > pCH-CH)].
Second-level main analysis design
Single subject contrasts of interest obtained for EC > CH and VNF > CH were entered into t tests modelling age and engagement in task (as indexed by within-task slowing following EC) as covariates of no interest. Positive effect of condition for EC > CH and VNF > CH was assessed at whole-brain level against published findings, following which two-group t tests compared patient and control groups. Finally, to assess potential medication effects of maintenance-phase treatment, single subject contrasts of interest (EC > CH and VNF > CH) were entered into separate one-factor analyses of variance (ANOVAs) with three levels (groups): unmedicated patients, medicated patients and controls, using the same covariates of no interest.
Second-level subsidiary analysis design
On completion of follow-up, patients were assigned to group (dependent on presence of recurrence within 1 year) and single subject contrasts of interest for EC > CH, VNF > CH, pEC-CH > pCH-CH and pVNF-CH > pCH-CH were entered into separate one-factor ANOVAs with three levels (groups), recurrence, non-recurrence and control, modelling covariates of no interest as in the main analysis with an additional covariate for medication status. The main effect of group was further explored with follow-up t tests directed at examining differences between recurrence and other groups.
ROI analyses
All ROI analyses used a small volume correction (SVC) within a sphere of radius 12 mm centred on specified maxima from previous literature (Mayberg et al. Reference Mayberg, Brannan, Mahurin, Jerabek, Brickman, Tekell, Arturo Silva, McGinnis, Glass, Martin and Fox1997; Sheline et al. Reference Sheline, Price, Yan and Mintun2010), with the significance criterion set at p < 0.05 family-wise error (FWE) corrected. Associated whole-brain statistics are given in the online Supplementary Material.
Reporting of coordinates and illustration of clusters
All coordinates given in the text are reported in Talairach space, following conversion from Montreal Neurological Institute (MNI) space using the program mni2tal (Brett et al. Reference Brett, Christoff, Cusack and Lancaster2001). The MarsBaR toolbox (Brett et al. Reference Brett, Anton, Valabregue and Poline2002) was used to illustrate significant findings by capturing clusters thresholded at p < 0.001 uncorrected, containing significant voxels thresholded at p < 0.05 FWE corrected.
Clinical, demographic and behavioural data
Data analysis used SPSS version 16.0 (www.spss.com). All statistical testing applied the significance criterion p < 0.05, with equal variances not assumed. All t tests were two-tailed.
Results
Subjects and clinical data
Forty-two individuals (20 patients and 22 controls) met the minimum inclusion/exclusion criteria and hence were recruited. Complete T2* images sensitive to BOLD contrast were collected for 20 patients and 20 matched controls (the first two control subjects were excluded from analyses because of technical difficulties with image acquisition). During the follow-up period, seven patients suffered a recurrence of MDD (the recurrence group), 11 remained well (the non-recurrence group) and two were lost to follow-up (and thereby excluded from the subsidiary analysis).
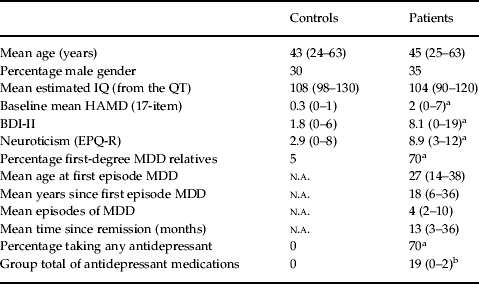
Detailed clinical and demographic data for the 40 subjects included in the main analysis (20 patients and 20 controls) are shown in Table 1. Our primary measure of depressive symptoms, the 17-item HAMD, had a mean value of 2 in the patient group, indicating a well-remitted cohort compared to previous research (Bremner et al. Reference Bremner, Innis, Salomon, Staib, Ng, Miller, Bronen, Krystal, Duncan, Dayton, Lawrence, Malison, Holley, Soufer and Charney1997, Reference Bremner, Vythilingam, Ng and Vermetten2003; Liotti et al. Reference Liotti, Mayberg, McGinnis, Brannan and Jerabek2002). T tests showed no effect of group for age, gender, laterality or IQ but showed expected significant differences between patients and controls in the 17-item HAMD (t = 3.82, df = 21, p = 0.001) and BDI-II (t = 4.15, df = 22, p < 0.001) through residual, non-syndromal symptoms of depression, and in EPQ-R Neuroticism (t = 7.53, df = 35, p < 0.001).
Demographic and clinical data for the control and patient groups (with ranges for numerical data given in parentheses)

QT, Quick Test; HAMD, Hamilton Depression Rating Scale; BDI-II, Beck Depression Inventory – II; EPQ-R, Eysenck Personality Questionnaire – Revised; MDD, major depressive disorder; n.a., not applicable.
a Significant difference between patient and control groups, two-tailed t tests p < 0.05.
b Significant difference both between patient and control groups and also within the patient group, with significantly greater amounts of antidepressant medication in the non-recurrence group (two-tailed t test p < 0.05).
ANOVAs of control versus recurrence versus non-recurrence groups, with follow-up t tests, showed that the only significant difference on clinical measures between the recurrence and non-recurrence groups was medication status (detailed in online Supplementary Table S1). Patients in the recurrence group were significantly less likely to be taking medication at baseline than those in the non-recurrence group (t = 3.01, df = 15, p = 0.01), with a relative risk of recurrence for medicated patients (taking at least one maintenance treatment) compared to unmedicated patients (no maintenance treatment) of 0.29 [95% confidence interval (CI) 0.10–0.85], consistent with expectations based on meta-analytic data (Geddes et al. Reference Geddes, Carney, Davies, Furukawa, Kupfer, Frank and Goodwin2003; Williams et al. Reference Williams, Simpson, Simpson and Nahas2009).
Behavioural data
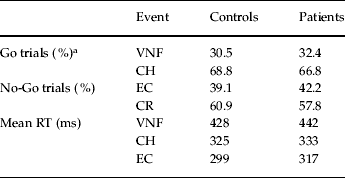
Behavioural data from the main event-related analysis are summarized in Table 2. Independent t tests showed no significant effect of group for the occurrence of events: VNF (t = 0.09, df = 38, p = 0.93), CH (t = 0.05, df = 38, p = 0.96), DP (t = 1.29, df = 24, p = 0.21), MISS (t = 0.76, df = 32, p = 0.46), EC (t = 0.81, df = 38, p = 0.42) or CR (t = − 0.81, df = 38, p = 0.42). Paired t tests (across groups) showed significantly faster reaction times (RTs) for EC versus CH trials (t = 7.11, df = 39, p < 0.001), in keeping with the literature (Pailing et al. Reference Pailing, Segalowitz, Dywan and Davies2002; Ruchsow et al. Reference Ruchsow, Herrnberger, Beschoner, Grön, Spitzer and Keifer2006; Holmes & Pizzagalli, Reference Holmes and Pizzagalli2008), and the expected significantly slower RTs for VNF versus CH trials (t = 13.84, df = 39, p < 0.001). There were no significant RT differences in either independent t tests between patients and controls, or in ANOVAs of the control, recurrence and non-recurrence groups.
Behavioural data showing rates of visual negative feedback (VNF), correct hit (CH), error commission (EC) and correct reject (CR) trials in control and patient groups (given as a percentage of total numbers of Go or No-Go trials). Mean reaction times (RTs) are shown for VNF, CH and EC trials
a Double press (DP) and Miss events occurred with a combined frequency of <1% of Go trials for both patient and control groups and are not tabulated here.
Paired t tests for post-event findings showed significant slowing across groups in RTs for CH following EC (pEC-CH) compared to RTs for CH following CH (pCH-CH) (t = 6.37, df = 39, p < 0.001), in keeping with the literature (Laming, Reference Laming1968) and indicating good engagement with task, and also predicted significant speeding up across groups in RTs for CH following VNF (pVNF-CH) compared to pCH-CH (t = 2.52, df = 39, p = 0.02). Again, there were no significant RT differences in t tests between patients and controls, or in ANOVAs of the control, recurrence and non-recurrence groups.
BOLD contrast data for the main analysis
We aimed to test the hypothesis that baseline event-related activity within the two ROIs dmPFC (BA 9) and rACC (BA 24/32) would significantly differentiate the predicted high-vulnerability remitted-state patients from controls. The positive effect of condition for EC > CH across the groups (n = 40) is detailed in online Supplementary Table S2 and showed whole-brain significant task-related activity consistent with the literature (reviewed in Ridderinkhof et al. Reference Ridderinkhof, Ullsperger, Crone and Nieuwenhuis2004). Between-group comparison of patients (n = 20) versus controls (n = 20) for the contrast EC > CH showed hypoactivity in the patient group in a right dmPFC cluster, significant at voxel level after SVC in the previously defined dmPFC ROI (Sheline et al. Reference Sheline, Price, Yan and Mintun2010) [125-voxel cluster with peak at (22, 42, 33), BA 9; voxel-level t = 5.33, df = 36, p FWE-corr = 0.001]; and hypoactivity again within the patient group within a right rACC cluster, significant at voxel-level following SVC in the previously defined rACC ROI (Mayberg et al. Reference Mayberg, Brannan, Mahurin, Jerabek, Brickman, Tekell, Arturo Silva, McGinnis, Glass, Martin and Fox1997) [76-voxel cluster with peak at (4, 49, 1), BA 32; voxel-level t = 4.25, df = 36, p FWE-corr = 0.015].
The positive effect of condition for response-locked VNF > CH across groups (n = 40) is detailed in online Supplementary Table S3 and showed whole-brain significant task-related activity in the expected areas, including strong bilateral occipital activation in the primary visual cortex and visual processing areas, and activation of language processing areas in the left temporal and inferior frontal cortex. Comparison of patients versus controls for the contrast VNF > CH showed hypoactivity in the patient group in a right dmPFC cluster, significant at voxel level after SVC in the dmPFC ROI [75-voxel cluster with peak at (22, 40, 28), BA 9; voxel-level t = 5.06, df = 36, p FWE-corr = 0.002].
Table 3 summarizes the significant statistics for hypoactivity in patients compared to controls in this main analysis, showing the almost exact co-localization of significant dmPFC peak voxels during EC > CH and VNF > CH.
Regions of significant hypoactivity in the dorsomedial prefrontal cortex (dmPFC) and rostral anterior cingulate cortex (rACC) in patients compared to controls for the contrasts of interest: error commission (EC) > correct hits (CH); and visual negative feedback (VNF) > correct hits (CH). The table shows voxels that satisfied family-wise error (FWE) correction (p < 0.05) within the specified dmPFC and rACC regions of interest (ROIs)

BA, Brodmann area; R, right.
BOLD contrast ANOVAs of controls versus medicated patients versus unmedicated patients for both conditions (EC > CH and VNF > CH) did not show any significant differences between patient groups at any site, at either whole-brain or SVC level. A further targeted analysis based on extracted mean BOLD contrast data within 12-mm spheres centred on the peak significant voxels from this ANOVA, deliberately biased towards finding medication effects at the right dmPFC and rACC (that might undermine our main findings), again showed no significant effects and is reported in the online Supplementary Material.
The results from this main analysis showing co-localized right dmPFC (BA 9) activity are illustrated in Fig. 1.
Parasagittal sections from the main analysis showing significant hypoactivity in the patient group (n = 20) relative to controls (n = 20) in the right dorsomedial prefrontal cortex (dmPFC) [Brodmann area (BA) 9; cross-hairs centred on x = 20, y = 40, z = 26]. The blue cluster denotes significant hypoactivity related to error commission (EC) trials [EC > correct hit (CH)] and the red cluster denotes significant hypoactivity related to visual negative feedback (VNF) trials (VNF > CH). The image displays clusters (thresholded at p < 0.001 uncorrected) on a single subject T1 template image from SPM5, with peak voxels in each volume surviving family-wise error (FWE) correction p < 0.05, within identified regions of interest (ROIs) (detailed statistics given in the text). Bar charts, using the same colour code as the images, show contrast estimates for mean activity within a 12-mm sphere centred on the peak voxel of each cluster (coordinates given in main text) taken from subsequent ANOVAs comparing unmedicated patients, medicated patients and controls (error bars show 95% confidence intervals) for the two contrasts of interest (EC > CH and VNF > CH).
BOLD contrast data for secondary recurrence analysis
We also aimed to test the hypothesis that baseline activity within our ROIs dmPFC (BA 9) and rACC (BA 24/32) would significantly differentiate the observed high-vulnerability recurrence group from the observed low-vulnerability group and controls. ANOVAs of BOLD activity in recurrence (n = 7) versus non-recurrence (n = 11) versus control (n = 20) groups are presented here followed by the results of t tests between recurrence and other groups.
The main effect of group for the contrast EC > CH showed a cluster in the right dmPFC [57-voxel cluster with peak at (22, 40, 31)], significant after SVC in the previously defined dmPFC ROI (F 2,31 = 14.42, voxel-level p FWE-corr = 0.012). Follow-up t tests showed that combined patients (recurrence and non-recurrence) had significant hypoactivity in the dmPFC ROI following SVC [peak voxel (22, 40, 31), BA 9; voxel-level t = 5.33, df = 31, p FWE-corr = 0.002] and significant hypoactivity at the rACC ROI following SVC [controls > combined patients 35-voxel cluster with peak at (4, 49, 1), BA 32; voxel-level t = 4.06, df = 31, p FWE-corr = 0.028]. However, contrasts between the recurrence and other groups showed no significant effects.
The main effect of group for the contrast VNF > CH again showed a cluster in the right dmPFC [47-voxel cluster with peak at (20, 38, 26)], significant after SVC in the previously defined dmPFC ROI (F 2,31 = 19.87, voxel-level p FWE-corr = 0.002). Follow-up t tests showed that combined patients were hypoactive within this cluster compared to controls, significant at voxel level after SVC [peak voxel (20, 38, 26), BA 9; voxel-level t = 5.85, df = 31, p FWE-corr = 0.0005]. Again, however, contrasts between the recurrence and other groups showed no significant effects.
Post-event ANOVA using the contrast pEC-CH > pCH-CH showed a main effect of group within the right dmPFC, approaching corrected whole-brain significance [54-voxel cluster with peak at (4, 46, 29); whole-brain voxel-level F 2,31 = 21.76, p FWE-corr = 0.095]. As this approached whole-brain significance within the right dmPFC (BA 9), follow-up t tests were conducted and identified corrected whole-brain significant hypoactivity in the recurrence compared to the non-recurrence group [126-voxel cluster with peak at (4, 46, 29), BA 9; whole-brain voxel-level t = 6.59, df = 31, p FWE-corr = 0.010], and whole-brain significant hypoactivity in the recurrence compared to both other groups combined [103-voxel cluster with peak at (6, 48, 29), BA 9; whole-brain voxel-level t = 6.29, df = 31, p FWE-corr = 0.021].
The contrast pVNF-CH > pCH-CH showed a main effect of group again within the right dmPFC [23-voxel cluster with peak at (8, 36, 29)] significant after SVC (F 2,31 = 13.99, voxel-level p FWE-corr = 0.021). Follow-up t tests for recurrence compared to non-recurrence did not reach significance. Comparison of recurrence with both other groups combined showed a right dmPFC cluster [141 voxel cluster with peak at (8, 36, 29)] with significant hypoactivity in the recurrence group following SVC [peak voxel (8, 36, 29), BA 9; voxel-level t = 4.69, df = 31, p FWE-corr = 0.010].
Figure 2 illustrates the results from this analysis with effect size estimates of BOLD contrast data.
Illustration of the secondary analysis of recurrence, showing clusters from ANOVAs comparing recurrence (n = 7), non-recurrence (n = 11) and control (n = 20) groups, in which there were group differences in either immediate or delayed effects of interest in the right dorsomedial prefrontal cortex (dmPFC). (a) The immediate, event-related hypoactivity in both recurrence and non-recurrence groups compared to controls for both error commission (EC; blue) and visual negative feedback (VNF; red) in the right dmPFC [Brodmann area (BA) 9; cross-hairs centred on x = 20, y = 40, z = 26]. (b) Persisting hypoactivity in the right dmPFC (BA 9; centred on x = 6, y = 40, z = 26), only in the recurrence group, during subsequent correct hit (CH) trials (blue for CH trials following EC; red for CH trials following VNF). Images display clusters (thresholded at p < 0.001 uncorrected) on single subject T1 template images from SPM5, with peak voxels in each volume surviving family-wise error (FWE) correction p < 0.05 for comparison of (a) controls > patients and (b) controls/non-relapsers > relapsers. Bar charts, using the same colour code, show contrast estimates for mean activity within a 12-mm sphere centred on the peak voxel within the ANOVAs comparing recurrence, non-recurrence and control groups (error bars show 95% confidence intervals). Statistical analysis is given in main text.
Discussion
Convergent evidence from the main analysis (associated with both EC and VNF) showed significant remitted-state hypoactivity in patients relative to controls within a ROI in the right dmPFC (BA 9), previously identified as a nexus point for dysfunctional cognitive-affective regulation in MDD (Sheline et al. Reference Sheline, Price, Yan and Mintun2010; Zhou et al. Reference Zhou, Yu, Zheng, Liu, Song, Qin, Li and Jiang2010). The implication that some immediate processing of diverse sources of negative experience at the right dmPFC may be functionally adaptive and protective against MDD fits with normal population data indicating that the dmPFC exerts executive inhibitory control over ventral, limbic areas during effective reappraisal of negative stimuli (reviewed in Ochsner & Gross, Reference Ochsner and Gross2005).
Our results show additional significant remitted-state hypoactivity in our other ROI, the rACC (BA 32), but only associated with EC. In fact, across-group BOLD contrast data showed that, whereas the rACC was strongly activated during EC, consistent with published fMRI findings (Kiehl et al. Reference Kiehl, Liddle and Hopfinger2000; Laurens et al. Reference Laurens, Ngan, Bates, Kiehl and Liddle2003), there was no rACC activation during VNF processing, which instead strongly activated visual and language processing areas. It may be that, in keeping with previous hypotheses (Gehring et al. Reference Gehring, Goss, Coles, Meyer and Donchin1993; Falkenstein et al. Reference Falkenstein, Hoormann, Christ and Hohnsbein2000), the additional rACC activity during EC indicates specific implicit error detection processes (e.g. matching actual versus intended responses) that are not required during explicit negative feedback. This association between relative hypoactivity at the rACC and dmPFC fits with evidence showing strong connectivity between these regions (e.g. Johansen-Berg et al. Reference Johansen-Berg, Gutman, Behrens, Matthews, Rushworth, Katz, Lozano and Mayberg2008) and imaging data from acute MDD populations linking activity at these two sites (Siegle et al. Reference Siegle, Thompson, Carter, Steinhauer and Thase2007). The observation that explicit VNF processing was not associated with any equivalently hypoactive region, for example in visual association areas, raises the possibility that more distributed processing deficits during implicit negative feedback (in this case contingent on error detection involving the rACC) may present a particular threat within the neural vulnerability to MDD.
Conclusions on the subsidiary analysis of recurrence are limited by the small numbers involved and the potential confounding effect of medication. There was no significant separation within the patient group during immediate EC or VNF, and relatively weak, though convergent, findings from the analysis of subsequent correct trials that persistent hypoactivity within the right dmPFC (BA 9) during both post-EC and post-VNF processing was associated with recurrence. The temporal aspects of this analysis may offer some explanation for apparently divergent findings from previous reports on ability to mount effortful cognitive control in patient populations (e.g. Vanderhasselt & De Raedt, 2009 versusNorbury et al. Reference Norbury, Selvaraj, Taylor, Harmer and Cowen2010), with predications that adaptive dorsal PFC hyperactivity (evolving within 30-s blocks) might indicate better prognosis in MDD (Norbury et al. Reference Norbury, Selvaraj, Taylor, Harmer and Cowen2010), consistent with post-event findings in the current study (around 4–4.5 s post-stimulus) but not with immediate event-related findings (around 0.3–0.4 s post-stimulus). The weakness of the follow-up analysis may reflect an insufficient power to detect relatively small differences in vulnerability to MDD within the patient group when compared with the stronger differences operating across patient versus controls groups, indicating that much larger MDD patient cohorts will be needed if this question is to be examined more fully in the future.
EC and VNF were both associated with significant post-trial behavioural effects across group, indicating appropriate immediate adaptive responses consistent with the literature (Ridderinkhof et al. Reference Ridderinkhof, Ullsperger, Crone and Nieuwenhuis2004), but there were no observed behavioural differences between groups. The time-frame for observed BOLD differences here (including both analyses) was within that identified by previous fMRI studies assessing PFC changes associated with adaptive reappraisal of negative experience (within 0–4.5 s) and much earlier than PFC changes associated with less adaptive strategies towards negative experience (such as suppression >10 s) (Goldin et al. Reference Goldin, McRae, Ramel and Gross2008). Given that the BOLD differences were also primarily observed in an area (dmPFC) associated with reappraisal (reviewed in Ochsner & Gross, Reference Ochsner and Gross2005) and self-evaluation (Kelley et al. Reference Kelley, Macrae, Wyland, Caglar, Inati and Heatherton2002; Marsh et al. Reference Marsh, Blair, Vythilingam, Busis and Blair2007; Polli et al. Reference Polli, Barton, Thakkar, Greve, Goff, Rauch and Manoach2008; Lemogne et al. Reference Lemogne, le Bastard, Mayberg, Volle, Bergouignan, Lehéricy, Allilaire and Fossati2009), it may be that dmPFC activity in controls (and perhaps that seen slightly later in non-relapsers) represents relatively ‘mindful’ activity with any immediate behavioural correlates beyond the power of our fMRI study. If the right dmPFC hypoactivity observed in vulnerable patients here were to represent a failure of early (0–4.5 s) adaptive reappraisal of negative experience, then in keeping with previous theories of right dmPFC impairment, the dominant behavioural component may in fact be latent, through diminished capacity to ‘sustain … reactions when the immediate elicitors are not present’ (Davidson & Irwin, Reference Davidson and Irwin1999).
Clinical data showed that patients had significant family histories of depression, significant non-syndromal symptoms of depression and significantly higher neuroticism compared to controls. These features were expected in high recurrence-risk MDD and regarded as core clinical aspects of vulnerability, consistent with the literature (Kennedy & Paykel, Reference Kennedy and Paykel2004; Nierenberg et al. Reference Nierenberg, Husain, Trivedi, Fava, Warden, Wisniewski, Miyahara and Rush2010), rather than as distinct, separable variables. Compared to controls, patients were also on a range of different medications aimed at reducing recurrence, and medication status was also the only statistically significant difference between the recurrence and non-recurrence groups. Although these medication differences were expected and perhaps unavoidable within our study design, they also introduced an important potential confounder because antidepressant medication (though seemingly largely restorative within MDD cohorts) may have exerted independent effects on regional brain activity (reviewed in Delaveau et al. Reference Delaveau, Jabourian, Lemogne, Guionnet, Bergouignan and Fossati2011). We sought to address this through ANOVAs and specific ROI studies of BOLD data, searching for differences between medicated, unmedicated and control groups. No significant medication effects were identified and although we still cannot rule out medication as a potentially important confounder, there were no indications that it added to the observed differences in brain function. The non-significant trend from both analyses was more suggestive of the possibility that, within this population, maintenance-phase medication tended to reduce the observed hypoactivity. Although we were careful to match for age and exclude any CNS disease, the results may also be limited by the relatively advanced age of some of the participants [mean 44 (range 24–63) years], introducing possible age-related brain changes.
Within these limitations, our main analysis showed that remitted-phase MDD patients with high predicted vulnerability to future episodes exhibited co-localized hypoactive right dmPFC (BA 9) processing of both EC and VNF proximate to a nexus point recently hypothesized to mediate the dysfunctional integration of cognitive and affective networks in MDD (Sheline et al. Reference Sheline, Price, Yan and Mintun2010). Additional evidence showed that this right dmPFC (BA 9) hypoactivity was linked to hypoactive right rACC (BA 32) processing, close to our other ROI (Mayberg et al. Reference Mayberg, Brannan, Mahurin, Jerabek, Brickman, Tekell, Arturo Silva, McGinnis, Glass, Martin and Fox1997), when internal generation of salience was also required. Much more limited evidence suggested that persistent right dmPFC (BA 9) hypoactivity following EC and VNF was associated with vulnerability to MDD observed in 1-year recurrence. This is the first fMRI study incorporating 1-year follow-up in MDD and the findings suggest that any future work using this design will need much greater power to draw out what may be relatively subtle neural correlates of recurrence vulnerability within patient cohorts. The ultimate importance of dmPFC and rACC processing within the time-frame examined here may rest in early, adaptive reappraisal of negative experience, and a failure to do this adequately may perhaps be a feature of the vulnerable state.
Supplementary material
For supplementary material accompanying this paper visit http://dx.doi.org/10.1017/S0033291712002164.
Acknowledgements
We thank The Institute of Mental Health, Nottingham, UK for funding the research time of Dr N. L. Nixon, The Mapperley Hospital Medical Research Fund, Nottingham, UK for a contribution to payments to volunteers, Nottinghamshire Healthcare NHS Trust, Nottingham, England for support and help with recruitment, Dr A. Plodowski for her help in designing the original fMRI paradigms, and Dr A. Lee for his inspiration, support and guidance on clinical aspects of the research.
Declaration of Interest
Dr N. L. Nixon received funding from the Institute of Mental Health, Nottingham, which enabled him to carry out this research project; he has also received financial assistance to attend academic meetings from Janssen-Cilag, AstraZeneca and Servier; and has taken part in advisory panels for Janssen-Cilag and Servier. Professor P F. Liddle has received honoraria for academic presentations from Glaxo SmithKline, AstraZeneca, Janssen-Cilag, Bristol Myers Squibb, Eli Lilly and Johnson and Johnson Pharmaceuticals, and has also taken part in advisory panels for Eli Lilly, Pfizer and Glaxo SmithKline. Dr M. Liotti received a grant from the National Alliance for Research on Schizophrenia and Depression (NARSAD). Dr G. Worwood has received honoraria for academic presentations from Janssen-Cilag.