

Introduction
Long-term population dynamics provide insights into the causes and effects of societal and environmental change, as attested by the questions that are widely discussed within archaeological research today, such as migration (Rowley-Conwy, Reference Rowley-Conwy2011), societal crisis (Diamond, Reference Diamond2005), pandemics (Lagerås, Reference Lagerås2016), climate and environmental change (Warden et al., Reference Warden, Moros, Neumann, Shennan, Timpson and Manning2017), or the Anthropocene (Ruddiman, Reference Ruddiman2003). But population dynamics are difficult to apprehend, given the complexity of the material culture and the diversity of the source material, which leads to contextual and chronological specialization within archaeological research. In Scandinavia, previous interpretations of long-term trends in population and settlement have mainly relied on palynological studies. These have produced accessible overviews of a gradual increase in human impact on the vegetation (Berglund, Reference Berglund1969, Reference Berglund1991, Reference Berglund2003; Lagerås & Fredh, Reference Lagerås and Fredh2019) but can be complemented by other approaches, such as using summed radiocarbon dates from archaeological sites.
This approach is now possible in Sweden since many dates have been obtained, giving us the opportunity to compile and analyse large datasets from multiple sites. In contrast to pollen records, radiocarbon dates from archaeological sites reflect a wide range of human activities, particularly building and household activities, and are less dependent on past land-use practices. They mostly derive from settlement areas with extensive evidence of building activity, whereas pollen-analytical studies have focused mainly on marginal uplands, due to the availability of lakes and preserved peatlands for sampling in such environments. The two approaches therefore complement each other.
Summed radiocarbon dates have been used to study long-term population dynamics on very different geographical scales, from continental (Peros et al., Reference Peros, Munoz, Gajewski and Viau2010) to national and regional (Tallavaara et al., Reference Tallavaara, Pesonen and Oinonen2010; Armit et al., Reference Armit, Swindles and Becker2013; Lagerås, Reference Lagerås2013; Crema et al., Reference Crema, Habu, Kobayashi and Madella2016; Bergsvik et al., Reference Bergsvik, Darmark, Hjelle, Aksdal and Åstveit2021). Some studies have focused on specific research questions, particularly the Neolithic population dynamics of northern Europe (Shennan & Edinborough, Reference Shennan and Edinborough2007; Collard et al., Reference Collard, Edinborough, Shennan and Thomas2010; Stevens & Fuller, Reference Stevens and Fuller2012; Shennan et al., Reference Shennan, Downey, Timpson, Edinborough, Colledge and Kerig2013; Downey et al., Reference Downey, Bocaege, Kerig, Edinborough and Shennan2014; Woodbridge et al., Reference Woodbridge, Fyfe, Roberts, Downey, Edinborough and Shennan2014), or on the possible correlation between demography and climate (Riede, Reference Riede2009; Bevan et al., Reference Bevan, Colledge, Fuller, Fyfe, Shennan and Stevens2017; Warden et al., Reference Warden, Moros, Neumann, Shennan, Timpson and Manning2017). Although several factors may affect the number of radiocarbon dates from a given period (particularly different past traditions regarding building techniques and the use of fire, but also differences in archaeological investigation and dating strategies), the summed probability distribution (SPD hereafter) approach is based on the assumption that there is a positive (but not necessarily linear) relationship between the number of radiocarbon dates and population size, given that the dates derive from archaeological features and that the number of dates is high (Shennan & Edinborough, Reference Shennan and Edinborough2007; Williams, Reference Williams2012; Shennan et al., Reference Shennan, Downey, Timpson, Edinborough, Colledge and Kerig2013).
Here we present a new compilation of 6637 radiocarbon dates from archaeological sites in southernmost Sweden, ranging from 9000 cal bc to the present. The SPD of calibrated radiocarbon dates is interpreted and discussed with respect to long-term population development and settlement dynamics within the region. Most dates come from the fertile and densely populated plains of south-western Scania, where archaeological intervention has been particularly high, but there are also dates from other landscapes, ranging from coastal plains to forested uplands. This diversity allows us to also address geographical aspects of population change.
Due to the possibilities for mathematical analysis offered by large datasets, many SPD studies of radiocarbon dates focus on modelling and other technical aspects of data analysis. Here, however, we use SPDs simply as a graphical presentation of radiocarbon dates and pay more attention to their archaeological context. We present separate SPDs for different types of features (such as longhouses, hearths, pits, or clearance cairns) to better understand the processes and activities behind population and settlement change. We also present separate SPDs for different types of dated material (e.g. charcoal, cereal grain, or hazelnuts).
Our aim is to present the temporal distribution of radiocarbon dates from the region under study, and to discuss and interpret some of the most striking trends observed in the data. These are: 1) a strong increase in the number of dates at the Mesolithic/Neolithic transition (c. 4000 cal bc), followed by a sharp decline a few centuries later; 2) a steady and strong increase in the number of dates from the Early Bronze Age to the Roman Iron Age (1500 cal bc–cal ad 200); and 3) a decrease in the Nordic Late Iron Age (seventh century ad).
Material and Methods
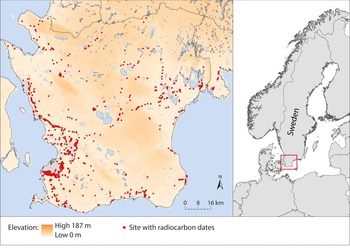
Radiocarbon dates were collected from the province of Scania and the neighbouring westernmost part of the province of Blekinge in southernmost Sweden (Figure 1). The dates were collected from publications and reports, mainly from investigations in advance of infrastructure development projects, i.e. contract archaeology (96 per cent of the dates), but also from university-based research projects (4 per cent). A total of 6637 dates from 9000 cal bc to the present were collated. Although surely incomplete, the dataset is estimated to cover more than 90 per cent of all dates from the region published before 2020 (see online Supplementary Material). Because radiocarbon dating was less common in early investigations, most dates were obtained from the mid-1990s onwards. The dates were collected from all types of archaeological sites and remains. Information on contexts and dated material, when available, was taken from the publications and reports. Only dates from archaeological features were collected, excluding dates from sediments or other natural deposits. Other than that, no dates were excluded, and no attempt was made to classify the dates according to quality or reliability. We chose this approach to obtain a high degree of objectivity, and also because such a validation of the dates would, in most cases, be difficult to do based on the original publications and reports. Longhouses were the most frequently dated type of archaeological feature and charcoal the most common type of dated material.
Map of southernmost Sweden showing the locations of the archaeological sites that contributed radiocarbon dates to this study. Most investigations were undertaken within contract archaeology and the distribution of the sites largely reflects recent infrastructure development.

The fact that the vast majority of the dates gathered came from investigations conducted within contract archaeology influences our results in two major ways. First, there is a bias to areas with many infrastructure projects. Although road construction has resulted in large-scale archaeological investigations in some sparsely populated areas, most infrastructure projects have taken place in densely populated areas, with the outskirts of Malmö particularly affected since the 1980s. This is an area of rich agricultural soils, with dense agrarian settlement established long before the expansion of Malmö. Hence, there is a bias in the radiocarbon dates to areas with rich soils and dense settlement in south-western Scania.
Second, the obtention of dates in contract archaeology, compared to dates obtained in investigations by university-based projects, arguably provides a closer-to-random data set. This is because the aim within Swedish contract archaeology in general is to include all types of features and to cover all periods represented on a given site.
After collection, all radiocarbon dates were calibrated using OxCal 4.4 and IntCal20 (Reimer et al., Reference Reimer, Austin, Bard, Bayliss, Blackwell and Bronk Ramsey2020). Summed probability distributions of calibrated dates were calculated using OxCal 4.4.
SPD plots are widely used to present large sets of radiocarbon dates (e.g. Williams, Reference Williams2012; Crema & Bevan, Reference Crema and Bevan2021). They are particularly suitable when the dataset is large, the underlying distribution is not known, and the individual dates are regarded as unrelated (Bronk Ramsey, Reference Bronk Ramsey2017). A possible problem with SPD plots is that they are influenced by irregularities of the calibration curve, caused by past variations in the atmospheric radiocarbon content; for example, steep parts of the calibration curve (calendar-age steps) produce steep narrow peaks in the SPD plots (Williams, Reference Williams2012). This noise, due to the shape of the calibration curve, may be smoothed by calculating running averages (Williams, Reference Williams2012) or by using alternative methods of summarizing the dates (Bronk Ramsey, Reference Bronk Ramsey2017).
Since we focus here only on broad patterns, where the noise described above can be expected to have little or no influence, we chose to present unsmoothed SPD plots. This approach facilitates comparisons with other studies using the same approach. It also makes the results easily repeatable, using OxCal or other comparable software.
To compensate for possible bias due to a profusion of dates at some sites compared to others, a corrected SPD was calculated, where each investigated site contributed a maximum of one date (the median date) per 100-year interval. When compared, the two SPDs are referred to as ‘corrected SPD’ and ‘total SPD’, respectively.
Finally, for the discussion of the Neolithic, we present bar charts showing the absolute number of dates per time interval, for comparison with the SPDs. These bar charts were constructed using OxCal median outputs (following Telford et al., Reference Telford, Heegaard and Birks2004).
Results
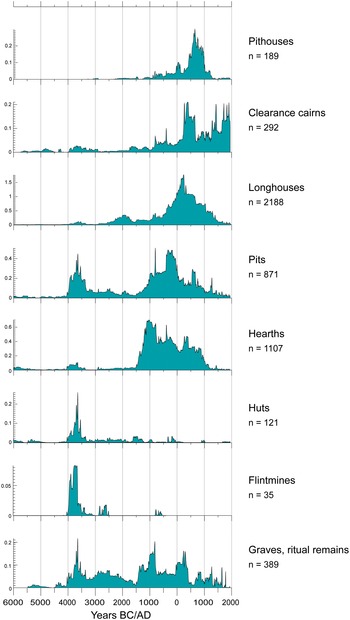
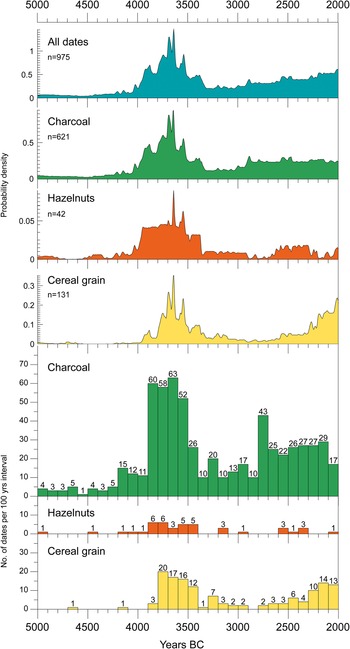
A summed probability distribution for all 6637 dates from 9000 cal bc to the present is presented in Figure 2 (in addition there were ten dates from 12,000 to 9000 cal bc). The n-values in this and all other plots represent the number of radiocarbon dates used, with median values falling within the time intervals chosen. In Figure 3, the total SPD is compared with a corrected SPD (see Material and Methods section), while Figure 4 shows separate SPDs for different context types. Table 1 gives an overview of the frequency of dated materials, when specified in the original publications. SPDs and bar charts of a selection of materials dated to between 5000 and 2000 cal bc are presented in Figure 5.
Summed probability distribution (SPD) of all 6637 calibrated radiocarbon dates from southernmost Sweden in this study.

Comparison between the total (uncorrected) SPD (light blue), based on all dates, and an SPD corrected for bias due to extensive dating at individual sites (dark blue), 6000 cal bc to the present.

SPDs for selected types of archaeological features, 6000 cal bc to the present. The Longhouses category mainly refers to postholes, but also to other features (hearths, wall foundations, floor layers) interpreted in the original reports as belonging to longhouses. Note the differences in n-values.

Close-up of dates from 5000 to 2000 cal bc to reveal details of the Neolithic boom-and-bust. The upper four plots show SPDs for all dates and for three separate categories of dated material. The bar charts for different dated material are based on the same dates as the SPDs and show the absolute number of dates per 100-year interval (based on OxCal median outputs). The labels at the top of the bars show the number of dates.

Types of material used for radiocarbon dating and corresponding number of dates.

Discussion
Neolithic boom-and-bust
From c. 9000 cal bc onwards, the total SPD indicates continuous settlement activity in the region (Figure 2) and, from c. 7000 cal bc, it increases to reach a first peak around 6600–5800 cal bc (chronologically corresponding to the Kongemose culture). A decline followed during the Late Mesolithic (corresponding to the Ertebølle culture), with a particularly low SPD between 5200 and 4200 cal bc, indicating very low settlement activity. If the SPD represents population density, the Mesolithic population of the Ertebølle culture seems to have been very sparse by the end of the Mesolithic, which may have facilitated immigration by Neolithic agriculturalists (Rowley-Conwy, Reference Rowley-Conwy2011; Sørensen & Karg, Reference Sørensen and Karg2014).
In contrast to the low values of the Late Mesolithic, the transition to the Neolithic at c. 4000 cal bc is characterized by a very sharp and strong increase in the SPD (Figure 5). This Early Neolithic boom started around 4000 cal bc and peaked at c. 3700 cal bc. The strong increase also exhibited by the corrected SPD (Figure 3) suggests that the Early Neolithic boom is not due to a few large sites with many dates but is represented by numerous sites. In some cases, Early Neolithic activity has been documented on the same sites as Late Mesolithic settlements, particularly at coastal sites (Andersson, Reference Andersson2004; Jonsson, Reference Jonsson2005), but the very strong and sharp increase in the SPD at the Mesolithic/Neolithic transition indicates that most Early Neolithic sites had no Mesolithic antecedents.
The dates that make up the Early Neolithic peak derive mainly from pits, hearths, and huts, reflecting a strong increase in settlement activity and probably in population numbers (Figure 4). The SPD for the flint mines of Södra Sallerup, outside Malmö in south-western Scania, peaks during the initial Neolithic expansion, at c. 4000–3700 cal bc (Figure 4) indicating that high-quality flint was a vital resource to the pioneering farmers. The large quantities of point butted flint axes that were produced and widely distributed within a few centuries certainly played an important role in woodland clearance (Sørensen & Karg, Reference Sørensen and Karg2014; Berggren, Reference Berggren2018).
Looking in detail at the initial Neolithic expansion, the SPDs for different categories of dated material reveal that charcoal, hazelnuts, and cereal grains all increase around or soon after 4000 cal bc (Figure 5). The major increase in cereal grains is, however, slightly delayed in relation to the sharp increase in charcoal and hazelnuts, possibly indicating a short time lag of some 100 years between the clearing of woodland and larger-scale production, handling, and consumption of cereals at the settlement sites.
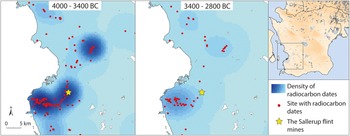
The expansion described above was followed by a decline after 3600 cal bc, with SPDs at a Neolithic all-time-low at c. 3300 cal bc (Figures 2 and 5). Both the increase and the succeeding decline fall within the time of the Early Neolithic Funnel Beaker culture. The decline is reflected in all types of settlement contexts (pits, hearths, huts) (Figure 4), and in different materials (charcoal, hazelnuts, cereal grains) (Figure 5), indicating that it was a true settlement decline, not just a change in the character of settlement activities. Most notably, the SPD for cereal grains reaches very low values at c. 3100–2600 cal bc (approximately the early part of the Middle Neolithic), indicating a low point not only in settlement activity but also in crop growing. A close-up of south-western Scania shows that the sparse settlement after the decline seems to have concentrated near the coast, and the area around the flint mines lost its former attraction (Figure 6).
Maps of south-western Scania showing the density of radiocarbon dates from 4000–3400 cal bc and 3400–2800 cal bc, respectively. The location of the Early Neolithic flint mines at Södra Sallerup is indicated by a star. Density was calculated using Kernel density function in ArcGIS 10.7.1.

The Early Neolithic pattern observed is in line with several other studies using large radiocarbon datasets from northern and western Europe (Shennan & Edinborough, Reference Shennan and Edinborough2007; Collard et al., Reference Collard, Edinborough, Shennan and Thomas2010; Shennan et al., Reference Shennan, Downey, Timpson, Edinborough, Colledge and Kerig2013; Woodbridge et al., Reference Woodbridge, Fyfe, Roberts, Downey, Edinborough and Shennan2014). The same pattern has also been shown for southern Sweden, but based on a much smaller dataset (Hinz et al., Reference Hinz, Feeser, Sjögren and Müller2012; Shennan et al., Reference Shennan, Downey, Timpson, Edinborough, Colledge and Kerig2013; Downey et al., Reference Downey, Bocaege, Kerig, Edinborough and Shennan2014). The very sharp increase in the number of dates around the Mesolithic/Neolithic transition has been interpreted by several authors as a population increase following the initial immigration by farmers into new areas (Shennan & Edinborough, Reference Shennan and Edinborough2007; Collard et al., Reference Collard, Edinborough, Shennan and Thomas2010; Stevens & Fuller, Reference Stevens and Fuller2012; Bevan et al., Reference Bevan, Colledge, Fuller, Fyfe, Shennan and Stevens2017). Like our study, a study of radiocarbon datasets from Poland, Germany, and Denmark revealed few dates from the Late Mesolithic, interpreted as low population densities immediately before the beginning of farming (Shennan & Edinborough, Reference Shennan and Edinborough2007). Denmark in particular had very few radiocarbon dates from the end of the Mesolithic. Together, these studies appear to indicate that both Denmark and southern Sweden were only sparsely populated by hunter-gatherers at the time of the introduction of agriculture.
The sharp decline that followed a few hundred years after the Early Neolithic increase is usually interpreted as a collapse of Neolithic societies associated with a significant population drop (Shennan & Edinborough, Reference Shennan and Edinborough2007; Shennan et al., Reference Shennan, Downey, Timpson, Edinborough, Colledge and Kerig2013). The cause of this decline remains unclear. A comparison between climatic proxies and archaeological SPDs from Great Britain and Ireland suggested a positive link between climate deterioration and decreased population numbers during the Neolithic (Bevan et al., Reference Bevan, Colledge, Fuller, Fyfe, Shennan and Stevens2017), whereas a similar study based on radiocarbon dates from different countries in western and northern Europe, including southern Scandinavia, found no such link (Shennan et al., Reference Shennan, Downey, Timpson, Edinborough, Colledge and Kerig2013). Alternatively, the decline may have been caused by endogenous factors, like a too rapid population growth combined with unsustainable farming practices (Shennan et al., Reference Shennan, Downey, Timpson, Edinborough, Colledge and Kerig2013). A combination of endogenous and exogenous factors has also been suggested, where increased social rigidity and tensions made society vulnerable to climatic change (Hinz, Reference Hinz, Brink, Hydén, Jennbert, Larsson and Olausson2015). Whatever the causal relationships, the SPDs presented here indicate that a collapse occurred in southern Sweden, resulting in a strong decrease in settlement activity and probably a drop in population numbers between 3600 and 3300 cal bc.
Monumental passage graves and large timber palisades are well-known types of archaeological remains from the Middle Neolithic in southern Sweden (Andersson, Reference Andersson2004; Brink et al., Reference Brink, Kishonti and Magnell2009). These striking and impressive constructions, together with the Alvastra ‘pile dwelling’ further north (Göransson, Reference Göransson1995; Browall, Reference Browall2016) similarly dated to the Middle Neolithic, may have obscured the fact that there are few settlements dated to this period. Hypothetically, these very special sites may be the expressions of social unrest connected to a drop in population.
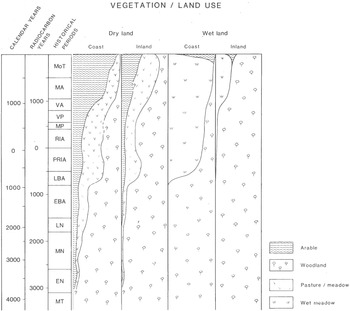
An Early Neolithic boom-and-bust pattern was observed as early as the 1960s in southern Swedish pollen diagrams (Berglund, Reference Berglund1969), and again in the pollen diagrams of the Ystad Project in southern Scania published in the early 1990s (Figure 7; Berglund et al., Reference Berglund, Larsson, Lewan, Olsson, Skansjö and Berglund1991). Several pollen diagrams showed a decrease in human impact indicators some hundred years after the Early Neolithic agricultural expansion, together with an increase in tree-pollen percentages. It was referred to as ‘the Middle Neolithic forest regeneration phase’ and was interpreted by Berglund (Reference Berglund1969) as a decline in human impact and a concentration of settlements on the coast. For the province of Blekinge, he concluded that: ‘… stock-raising and agriculture were brought to the area for a very short time. Possibly cultures with these sources of livelihood did not occur within this area at the beginning of the Middle Neolithic period. At the coast, fisher and hunter cultures may have been left but it is not possible to trace their activity in the diagrams. Also, in other areas of southern Sweden and perhaps even Norway, the diagrams indicate a regression of the new livelihood after the landnam period’ (Berglund, Reference Berglund1969: 22).
Summary of the pollen diagrams from The Ystad Project, southern Scania (after Berglund et al., Reference Berglund, Larsson, Lewan, Olsson, Skansjö and Berglund1991). Note that the calibrated time scale in this figure is non-linear. Reproduced by permission of Björn E. Berglund.

This conclusion was later questioned by Göransson (Reference Göransson1988, Reference Göransson1991), who interpreted the increase in tree-pollen percentages not as agricultural decline but as a shift to intensely managed coppice woodlands. Our study appears to support the original interpretation by Berglund. Together, decreased agricultural impact on the vegetation, inferred from pollen data, and decreased settlement activity, inferred from the SPDs, suggest decreased population numbers at around 3600–3300 cal bc.
Bronze Age–Early Iron Age expansion
After the Early Neolithic boom-and-bust, the SPD increases slowly throughout the Middle and Late Neolithic, to reach a peak at 2000 cal bc, followed by a decline around the Late Neolithic/Early Bronze Age transition in c. 1900–1600 cal bc (Figure 2). This temporary decline is followed by a very strong and steady increase in the SPD, which indicates a long-lasting period of settlement expansion and population increase between 1500 cal bc and cal ad 200 (Early Bronze Age to Roman Iron Age).
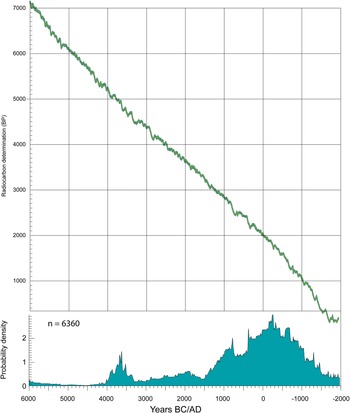
Two temporary peaks at 800 and 400 cal bc, respectively, coincide with steep parts of the calibration curve (Figure 8), which in turn fringe a plateau, the so-called Hallstatt plateau (Reimer et al., Reference Reimer, Austin, Bard, Bayliss, Blackwell and Bronk Ramsey2020). Previous studies have shown that steep parts of the radiocarbon calibration curve produce narrow peaks in summed probability plots (Williams, Reference Williams2012). Hence, these two peaks probably reflect changes in atmospheric 14C rather than sudden changes in settlement activity. Whether the trough between them is also an artefact of the calibration curve or whether it represents a temporary drop in settlement activity is not clear and would need more advanced data handling to resolve.
SPD for all dates from 6000 cal bc to the present compared with the calibration curve (IntCal20: Reimer et al., Reference Reimer, Austin, Bard, Bayliss, Blackwell and Bronk Ramsey2020) for the same time interval.

Apart from the irregularities linked to the Hallstatt plateau, the SPD gives the impression of expansion throughout this long period of about 1700 years. The radiocarbon evidence may be compared with published pollen diagrams and vegetation-cover reconstructions from southernmost Scania (Berglund et al., Reference Berglund, Larsson, Lewan, Olsson, Skansjö and Berglund1991; Hellman, Reference Hellman2008; Lagerås & Fredh, Reference Lagerås and Fredh2019). They indicate a quite sharp deforestation in the middle of the Bronze Age, which created a semi-open landscape used primarily for grazing (Figure 7). In contrast to this sudden increase in open landscapes, arable land showed a more gradual expansion throughout the Late Bronze Age and Iron Age, indicating a progressive increase in cereal cultivation in relation to animal husbandry. Since cereal cultivation is more land-productive (i.e. a higher food productivity per unit area) than animal husbandry (Redman, Reference Redman1999), this relative increase in cereal cultivation probably reflects population growth and increased settlement density, similar to the gradual increase in the SPD.
In Figure 3, an SPD that was corrected for multiple datings of the same phases at individual sites is compared to the total (uncorrected) SPD. In the early phase of expansion, in 1500–800 cal bc, before the Hallstatt plateau, both graphs show an increase in the frequency of dates. After the plateau, from 400 cal bc onwards, the graph of the corrected SPD flattens out, whereas the total SPD continues to increase to reach a peak in the Roman Iron Age, at c. cal ad 200. Even though the numbers in this context refer to the frequency of archaeological sites, which do not necessarily equate with prehistoric habitation sites, the difference between the two graphs indicates a shift, with an early phase characterized by the establishment of many new settlements, and a later phase characterized by increased settlement activity on already established sites. At least this seems to have been the situation in the most densely occupied plains of south-western Scania.
Additional information on this expansion is provided in Figure 4, where differences in the temporal distribution between hearths, pits, longhouses, and clearance cairns seem to reflect a gradual change in the character of settlement. Hearths provide the most common dates in the initial stage of the expansion and peak in the middle of the Bronze Age, in c. 1200–800 cal bc. Sites characterized by numerous hearths are well known from the Bronze Age. Some have been interpreted as ritual sites (Björk, Reference Björk1998) and some as the remains of temporary habitation linked to herding (Petersson, Reference Petersson2006). The peak in dated hearths coincides with the deforestation and strong expansion of semi-open grasslands in the middle of the Bronze Age, inferred from pollen data (see above), which may support the interpretation of herding sites.
Dates from pits are also relatively common in the initial phase of expansion, but they peak later, in the Early Iron Age, between c. 400 and 0 cal bc. Large pits and pit systems are generally interpreted as resulting from clay extraction for wattle and daub, even though most pits also had a secondary function as pits for waste, or storage, or other purposes. Pits became fewer and smaller from the Roman Iron Age onwards, indicating new building techniques with less use of clay for daub, as timber-built walls replaced them (see Ethelberg, Reference Ethelberg, Ethelberg, Hardt, Poulsen and Sørensen2003).
The temporal distribution of dates from longhouses differs markedly from that of the hearths and pits. Even though some longhouses are dated to the initial phase of the expansion, the strong expansion of longhouses took place later, mainly during the Pre-Roman Iron Age, leading to a pronounced peak in the Roman Iron Age, in c. cal ad 0–200. Bearing in mind the comparison between the corrected SPD and total SPD, the strong increase in the number of dates from longhouses in c. 400 cal bc–cal ad 200 seems to reflect increased building density, rather than the expansion of settlement into new territories. High building density is also reflected in the first appearance of permanent boundaries (fences) between settlement units, dated to c. 100 cal bc in south-western Scania (Friman, Reference Friman2008).
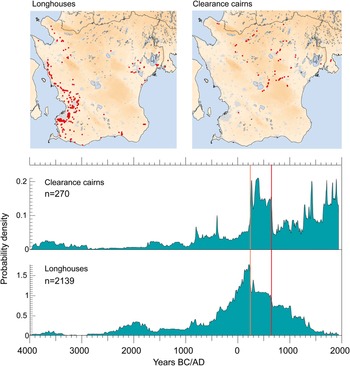
In contrast to hearths, pits, and longhouses, which are usually preserved beneath the topsoil in modern agricultural areas, clearance cairns are found on stony ground in wooded uplands, i.e. in areas that are marginal for modern agriculture. These heaps of stones, still visible on the surface, were the result of clearing arable land, and they originated over a long period, from the Bronze Age up to modern times (Lagerås & Bartholin, Reference Lagerås and Bartholin2003). The dates from clearance cairns in this study show a distinct peak at c. cal ad 200–600, immediately after the peak in longhouse dates (this temporal relationship is highlighted by a close-up in Figure 9). It indicates that the expansion in central settlement areas, which reached a peak around cal ad 200, was succeeded by an expansion of settlement and agriculture into marginal upland areas. Probably, the densification of settlement in central areas at that point had reached its ceiling.
SPDs for the Clearance cairn and Longhouse categories, 4000 cal bc to the present. Vertical lines added to highlight the chronological relationships in the third and seventh centuries ad. The maps show the distribution of all sites with radiocarbon-dated longhouses and clearance cairns, respectively.

To conclude, we may distinguish three stages of the Bronze Age–Early Iron Age expansion. The first stage, between c. 1500 and 400 cal bc, was characterized by settlement expansion, probably connected to a pastoralist economy. The second stage, in c. 400 cal bc–cal ad 200, saw settlement densification (internal expansion), particularly on the fertile plains. This process of densification was connected to a gradual shift from animal husbandry to cereal growing. The third stage, in c. cal ad 200–600, was characterized by expansion into upland areas, where sparse settlement enabled extensive animal husbandry combined with cereal growing on stone-cleared fields. Possibly, stagnation in central areas was a factor behind this expansion.
Late Iron Age decline
Indications of a societal crisis and a population drop in northern Europe during the Nordic Late Iron Age have long been debated (e.g. Näsman & Lund, Reference Näsman and Lund1988), with causes such as the fall of the West Roman Empire, the Justinian Plague (Harbeck et al., Reference Harbeck, Seifert, Hänsch, Wagner and Birdsell2013; Sarris, Reference Sarris2022), and, particularly, climate change due to volcanic eruptions in the sixth century ad (Sigl et al., Reference Sigl, Winstrup, McConnell, Welten, Plunkett and Ludlow2015; Büntgen et al., Reference Büntgen, Myglan, Ljungqvist, McCormick, Di Cosmo and Sigl2016) being cited. Several studies have shown that a dust veil from large-scale volcanic eruptions during the sixth century ad, particularly in ad 536, 540, and 547, resulted in the cooling of the Northern Hemisphere on a global scale (Larsen et al., Reference Larsen, Vinther, Briffa, Melvin, Clausen and Jones2008; Sigl et al., Reference Sigl, Winstrup, McConnell, Welten, Plunkett and Ludlow2015; Büntgen et al., Reference Büntgen, Myglan, Ljungqvist, McCormick, Di Cosmo and Sigl2016; Toohey et al., Reference Toohey, Krüger, Sigl, Stordal and Svensen2016). In addition to severe short-term (decadal) effects due to the dust veil, other factors such as sea-ice feedbacks and a solar minimum may have contributed to a longer period of low temperatures between c. ad 536 and 660, referred to as the Late Antique Little Ice Age (Büntgen et al., Reference Büntgen, Myglan, Ljungqvist, McCormick, Di Cosmo and Sigl2016). The dust veil of ad 536 is mentioned in ancient written sources from the Mediterranean, and in Scandinavia it has been tentatively connected to the myth of the Fimbulwinter of the Poetic Edda (Gräslund & Price, Reference Gräslund and Price2012).
In the archaeological record, some data indicate that settlements were abandoned and the population dropped in the sixth and seventh centuries. For example, a study in eastern-central Sweden suggested that the number of occupied habitation sites fell by 75 per cent in the sixth century (Göthberg, Reference Göthberg and Göthberg2007), and another study, also of central Sweden, showed large-scale abandonment of burial grounds (Löwenborg, Reference Löwenborg2012). Similar indications of extensive abandonment of settlement sites are also suggested for southern Norway (Solheim & Iversen, Reference Solheim, Iversen, Brady and Theune2019). A study of summed radiocarbon dates from clearance cairns, mainly from the province of Småland in southern Sweden, showed a decline in stone clearance in cal ad 400–800 (Lagerås, Reference Lagerås2013). Palynological studies from the southern Swedish uplands have shown that cereal cultivation at several sites ceased in the sixth century ad, in most cases not to be re-introduced until the twelfth century or later (Lagerås, Reference Lagerås1996, Reference Lagerås2007; Fredh et al., Reference Fredh, Lagerås, Mazier, Björkman, Lindbladh and Broström2019). In the present study, the total SPD shows an irregular but decreasing trend between cal ad 200 and 1000 (Figure 2); the decrease continues even further, but after ad 1000 the number of dates underestimates human activity due to less frequent use of radiocarbon dating in archaeology of the last millennium. There is, however, variation between the different types of features (Figure 5). Dates from pits and hearths show little decline in frequency, whereas those from longhouses and clearance cairns show a sharp decline. Pithouses show increasing date frequency in cal ad 400–800, which to some degree compensates for the decrease in longhouse dates. Pithouses, however, are usually not interpreted as ordinary dwelling houses, but rather as storehouses or buildings connected to craft activities, and larger concentrations of pithouses may be connected to trade (Sabo & Söderberg, Reference Sabo and Söderberg2019).
A comparison between the SPDs for longhouses and clearance cairns can prove useful since they represent different environments (Figure 9). Around cal ad 200, the SPDs show a decline of longhouse dates but a strong increase of clearance cairn dates. By around cal ad 650, however, the SPDs for both these categories show a sharp decline. This synchronous decline in both central and marginal agriculture areas around cal ad 650 probably reflects a population drop. Upland areas that had been relatively recently colonized were abandoned, and central agricultural areas witnessed a thinning out of settlement. However, the interpretation of central areas is ambiguous. The religious and political centre of Uppåkra in south-western Scania seems to have developed and thrived throughout this period (Larsson, Reference Larsson2019). Also, other types of features than longhouses do not show the same decline, and some even increase (e.g. pithouses). Yet, we tentatively consider the number of dated longhouses as the best indication of population size in the central agricultural areas (Figure 5; note that the longhouses have a much higher n-value than the pithouses).
Hypothetically, the population drop around cal ad 650, indicated by the SPDs, may have been a (somewhat delayed) effect of the volcanic events and possibly the plague of the sixth century, even though the causal relationships are probably complex.
Concluding Remarks
The SPDs presented in this article provide a basis for discussing long-term trends in human population and settlement in southernmost Sweden and for comparison with similar studies from other parts of northern and western Europe. Although there is probably no linear relationship between the number of dates and population numbers, we believe that the large-scale and most striking trends revealed by the SPDs do reflect changes in settlement activity and population. This conclusion is supported by the general agreement with the degree of openness of the landscape as revealed by published pollen data. We also believe that these broad patterns are not affected by irregularities in the calibration curve; studies of more subtle or short-term changes in the SPDs would need a more technical approach to distinguish relevant changes from noise.
Many questions obviously remain regarding the relationship between population size and the number of radiocarbon dates from archaeological contexts. Even if there is a general positive relationship between the two, one would expect different economies, cultures, and lifestyles to produce different amounts of features that can be radiocarbon-dated. A particularly interesting question in this respect is the possible difference between hunter-gatherers and early farmers. Does the very low SPD by the end of the Mesolithic give a true picture of a very sparse population just before the introduction of agriculture? Or does the hunter-gatherer lifestyle result in an underrepresentation in radiocarbon dates when compared to agricultural communities? An important aspect is that contract archaeology in Sweden is largely based on topsoil machine stripping of modern arable land. Only features originally dug deep enough to be preserved below the modern ploughsoil can thus be investigated and dated. If, hypothetically, hunter-gatherers (and perhaps pastoralists) left lighter or shallower traces than agriculturalists, their settlements may be underrepresented in the radiocarbon-dated record. The more sedentary lifestyle of farming communities may result in more substantial (and hence detectable) settlement remains.
The bias in contract archaeology for investigations in densely settled areas on rich soils warrants further consideration. Such areas appear to have been attractive to early farmers, but perhaps less so to Mesolithic societies, which may have favoured coastal areas, wetlands, or light sandy soils. Since very few infrastructure projects have been conducted in wetlands, on lake shores, and in coastal environments, Mesolithic sites are probably underrepresented. Similarly, among farming communities, there may have been different environmental preferences in different periods, such as variation in the relationship between crop growing and animal husbandry, which may affect their representation in the archaeological record. These and similar questions regarding representativity need to be addressed in future research.
Acknowledgements
This study was supported by a grant from the Lennart J. Hägglunds Stiftelse.
Supplementary Material
To view supplementary material for this article, please visit https://doi.org/10.1017/eaa.2022.43.