HispanicsFootnote 1 are the largest and fastest-growing minority group in the United States today. The rapid growth of the Latino population across the United States has captured significant attention from scholars, the media, and politicians. Scholars have long lamented that the political potential of the Latino population has gone untapped (de la Garza and DeSipio Reference de la Garza and DeSipio2004; Sánchez Reference Sánchez2007). However, the media, pundits, and analysts have consistently touted the increasing influence of Latinos in local, state, and national politics (Ramos Reference Ramos2005). Indeed, the high degree of media attention may contribute to rising concerns among the general population about the impact of Latinos on politics, culture, and the economy, which in turn have prompted significant legislative action (Smith and Furuseth Reference Smith and Furuseth2006) at both the state and local levels.Footnote 2
Latino population growth will have important implications for the congressional redistricting decisions that will be made following the 2010 decennial census. In addition to traditional Hispanic destinations such as Florida and Texas, many of the areas that are experiencing the most rapid growth in Hispanic population are nontraditional destinations in southern states. Georgia, North Carolina, and Virginia are home to three of the five largest metropolitan areas with the fastest-growing Hispanic populations (U.S. Census Bureau 2010). Latinos have also migrated to nontraditional destinations in the Midwest and the Northeast and are now a ubiquitous presence throughout the entire United States. Given these demographic trends, the purpose of this article is to examine the potential impact of Latinos on the electoral geography of the southern United States after the 2010 decennial census. We are particularly interested in two questions: (1) Where are Latino majority-minority voting districts likely to emerge in southern states? (2) Where are Latino influence districts likely to emerge in southern states?
We argue that although the Latino population has increased significantly in southern states, it remains relatively small in comparison to the total population. Even in states where the Latino population has grown significantlyFootnote 3 in absolute and relative terms, Latinos are still too dispersed across counties to make the creation of majority-minority districts possible. As a result, we make three predictions: First, it will be impossible for Latinos to produce majority-minority or influence districts at any level in Louisiana, Mississippi, South Carolina, and Tennessee. Second, although it is unlikely that majority-minority and influence districts at the congressional level will emerge in Arkansas, Georgia, North Carolina, and Virginia, it is likely that these districts will emerge at the state and local levels. Third, because Latinos make up a significant proportion of the total population and are concentrated in densely populated counties in Florida and Texas, new majority-minority and influence districts at the national, state, and local levels are likely to emerge in these states. In short, the evidence suggests that Latinos have yet to transform demographic potential into political power across the southern United States.
In this article, we first describe the growth of the Latino population in the United States in general and in southern states in particular. In the second section, we review the most important sections of the Voting Rights Act; discuss the importance of Georgia v. Ashcroft in terms of introducing influence districts as a possible alternative element in redistricting considerations; and argue that despite a recent congressional “fix,” the concept of influence districts is likely to emerge as an important redistricting standard. Finally, using geographic information systems (GIS) and U.S. census population projections data, we show where majority-minority districts and influence districts are likely to emerge in southern states after the 2010 decennial census.
HISPANIC POPULATION GROWTH IN SOUTHERN STATES
U.S. census figures show that the U.S. Latino population has grown from approximately 14.7 million in 1980 to approximately 48.4 million in 2010. Latinos are a diverse group that includes both immigrants and U.S.-born persons with origins in every country in Latin America. According to Census Bureau and Pew Hispanic Center country-of-origin profiles, the 10 largest foreign-born Latino populations come from Mexico, Puerto Rico, Cuba, El Salvador, the Dominican Republic, Guatemala, Colombia, Honduras, Ecuador, and Peru.Footnote 4 Of these populations, the three largest groups are Mexicans, Puerto Ricans, and Cubans, who comprise approximately 66%, 10%, and 5% of the overall Latino population in the United States, respectively (U.S. Census Bureau 2010). The other seven groups combined comprise about 19% of the total Hispanic population. Traditionally, Mexicans have settled in Texas, California, New Mexico, and Illinois; Puerto Ricans in New York; and Cubans in Florida and New Jersey. Within these states, Houston, Los Angeles, Albuquerque, Chicago, New York City, Miami, and Newark are among those U.S. cities with the largest Hispanic populations.
Recently, however, Latinos have begun to settle in nontraditional destinations across the Midwest, the Northeast, and the Southeast (Massey Reference Massey2010; Millard and Chapa Reference Millard and Chapa2004; Odem and Lacy Reference Odem and Lacy2009; Singer Reference Singer2004; Suro and Singer Reference Suro and Singer2002; Smith and Furuseth Reference Smith and Furuseth2006; Torres Reference Torres2006; Zúñiga and Hernández-León Reference Zúñiga and Hernández-León2005). Nontraditional destinations include Alabama, Arkansas, Georgia, Louisiana, Mississippi, North Carolina, South Carolina, Tennessee, and Virginia. Some of the fastest-growing destinations for Hispanics are located in these southern states.Footnote 5
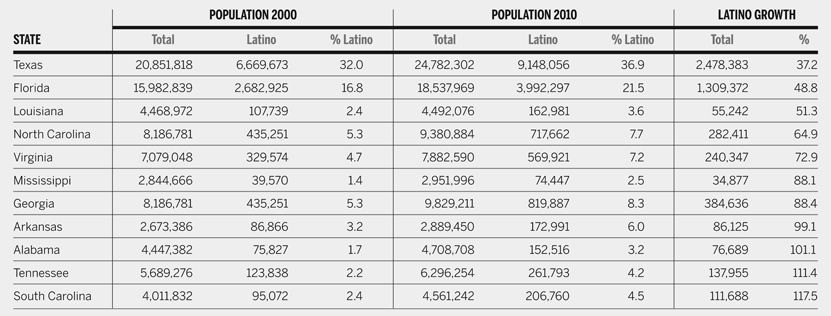
Table 1 shows that between 2000 and 2010, the Latino population in every nontraditional southern state increased by more than 50%. In Alabama, Tennessee, and South Carolina, the Latino population increased by over 100%. It is interesting to notice that in Texas and Florida, both traditional destinations, the Latino population grew at lower rates: 37.2% and 48.8%, respectively. It is also interesting to note that the total Latino population increased more in Texas than in all nontraditional states combined. As the following sections will show, these different growth rates will have important implications for redistricting.
Latino Population Growth in Southern States, 2000–10

Source. U.S. Census Bureau
THE VOTING RIGHTS ACT
The Voting Rights Act (VRA) was a monumental legislative achievement aimed at redressing discriminatory electoral practices throughout the Unites States and particularly in southern states where the legacy of slavery and Jim Crow laws was severely detrimental to black voters. Since its enactment, the VRA has been amended and reauthorized in 1975, 1982, and 2006, and is due for reauthorization in 2031.
The VRA has three key sections. Section 2 prohibits the creation of prerequisites, standards, or practices that lead to the denial or abridgement of people's right to vote throughout the United States, a practice that is also known as voter dilution. In Thornburg v. Gingles (1986), the U.S. Supreme Court established a three-part test—the-totality-of-circumstances test—for determining voter dilution. Section 2 applies to all states and is permanent law that does not expire or require future congressional reauthorization.Footnote 6
Section 4 establishes criteria for identifying jurisdictions where voter discrimination has been particularly egregious and where special provisions or remedies therefore need to be implemented and enforced. It also includes provisions that guarantee linguistic minorities the right to vote in their own language. Finally, it establishes the criteria by which states may be exempted from those special provisions. As of 2010, nine states are entirely or almost entirely included under the Section 4 coverage formula: Alabama, Alaska, Arizona, Georgia, Louisiana, Mississippi, South Carolina, Texas, and Virginia. California, Florida, Michigan, New Hampshire, New York, North Carolina, and South Dakota are only partially covered.
Section 5 requires covered jurisdictions to undergo a process known as “preclearance” before enacting any changes to electoral practices. This process requires the covered jurisdictions to demonstrate to the federal government (either the U.S. Attorney General or the U.S. District Court for the District of Columbia) that any changes to electoral practices—including redistricting changes constitutionally mandated after each decennial census—will not “lead to a retrogression in the position of racial minorities with respect to their effective exercise of the electoral franchise” (Beer v. United States 1976, 425). Originally, “retrogression” referred to the effects of discriminatory practices or the kind of redistricting plans that diluted the voting power of African Americans in southern states prior to the enactment of the VRA. Today, retrogression refers to the effects of electoral changes that diminish the political influence of minorities from preexisting levels. For example, in Georgia, a new redistricting plan cannot put Latinos in a worse position than they are under an existing plan or diminish their ability to elect their candidate of choice below the current benchmark.
GEORGIA V. ASHCROFT AND INFLUENCE DISTRICTS
Georgia v. Ashcroft is arguably the most important related case decided after the 2000 decennial census. In 2001, the Georgia General Assembly approved a new redistricting plan that would have created several “influence districts” while holding the number of majority-minority districts constant. Whereas the population of a majority-minority district is over 50% minority, the population of an “influence district” may be less than 50% minority. Democratic legislators in both the Georgia House of Representatives and the Georgia Senate supported the new redistricting plan almost unanimously, but Republican representatives and senators, as well as the Republican governor, opposed the plan on the grounds that it caused retrogression and therefore violated Section 5 of the VRA.
The State of Georgia requested judicial preclearance from the U.S. District Court for the District of Columbia by arguing that the proposed changes did not cause retrogression and therefore did not violate Section 5 of the VRA. However, the District Court denied preclearance, because it found that the black voting-age population percentages in three districts had been reduced below their preexisting levels. That is, the state of Georgia reported the existing percentages of black voting-age population in Districts 2, 12, and 26 to be 60.4%, 55.4%, and 66.4%, respectively. However, under the new redistricting plan, the black voting-age population percentages were going to be 50.3%, 50.7%, and 50.8%, respectively (Georgia v. Ashcroft 2003).
The impact of majority-minority districts on descriptive representation is undisputed. When minorities have the opportunity to elect a minority candidate, they usually prefer a co-ethnic candidate to a candidate from a different ethnic group. However, a lively debate has emerged about the implications of majority-minority districts for substantive representation (Cameron, Epstein, and O'Halloran Reference Cameron, Epstein and O'Halloran1996; Canon Reference Canon1999; Lublin Reference Lublin1999). The impact of influence districts on both descriptive and substantive representation, however, is still unknown. Despite insufficient knowledge about their impact, state courts have used a 25% black voting-age population (BVAP) standard to define influence districts,Footnote 7 and scholars have found that “in the south the required level of BVPA is 40.3%” (Cameron, Epstein, and O'Halloran Reference Cameron, Epstein and O'Halloran1996, 804).Footnote 8 Citing these judicial and scholarly sources, Justice O'Connor defined an influence district as a district “where minority voters may not be able to elect a candidate of choice but can play a substantial, if not decisive role in the electoral process” (Georgia v. Ashcroft 2003, 18).
Writing for a 5-4 majority, Justice O'Connor held that “as long as the proposed redistricting plan—taken as a whole—did not produce retrogression, the proposed plan would meet preclearance under Section 5 of the Voting Rights Act of 1965, even if the new plan contained one, or more than one, district with less than a majority-minority VAP” (Georgia v. Ashcroft 2003, 12). Thus, an important consequence of applying the totality-of-the-circumstances test was the acceptance of influence districts as either a complement or an acceptable alternative to majority-minority districts. This decision may have important implications for Latinos living in nontraditional southern states, because although Latino populations in most districts will not be large enough to produce a majority-minority district, they might be large enough to produce an influence district.
As a result of much criticism from redistricting experts, in 2006, Congress introduced an amendment to Section 5 with the clear intent of addressing Justice O'Connor's ruling and particularly the use of “influence districts.” Although the amendment to Section 5(3)(b) of the VRA explicitly states that the purpose of Section 5 “is to protect the ability of [U.S.] citizens to elect their preferred candidates of choice,”Footnote 9 this congressional fix does not prohibit future redistricting planners from creating influence districts, as long as they do not violate the retrogression standard.Footnote 10 In light of the Supreme Court's recognition of influence districts as a possible alternative to majority-minority districts, and given the growth of the Latino population in southern states, where they make up less than 20% of the population in most counties, we seek to answer the following questions: Where are majority-minority Latino voting districts likely to emerge in southern states? Where are influence districts likely to emerge in southern states?
DATA AND ANALYSIS
This article aims to examine the potential impact of Latinos on the electoral geography of the southern United States after the decennial census. Therefore, we rely on U.S. Census Bureau data, which contain population estimates by age, ethnicity, and race for all counties in the United States. The population data for counties in the states of Alabama, Arkansas, Florida, Georgia, Louisiana, Mississippi, North Carolina, South Carolina, Tennessee, Texas, and Virginia were placed into U.S. Census Bureau Tiger Files using the ArcView GIS program. Maps showing overall population, Hispanic population, and percentage Hispanic population for each county in the aforementioned states were developed. The maps were analyzed to identify counties and clusters of counties in which the Hispanic population exceeded 10%. In light of the Georgia v. Ashcroft ruling, we paid particular attention to counties with a Latino population between 20% and 50% because of their potential to produce influence districts. Current congressional boundaries at the U.S. and state levels were then overlaid to identify congressional districts where concentrations of Hispanic populations are high enough to warrant careful attention during the upcoming redistricting process.
Latino Population Growth across Southern States
Figure 1 shows that the majority of the U.S. Latino population—in both absolute and relative terms—is located in traditional Latino destination states. The figure also reveals that the counties with the largest relative Latino populations are often not the counties with the largest absolute Latino populations. In addition, counties with the largest absolute Latino populations—Harris and Bexar in Texas, for example—are usually not contiguous. As is discussed later, these patterns diminish the likelihood of Latino majority-minority or influence districts emerging.
Total Latino Population and Percent Latino Population, 2010
Source. U.S. Census Bureau, maps by author

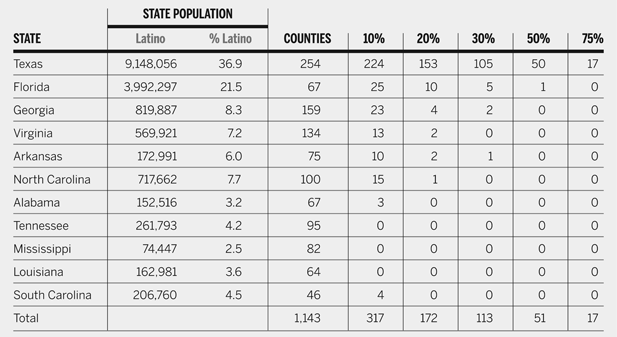
Table 2 shows a total of 172 southern counties with over 20% Latino population, the majority of which lie in traditional destination states. Nine counties in four nontraditional Latino destination states—Arkansas (two counties), Georgia (four counties), North Carolina (one county), and Virginia (two counties)—have a relative Latino population greater than 20%. Only three counties—two in Georgia and one in Arkansas—have relative Latino populations greater than 30%. In Texas, 153 counties have Latino populations greater than 20%; 105 have Latino populations greater than 30%; 50 have Latino populations greater than 50%; and 17 have Latino populations greater than 75%. In only 10 counties in Florida does the relative Latino population exceed 20%; in five, it exceeds 30%; and in only one does it exceed 50%. Much of the analysis that follows, therefore, will be focused on Georgia and Texas.Footnote 11
Latino Population by State and Counties over 10%, 2010

Source. U.S. Census Bureau and author calculations.
Latino Population Growth in Nontraditional States: Georgia
In Georgia, Hispanics make up 8.3% of the total state population, and while most counties average 5% Hispanic population, the 10 counties with the largest relative Hispanic populations average 20% Hispanic population. Figure 2 shows the 10 counties with the largest absolute Hispanic populations in Georgia. Of those counties, seven are located in the Atlanta metropolitan area, which boasts a total Latino population of 473,652 (57.8% of total metropolitan population); and three lie in rural areas, which contain a total Latino population of 83,615 (10.2% total population). The remaining 32% of the Latino population in Georgia is scattered throughout the state in predominantly rural counties with low population densities.
Ten Counties with Largest Absolute Hispanic Population, Georgia
Source. U.S. Census Bureau, map by authors

Figure 3, however, shows that of the 10 Georgia counties with the largest relative Hispanic populations, only Gwinnett (17.97%) and Clayton (12.24%) are in the Atlanta metropolitan area and the populations in both are well below 20%. The other eight counties with the largest relative Hispanic populations are scattered throughout the state. Moreover, the four counties that boast the largest relative Hispanic populations are all rural. More specifically, although Latinos make up over 20% of the total population in Whitfield, Echols, Hall, and Atkinson Counties, those regions are not part of the Atlanta metropolitan area, but are rural, with small total populations. Additionally, figure 3 shows that the Georgia counties where the Hispanic population is greater than 20% are not contiguous. This distribution is important to notice, because current legal redistricting standards and the group's geographic dispersion make it impossible to pool the populations of the largest Hispanic counties to create influence districts. Figures 3 and 4 also show that those four counties are divided equally among the Congressional First District and the Ninth District. Whitfield and Hall are located in the northern part of the state, while Echols and Atkinson are located in the southern part. Both the geographic locations and the small populations of these counties have important implications for redistricting purposes, because even if combined, the Hispanic populations of these counties would comprise less than 20% of the total populations of their U.S. congressional districts.
Ten Counties with Largest Relative Hispanic Population, Georgia
Source. U.S. Census Bureau, map by authors

Total Hispanic Population and Congressional Districts, Georgia
Source. U.S. Census Bureau, map by author

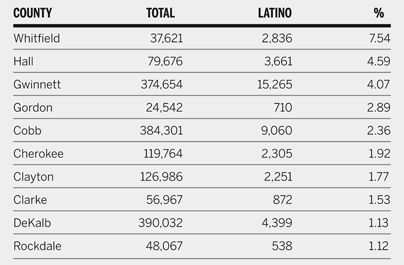
Moreover, table 3 shows that as a percentage of registered voters, Hispanics make up only a miniscule proportion of voters in those counties where the relative Hispanic population is at least 20%. Latinos in Whitfield and Hall Counties, which contain the largest relative Latino populations, only comprise 7.54% and 4.59% of registered voters, respectively. The low voter registration rates among Latinos in Georgia reflect the fact that over 50% of this population are noncitizens or under 18 years of age (U.S. Census Bureau 2010). As a result, Latino voter turnout is inevitably very low as well. Even if turnout reaches 100%, the Latino vote will still have a negligible impact on electoral outcomes because of extremely low voter registration rates—even in those counties with the largest absolute Latino populations, such as Gwinnett County (4.07%). As a result, even if current population growth trends continue, low voter registration rates will pose yet more obstacles on the road from potential to actual Hispanic political power.
Latino Registered Voters in Georgia, 2010

Source. Georgia Secretary of State
At the state level, however, Latinos make up a larger proportion of state districts and are more concentrated. Figure 4 shows that seven of the 10 counties with the largest absolute Latino populations are contiguous and located in the Atlanta metropolitan area, which contains the most congressional districts at all levels (U.S., State House, and Senate). Moreover, state congressional districts are much smaller in geographical size and population than U.S. congressional districts. Whereas the ideal population for current U.S. congressional districts is 629,727 persons, the ideal populations for state senate and house districts are 146,187 and 45,480 persons, respectively. Thus, given the smaller population requirement for state districts and the high concentration of Latinos in the Atlanta metropolitan area, it is very likely that new Latino majority-minority or influence districts will emerge from this area; currently, 10 will likely emerge from the metropolitan area alone, and at least two more may emerge from Whitfield and Hall Counties. Therefore, at the state level, Latinos are likely to gain more congressional influence than they currently possess. In Georgia, three Latino elected officials currently sit in the Georgia General Assembly, two of whom come from those counties with the second and third largest absolute Latino populations in the state. However, an important caveat is in order here. Despite the potential for Latino demographic growth to be transformed into political power in the Georgia General Assembly, low relative populations in U.S. congressional districts, wide dispersion throughout the state's 13 congressional districts, high percentages of foreign-born individuals, low voter registration rates, and low voter turnout rates may severely undermine the ability of Latinos to capitalize on their demographic potential.
Latino Population Growth in Other Nontraditional States
Despite recording some of the highest growth rates in southern states, the Latino population in North Carolina has grown only marginally in relation to the total state population. North Carolina has a total Latino population of 717,662, or 7.7% percent of the overall state population. Unlike Georgia, where the majority of the Latino population is concentrated in counties in the Atlanta metropolitan area, the majority of the Latino population in North Carolina is scattered across the five counties that contain the largest cities in the state: Mecklenburg County (Charlotte), Wake County (Raleigh), Forsyth County (Winston-Salem), Durham County (Durham), and Guilford County (Greensboro). This pattern makes it very unlikely that a majority-minority or influence district at the U.S. level will emerge in North Carolina. However, at the state level, it is likely that new districts will emerge in those counties with the largest absolute Hispanic populations. That is, Raleigh-Durham, Charlotte, and even Winston-Salem are each likely to produce at least one majority-minority or influence district.
South Carolina exhibits a similar pattern to North Carolina, although on a much smaller scale. That is, the county with the largest absolute population contains only 36,379 Latinos, and the average county's population is only 3.9% Latino. These figures make it virtually impossible for a new district to emerge in South Carolina at any level. Virginia exhibits a similar pattern to Georgia, but also on a smaller scale. In Virginia, the counties with the largest absolute Latino populations (Fairfax and Arlington Counties and the City of Alexandria) are concentrated in the D.C. metropolitan area. This area is densely populated, and Latinos do not make up even 20% of the population in any of its districts, making it unlikely that a majority-minority or influence district will emerge any time soon. Even at the state level, it will be unlikely that a majority-minority or influence district will emerge.Footnote 12
In Arkansas, the Latino population has almost doubled since 2000. This impressive growth, however, belies the fact that Latinos make up only 6% of the total state population, and that the two districts where Latinos comprise more than 20% of the population are not contiguous. In combination, these factors make it very unlikely that a minority-majority district will emerge at the U.S. level in Arkansas. At the local level, however, at least one influence district may emerge at the state level. Similarly, in Alabama and Tennessee, the Latino population reached some of the highest growth rates between 2000 and 2010: 101% and 111%, respectively. In these states, however, no county contains a relative Latino population above 10%. Finally, Louisiana and Mississippi offer a stark contrast in terms of Latino population growth. In Louisiana, the Latino population grew 51% between 2000 and 2010, and in Mississippi, the Latino population grew 88% over the same decade. However, in absolute terms, the populations of these states grew by only 55,242 and 34,877, respectively. As a result, it will be virtually impossible for Latinos in these two states to impact redistricting at the U.S. or state level.
Latino Population Growth in Traditional States: Florida and Texas
Florida and Texas, which are traditional Latino destinations and already contain significantly larger Hispanic populations than nontraditional southern states, will likely increase their minority-majority districts at the U.S., state, and local levels. In Florida, 10 counties have relative Latino populations greater than 20%. In contrast to Georgia, where most counties with the highest relative and absolute Latino populations are neither the same nor contiguous, in Florida, six of the 10 counties that have the highest absolute Latino populations are also six of the counties that have the highest relative Latino populations. Moreover, these 12 counties in total are clustered in the south-central area of the state. This geographical configuration means that these counties are likely to produce new majority-minority or influence districts at the U.S. and state levels.
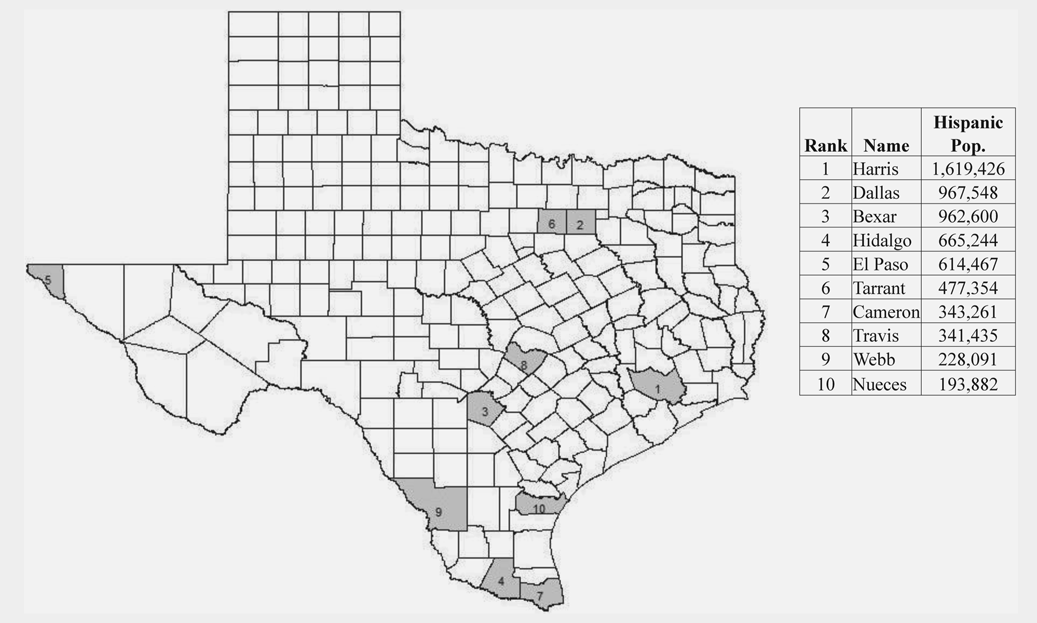
Texas shows a pattern that is similar to that of North Carolina but different from those of Georgia and Florida. As figures 5, 6, and 7 show, the 10 counties in Texas that contain the largest relative Latino populations are clustered along the U.S.–Mexico border in the southeastern corner of the state. Of these, only Hidalgo and Webb Counties are among the most populated counties in the state. However, eight of the 10 counties with the highest absolute Latino populations are scattered across some of the most densely populated metropolitan areas in the state: Harris County (Houston), Dallas County (Dallas), Bexar County (San Antonio), El Paso County (El Paso), Tarrant County (Fort Worth), Travis County (Austin), Webb County (Laredo), and Nueces County (Corpus Christi). This pattern is interesting, because the counties with the highest relative Latino populations contain only four U.S. congressional districts, whereas the largest metropolitan areas contain 21 congressional districts. For Latinos, this distribution means that despite significant population growth in counties along the U.S.–Mexico border, the majority of the Latino population is still clustered in high-density cities where the group comprises a smaller percentage of U.S. congressional districts (relative to other groups); as a result, we expect more influence districts than majority-minority districts to emerge in Texas.
Ten Counties with the Largest Absolute Hispanic Populations, Texas
Source. U.S. Census Bureau, map by authors

Ten Counties with the Largest Relative Hispanic Populations, Texas
Source. U.S. Census Bureau, map by authors

Total Hispanic Population, U.S. Congressional Districts, and Major Metropolitan Areas, Texas
Source. U.S. Census Bureau, map by author

At the state congressional level, Texas has fewer state senate districts (31) than U.S. congressional districts (32). The current ideal population for a Texas state senate district is 672,673, which exceeds the ideal population for a U.S. congressional district, currently set at 629,727. To the extent that Latinos have an impact at the U.S. congressional level, they might have a similar impact at the state senate level. At the state house level, however, Texas is divided into 150 state house districts, each with an ideal population of 139,012. These numbers mean that Latinos will have a significantly higher impact on this area of redistricting. Interestingly, the counties that contain the highest relative Latino populations comprise fewer state house districts than do the most densely populated metropolitan areas. Nonetheless, unlike U.S. congressional districts, the smaller ideal population for state house districts means that we can expect more majority-minority districts than influence districts to emerge from the most densely populated metropolitan areas.
CONCLUSION
Although the Latino population has increased significantly over the past three decades, the proportion of Latinos living in southern states remains relatively low in comparison to the states' general population, particularly in nontraditional Latino destination states such as Alabama, Arkansas, Georgia, Louisiana, Mississippi, North Carolina, Tennessee, and Virginia. Florida and Texas are the only southern states where new majority-minority districts are likely to emerge after the 2010 decennial census at the national and state level. It is unlikely that majority-minority districts will emerge in Arkansas, Georgia, North Carolina, and Virginia at the U.S. level, and it will be virtually impossible for new majority-minority districts to emerge in Alabama, Louisiana, Mississippi, South Carolina, and Tennessee at any level.
Our results are limited to population estimates and a geographical analysis of population growth in relation to U.S. congressional districts and state legislative districts. However, it is likely that Hispanic population growth in Arkansas, Georgia, North Carolina, and Virginia will produce majority-minority and influence districts at the state and local levels. Georgia in particular will likely produce at least 10 majority-minority or influence districts in the Atlanta metropolitan area. In short, the impact of Latino population growth on redistricting in southern states will be largely limited to traditional Latino destination states, which means that the demographic potential of the Latino community to affect legislative decision-making will not be fully realized in the decade following the 2010 census.