Introduction
There are several fineleaf fescues that provide desirable turf-quality characteristics, with each species offering unique use characteristics, management, or growth habits that distinguish it from the others in its anticipated site performance (Ruemmle et al. Reference Ruemmle, Wipff, Brilman and Hignight2003). While extensive variability exists within the genus, these grasses are known widely as an excellent low-input grassing alternative for turfed situations as diverse as ditchbanks to golf course roughs to cemeteries (Askew et al. Reference Askew, Goatley, Askew, Hensler and McKissack2013; Cavanaugh et al. Reference Cavanaugh, Watkins, Horgan and Meyer2011; Comes et al. Reference Comes, Marquis and Kelley1985). Given the renewed emphasis on environmental protection that accompanies turfgrass management, and the adaptability of fineleaf fescues to low-input management programs, the use of these species is likely to continue to expand (Cavanaugh et al. Reference Cavanaugh, Watkins, Horgan and Meyer2011).
Generally, little attention is paid to mowing and even less to crop protection products in low-input situations. In a perennial growth environment, unique weedy pest situations can develop. Glyphosate is a nonselective herbicide typically used by turfgrass professionals only on dormant turf, as a directed or spot-spray herbicide on actively growing grasses, or for renovation (Johnson and Ware Reference Johnson and Ware1978). Glyphosate-tolerant turfgrasses would provide a relatively low-cost, broad-spectrum weed control option, as well as a means of controlling weeds with resistance to other common turfgrass herbicides (Bradshaw et al. Reference Bradshaw, Padgette, Kimball and Wells1997). The fineleaf fescues were one of the first whole-plant selections for which biotypes demonstrated varying levels of tolerance to glyphosate (Bradshaw et al. Reference Bradshaw, Padgette, Kimball and Wells1997; Johnston et al. Reference Johnston, van Wijk and Kilpatrick1989). Bingham et al. (Reference Bingham, Segura and Foy1980) reported that 2-mo-old red fescue was moderately resistant to glyphosate at 0.14 kg ha−1 and 4-mo-old fescue tolerated 0.28 kg ha−1. In a broad study in Washington State evaluating the glyphosate tolerance of three varieties and 62 plant introductions of red fescue, Comes et al. (Reference Comes, Marquis and Kelley1985) reported that several ecotypes tolerated glyphosate levels up to 2.2 kg ha−1 in spring applications, but none tolerated more than 1.1 kg ha−1 in the fall. Breeders have used recurrent selection techniques to develop glyphosate-tolerant varieties of fineleaf fescues (Hart et al. Reference Hart, Derr, Lycan, Rose-Fricker and Meyer2005; Johnston et al. Reference Johnston, van Wijk and Kilpatrick1989). Hart et al. (Reference Hart, Derr, Lycan, Rose-Fricker and Meyer2005) reported that ‘Aurora Gold’ hard fescue that was developed through recurrent selection had less than 20% visible turf injury to glyphosate at 0.4 to 0.6 kg ae ha−1.
Previous research dealing with fineleaf fescue tolerance to glyphosate has evaluated only a few varieties among hard and red fescues (Bingham et al. Reference Bingham, Segura and Foy1980; Comes et al. Reference Comes, Marquis and Kelley1985; Hart et al. Reference Hart, Derr, Lycan, Rose-Fricker and Meyer2005). We hypothesized that hard fescue and red fescues would tolerate glyphosate at rates between 0.6 and 1.4 kg ae ha−1 and that fineleaf fescue tolerance to glyphosate would differ among species and varieties. The objectives of this study were to determine and compare the visible injury, turfgrass quality, normalized difference vegetative index (NDVI), and seed head formation responses to various levels of glyphosate of 56 named and experimental varieties of fineleaf fescues within Chewings fescue (CH), hard fescue (HF), sheep fescue (SF), strong creeping red fescues (STC), and slender creeping red fescue (SLC) species.
Materials and Methods
The study was conducted at the Turfgrass Research Center in Blacksburg, VA, on a Groseclose silt loam (fine, kaolinitic, mesic typic Hapludult) having a pH of 6.8 and phosphorus and potassium levels of 56 and 102 mg kg−1, respectively. Permission was obtained to use a 6-yr-old National Turfgrass Evaluation Program (NTEP) (Morris Reference Morris1997) fineleaf fescue variety trial (Table 1), and each variety plot was treated with four glyphosate rates. The study was conducted in a randomized complete block design with a split-plot treatment arrangement and three replications, similar to the study described by Rana and Askew (Reference Rana and Askew2016). Two experimental repetitions were conducted on the same main plots. The first study was conducted in 2011, and turfgrass mowing, fertilizer, and other inputs were continued in 2012. However, the study was not repeated until 2013 to avoid any possible legacy effects from the first trial. In addition, treated subplot orientation in 2013 was rotated perpendicular to that of the first experiment, and the subplot randomization was also changed. Main plots consisted of 56 varieties of fineleaf fescues, and subplots consisted of glyphosate (Roundup Pro® Concentrate Herbicide, Monsanto, St Louis, MO 63167) applied at 0, 0.4, 0.6, and 1.0 kg ae ha−1. Five species of fineleaf fescue were evaluated in this trial: CH, HF, SF, SLC, and STC (Table 1). Variety main plots were 1.8 by 1.8 m, and subplots were 0.4 by 1.8 m. The entire subplot was treated using a single-nozzle, CO2-pressurized backpack sprayer equipped with TTI 11004 nozzles (TeeJet® Technologies, Springfield, IL 62703), which delivered 281 L ha−1 of herbicide plus pH 7 water spray solution at 290 kPa. The studies were initiated on May 16, 2011, and June 26, 2013. All plots were mowed to a height of 12.7 cm approximately 5 wk before study initiation and not again for the duration of each year’s trial. Environmental conditions were similar between years and nonstressful; therefore, supplemental fertilizer, irrigation, and pest control were not needed.
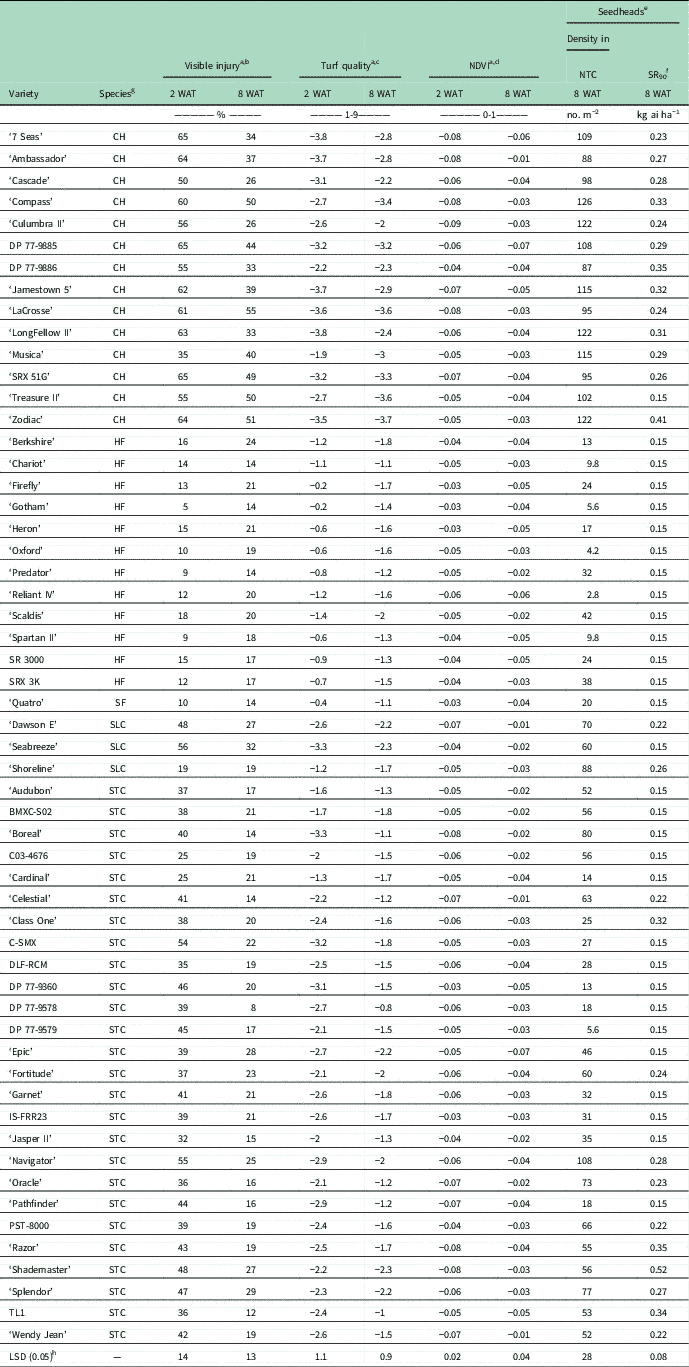
Slope a of visibly estimated turfgrass injury and turf quality and normalized difference vegetation index (NDVI) as influenced by glyphosate rate in kg ai ha−1 (74% ae) and its interaction with 56 fineleaf fescue varieties at 2 and 8 wk after treatment (WAT) and observed or visibly estimated density of fineleaf fescue seed heads in nontreated checks (NTC) and the predicted glyphosate rate that reduces seed head density 90% (SR90) at 8 WAT.

a Multiplying any hypothetical glyphosate isopropyl amine (74% acid) rate between 0 and 1.4 kg ai ha−1 by the slopes presented for visible injury, turf quality, and NDVI will generate the associated predicted response.
b A visible evaluation of percentage turfgrass injury was regressed against glyphosate rates (0, 0.41, 0.62, and 1.0 kg ae ha−1) for all combinations of year, replicate, and fineleaf fescue variety to obtain linear slopes and intercepts. Means shown for turfgrass injury slopes are averaged over replicate and year based on ANOVA at α=0.05. Mean intercept±SE was 0.5±0.3% and −2.0±0.2% at 2 and 8 WAT, respectively.
c A visible turf-quality rating scale of 1 to 9 was used, where 1=dead, completely brown turf; 6=minimally acceptable appearance; and 9=uniform, dark-green turf. Data were subjected to linear regression as described for turfgrass injury. Mean intercept±SE was 7.2±0.07 and 7.7±0.05 at 2 and 8 WAT, respectively.
d A multispectral analyzer (Crop Circle™ Model ACS-210) was used to assess turf NDVI, and data were subjected to linear regression as described for turfgrass injury. Mean intercept±SE was 0.6732±0.003 and 0.6934±0.002 at 2 and 8 WAT, respectively.
e Seed head density per plot was counted for 100 randomly selected plots and then counted or visibly estimated for all 672 plots to reduce the number of days required for evaluation. Mean accuracy±SE of visibly estimated seed head density was 96±8% based on comparison with counted plots.
f The predicted glyphosate rate that reduces seed head density 90% based on converting observed seed head density in each subplot to a percentage reduction relative to the nontreated subplot and subjecting these data to the hyperbolic function.
g Abbreviations: CH, Chewings fescue; HF, hard fescue; SF sheep fescue; SLC, slender creeping fescue; STC, strong creeping fescue.
h Means within a column that exceed the LSD value are significantly different at P≤0.05 according to Fisher’s protected LSD test.
Data were collected on the 672 subplots at 2 and 8 wk after treatment (WAT) and included visibly estimated fineleaf fescue injury and turf quality, NDVI, and visibly estimated seed head density. A multispectral analyzer (Crop Circle™ Model ACS-210, Holland Scientific, 6001 South 58th Street, Lincoln, NE 68516) was used to assess turf NDVI at both rating dates. The analyzer sensor was adjusted to scan a 0.4-m-wide area, and approximately 30 measurements were taken as the machine traversed the entire length of each subplot. Seed head density was counted on 100 randomly selected plots as a means of testing accuracy of visible estimations. Seed head densities for all 672 plots were then visibly estimated or counted, depending on density, to limit the number of days needed to make assessments. To control for variability in seed head production potential across varieties, seed head density was converted to a percentage reduction relative to nontreated turf in the adjacent subplot of each variety main plot as follows:
 $$\Delta S_{t} {\equals}\left[ {\left( {C_{t} \,{\minus}\,C_{n} } \right)\,/\,C_{n} } \right]{\times}100$$
where ΔS t is a percentage reduction in seed head density of a treated subplot t in a given main plot, C t is the observed fineleaf fescue seed head density of a treated subplot t in a given main plot, and C n is the observed fineleaf fescue seed head density of the nontreated subplot n in a given variety main plot. The influence of glyphosate rate on ΔS was then determined by subjecting data from all combinations of year, main plot, and replication to the hyperbolic function as follows:
 $$Y{\equals}iR\,/\,(\left( {1{\plus}iR)\,/\,a} \right) $$
where Y is the predicted percentage seed head reduction, a is the asymptote for seed head reduction, R is the glyphosate rate (kg ae ha−1), and i is the seed head reduction per unit glyphosate rate as rate approaches zero. Estimated i and a values were then used to calculate the estimated glyphosate rate that reduces fineleaf fescue seed heads 90% (SR90) using the following equation:
 $$SR_{{90}} {\equals} ( {90a} \right)\,/\,\left[\left {i\left( {a{\minus}90} \right)} \right ]$$
where SR90 is the estimated glyphosate rate that reduces seed heads 90%, and a and i are the previously described estimated parameters from the hyperbolic function (Equation 2). Estimated parameters for Equation 2 were based on least sums of squares and determined using the Gauss-Newton iterative method of PROC NLIN function in SAS® v. 9.2 (SAS Institute, Cary, NC).
Data for each response variable were tested for normality using PROC UNIVARIATE and the Shapiro-Wilk statistic in SAS® v. 9.2. Homogeneity of variance was assessed using Levene’s test on one-way ANOVAs for main effects or separately for glyphosate rate effects for each level of fineleaf fescue variety or for variety effects across each level of glyphosate rate using the HOVTEST WELCH option in the MEANS statement of PROC GLM in SAS® v. 9.2 (Welch Reference Welch1951). Homogeneity of variance was further assessed by visibly inspecting residuals and related diagnostics using the DIAGNOSTICS option in PROC PLOT in SAS® v. 9.2. When necessary, data were transformed to the log or arcsin square root to meet assumptions of ANOVA. In cases for which such transformation was needed, data were back-transformed for presentation clarity. Fineleaf fescue visible injury, turf quality, and turf NDVI were subjected to ANOVA using PROC GLM in SAS® v. 9.2 with sum of squares partitioned to reflect the effects of block, year, fineleaf fescue variety, glyphosate rate, variety by rate, and all possible interactions of fixed effects or their interactions with year. Percentage seed head density in nontreated turf of each main plot and SR90 data were also analyzed, but sums-of-squares partitioning in ANOVA excluded all effects or interactions related to glyphosate rate. Where the interaction of glyphosate rate by fineleaf fescue variety was significant, data were subjected to linear regression to generate slopes that explain the relationship of each appropriate response variable to glyphosate rate. Slopes were generated for all possible combinations of replicate, year, and variety using PROC REG in SAS® v. 9.2, and these slopes were used in subsequent ANOVA to test for significance of variety main effects or variety by year interactions. In all cases, significance of main effects and interactions was tested using the mean square error associated with each effect’s interaction with year, which was considered random (McIntosh Reference McIntosh1983). If year interactions were significant, data were separated by year; otherwise, data were pooled. Significant effects or interactions for each response variable were separated using Fisher’s protected LSD at the 5% level of significance.
Results and Discussion
Visible Injury, Turfgrass Quality, and NDVI
The interaction of glyphosate rate by fineleaf fescue variety was significant for all response variables (P<0.0001) while the year by variety by rate interaction was insignificant for all response variables (P>0.05). In subsequent ANOVA on slopes of visible injury, turf quality, and NDVI in response to glyphosate rate, the main effects of fineleaf fescue variety were significant for data assessed at 2 and 8 WAT for visible injury, turf quality, and NDVI (P≤0.0135), but year interactions were insignificant (P>0.05) (Table 1).
Slopes of visible injury, turf quality, and NDVI response to glyphosate rates in Table 1 represent a convenient way to compare predicted fineleaf fescue variety response to glyphosate. The slopes, as given in Table 1, approximate the response to 1 kg ai ha−1 (0.74 kg ae ha−1) glyphosate, but multiplying any hypothetical glyphosate rate between 0 and 1.4 kg ai ha−1 by the slopes presented in Table 1 will generate the associated predicted visible injury. In the case of turf-quality and NDVI data, the average intercept±SE across all varieties, years, and replicates for each assessment is shown in the table footnotes (Table 1) and must be added to slope by glyphosate rate calculations to generate the predicted response for a given variety. Standard errors of intercepts did not exceed 0.3%, 0.07, and 0.003 at any assessment date for visible injury, turf quality, and turf NDVI, respectively (Table 1). Thus, adding the mean intercept value offers a reasonable approximation of predicted responses for turf quality and turf NDVI but is not needed for visible injury, which had a mean intercept of 0.4 and 2.0 at 2 and 8 WAT, respectively. Thus, in terms of biological relevance, the intercept of visible injury by glyphosate rate for these fineleaf fescue varieties can be assumed to be zero.
While there were notable variety exceptions (described in greater detail later), fineleaf fescues tended to exhibit strong interspecific separation in visible injury, turf quality, and NDVI response to glyphosate (Table 1). Generally, HF and SF varieties were the least sensitive to glyphosate, while CH varieties were the most sensitive. Individual varieties of HF and SF were injured not more than 18% and 24% per kilogram of glyphosate per hectare at 2 and 8 WAT, respectively (Table 1). Predicted visible injury of ‘Gotham’, a HF, was 5% at 2 WAT and equivalent to all HF and SF varieties in visible injury, turf quality, and NDVI measurements at 2 and 8 WAT (Table 1). All HF and SF varieties had equal or slightly higher visible injury ratings and equal or slightly lower turf-quality ratings at 8 WAT as compared with 2 WAT (Table 1). Among the HFs, turf-quality decline per kilogram of glyphosate per hectare of ‘Scaldis’ at 2 WAT, was greater than that of Gotham and ‘Firefly’ but equivalent to all others. At 8 WAT, all HF and SF varieties were statistically equivalent in turf-quality slopes.
Whereas there were fairly consistent increases in visible injury and declines in turf quality for HF and SF varieties between 2 and 8 WAT, the direction of change in slope response between 2 and 8 WAT for NDVI for these varieties was much less consistent (Table 1). However, declines in NDVI per kilogram of glyphosate per hectare, especially at 2 WAT, generally separated by fineleaf fescue species, as was observed with visible injury and turf quality (Table 1).
Among the STC varieties, the least injury and highest initial turf-quality ratings were observed for experimental C03-4676 and ‘Cardinal’, which had statistically similar slopes to several HF varieties (Table 1). The experimental C-SMX had the highest predicted injury per kilogram of glyphosate per hectare (54%) at 2 WAT of any STC. By 8 WAT, all STC varieties appeared to have rapidly recovered from initial injury and had visible-injury slopes equivalent to those of the HF and SF varieties. In particular, the experimental DP 77-9578 had equivalent to the lowest predicted injury per kilogram of glyphosate per hectare at 8% and the highest turf-quality slope at −0.8 of any STC at 8 WAT. Among the lowest NDVI values at 2 WAT for any variety were those observed for STCs ‘Boreal’, ‘Razor’, and ‘Shademaster’, indicating substantial sensitivity to glyphosate. However, generally higher NDVI by glyphosate rate slopes at 8 WAT as compared with 2 WAT for all STC varieties except for ‘Epic’ indicated turf recovery to glyphosate treatment was progressing (Table 1). While the relationship between NDVI values and turf-quality slopes were sometimes inconsistent, general trends were positively correlated as described by Bell et al. (Reference Bell, Martin, Wiese, Dobson, Smith, Stone and Solie2002).
CH varieties were generally the most sensitive to glyphosate and often ranked among the highest visible-injury and lowest turf-quality and NDVI slopes at both rating dates (Table 1). Among the CH varieties, ‘Musica’ had equivalent to the lowest visible-injury and highest turf-quality slopes at 2 WAT, but apparently Musica’s response to glyphosate was delayed, as only ‘LaCrosse’ had a higher visible-injury slope, and no variety had a lower turf-quality slope at 8 WAT (Table 1). CH varieties ‘Treasure II’, ‘Compass’, LaCrosse, ‘Zodiac’, and experimentals SRX 51G and DP 77-9885 had some of the highest initial injury/lowest turf-quality slopes of any varieties in the trial and limited recovery by 8 WAT. Other CH varieties such as ‘Cascade’, ‘Culumbra II’, and the experimental STC variety C-SMX had injury slopes at 2 WAT ranging from 50% to 56% per kilogram of glyphosate per hectare but showed significant improvement by 8 WAT with injury slopes of 26% per kilogram of glyphosate per hectare or lower. CH varieties Compass, LaCrosse, ‘Ambassador’, ‘7 Seas’, and Culumbra II exhibited among the sharpest declines in NDVI by glyphosate rate of all varieties at 2 WAT (Table 1). Injury in this study comprised discoloration, stunting, and stand loss, and the three were not inherently separated upon data assessment. It can be generally stated, however, that stand loss was limited to the highest glyphosate rate and only occurred in CH varieties with few exceptions. Some CH varieties, such as LaCrosse, exhibited greater than 50% stand loss when treated with 1.4 kg ha−1 glyphosate based on visible assessment of plot images.
The three SLC varieties varied greatly in their initial response to glyphosate, with the ‘Shoreline’ response to glyphosate being comparable to most HF and SF varieties and ‘Dawson E’ and ‘Seabreeze’ having higher injury/lower quality metrics that more closely aligned with the CH varieties (Table 1).
All NDVI measurements had negative slopes at 2 and 8 WAT, indicating that glyphosate was most likely contributing to a decline in photochemical efficiency of the varieties over the rating period (Bell and Xiong Reference Bell and Xiong2008) (Table 1). The general trends previously described for the subjective data (visible injury and quality) were still observed, but the trends were not as well defined among species for NDVI data, except that HF and SF varieties typically had higher NDVI values than CH varieties. Among the most severe response of NDVI to glyphosate occurred for STC varieties Boreal, Razor, and Shademaster (all −0.08 slopes) and CH varieties Compass, LaCrosse, Ambassador, and 7 Seas (−0.08) and Culumbra II (−0.09).
Most STC varieties had significantly more visible injury per kilogram of glyphosate per hectare than HF and SF varieties at 2 WAT, with predicted percent injury values ranging from 25% to 54% per kilogram of glyphosate per hectare (Table 1). Exceptions were STC experimental C03-4676 and varieties Cardinal and ‘Jasper II’, which were statistically equivalent to Scaldis HF. By 8 WAT, almost all STC-variety injury ratings had declined to levels statistically similar to HF and SF varieties. A similar trend in recovery from the glyphosate treatments was observed for turf-quality ratings.
The data presented indicate that turfgrass breeders have continued to progress in phenotypic recurrent-selection breeding programs for glyphosate tolerance, particularly with HF (Hart et al. Reference Hart, Derr, Lycan, Rose-Fricker and Meyer2005). This selection strategy for glyphosate tolerance has also been shown to work for the SLC variety ‘Manoir’ (Johnston et al. Reference Johnston, van Wijk and Kilpatrick1989). These data suggest that the glyphosate tolerance is a genetic characteristic that can likely continue to expand in fineleaf fescues. However, turfgrass managers must still determine appropriate glyphosate levels for fineleaf fescue blends or mixtures that balance anticipated weed control levels with acceptable turfgrass injury/quality levels. Baldwin et al. (Reference Baldwin, Brede and Mayer2012) predicted glyphosate at 0.29 kg ae ha−1 was satisfactory to control annual bluegrass (Poa annua L.) in glyphosate-tolerant perennial ryegrass (Lolium perenne L.). However, in a greenhouse trial evaluating glyphosate rate response, Goss et al. (Reference Goss, Gaussoin and Martin2009) reported that glyphosate levels required to kill many common turfgrass weeds were often much higher than labeled application rates and dependent on weed age. Bingham et al. (Reference Bingham, Segura and Foy1980) reported that at 2 mo after seeding, orchardgrass (Dactylis glomerata L.), Kentucky bluegrass (Poa pratensis L), perennial ryegrass, and highland bentgrass (Agrostis tenuis Sibth.) were all killed by 0.14 kg ha−1 or greater glyphosate, but that creeping red fescue tolerated that level and tolerated up to 0.28 kg ha−1 by 4 mo after seeding. Goss et al. (Reference Goss, Gaussoin and Martin2009) also pointed out that management programs that take advantage of marginal glyphosate tolerance must be careful to avoid selecting for glyphosate-resistant weed populations. Preliminary research by Rana et al. (Reference Rana, Askew and Brewer2015) and unpublished data from previous experiments at Virginia Tech suggest fineleaf fescue injury by glyphosate is inversely dependent on the amount of sunlight exposure. In a study conducted at Primland Resort near Meadows of Dan, VA, a mixed sward of HF and STC varieties was injured less than 40% by 0.8 kg ae ha−1 glyphosate, and this was followed by complete recovery when grown in full sunlight, but injury was greater than 90% with substantial stand loss for an adjacent site 300 m away in partial shade along a tree line (Rana et al. Reference Rana, Askew and Brewer2015). In the current experiment, the entire study site was exposed to full sunlight, as the nearest trees were more than 50 m away.
Seed Head Response
As anticipated based on the report of Ruemmle et al. (Reference Ruemmle, Wipff, Brilman and Hignight2003), seed head formation was highly variable among the fineleaf fescue species (Table 1). As a group, CH was the most prolific seed head producer, having between 87 and 126 seed heads m−2 at 8 WAT. Perhaps due to prolific seed head production within the CH group, generally the greatest amount of glyphosate was needed to reduce seed head density of CH varieties by 90% (Table 1). Treasure II required 0.15 kg glyphosate ha−1 and less than all other CH varieties, which required from 0.23 to 0.41 kg glyphosate ha−1 to elicit 90% seed head reduction.
When nontreated, HF and SF varieties had 2.8 to 42 seed heads m−2, with ‘Predator’, SRX 3K, and Scaldis being the only varieties in this group to have significantly more seed heads than ‘Reliant IV’, which had only 2.8 seed heads m−2. Regardless of their variety-specific seed head rating, all HF and SF varieties were predicted to have 90% seed head reduction with 0.15 kg ai ha−1 (0.11 kg ae ha−1) glyphosate (Table 1).
The SLC and STC fescues were highly variable, ranging from 5.6 to 108 seed heads m−2 depending on variety (Table 1). ‘Navigator’ had the highest seed head density of the STC group and was equivalent only to the SLC variety Shoreline. The predicted glyphosate values for 90% seed head reduction for STC ranged from 0.15 kg for several varieties up to 0.52 kg ai ha−1 (0.11 to 0.38 kg ae ha−1) for Shademaster, the highest predicted glyphosate rate to reduce seed head density 90% that was observed in the trial. The three varieties of SLC had much less variability in seed head density, with Seabreeze at 60, Dawson E at 70, and Shoreline at 88 seed heads m−2. The glyphosate level predicted to control 90% of the SLC fescue seed heads ranged from 0.15 to 0.26 kg ai ha−1 (0.11 to 0.19 kg ae ha−1).
These data for seed head production potential and predicted glyphosate rate for 90% seed head control are of value to end users depending on their desire or lack thereof for seed head presence. Golf course architects often apply fineleaf fescues (where adapted) to low-input, secondary roughs for visible contrast in both color and texture as afforded by inflorescences (Hurdzan Reference Hurdzan1994). For turfgrass managers interested in reduced mowing requirements and more rapid golf play, lower seed head production is often a more desirable characteristic (Askew et al. Reference Askew, Goatley, Askew, Hensler and McKissack2013).
It is likely that plant response to glyphosate measured in these trials will vary somewhat depending on location and immediate or pending climate response, light intensity, soil characteristics, levels of nutrition, maintenance, and so forth, as each species offers inherent strengths and weaknesses (Ruemmle et al. Reference Ruemmle, Wipff, Brilman and Hignight2003). For instance, when this same 2003 NTEP trial was used to evaluate species and variety response to stress by irrigation with reclaimed water in California, SLC fescues performed best, while HF and CH fescues were in the lowest category (Harivandi Reference Harivandi, Hagan, Yokote and Morris2012). In our trials, HF, SF, and STC generally showed excellent tolerance to glyphosate up to 1.4 kg ai ha−1 (1.0 kg ae ha−1), but most varieties within the respective species showed significant recovery between 2 and 8 WAT under these conditions. It is anticipated that the general trends in species response to glyphosate reported here will likely persist, but that end users will be required to do their own on-site experimentation for specific varieties in determining appropriate levels of glyphosate to meet quality, weed control, and seed head management requirements.
Acknowledgments
The authors would like to thank the National Turfgrass Evaluation Program for allowing the use of the 2003 Fineleaf Fescue Variety Evaluation for these studies. We would also like to thank Michael Cox, Philip Shipman, and Christina Agee for technical support, and the staff at the Virginia Tech Turfgrass Research Center, specifically Dickie Shepherd and Jonathan Dickerson. No conflicts of interest have been declared. This research received no specific grant from any funding agency or the commercial or not-for-profit sectors.