

INTRODUCTION
Clean water is an indispensable component of human welfare. Making clean water available to communities comes at a cost. Efforts to reconcile these two facts reveal that the pricing of water services is a complex and controversial issue. Part of this complexity emanates from the fact that water is inseparable from life itself. Pricing of water services can thus have a serious impact on the quality of life that people enjoy. Whereas water prices at full cost recovery often restrict poor households' access to services, pricing water services below the cost of providing the service can threaten the sustainability of the service and human welfare in the long run. Therefore pricing of water services requires finding a balance between ensuring wide access to clean water on one hand, and sustainable provision of water services, on the other. This paper looks at one of the approaches that policy makers adopt in an attempt to find the balance between the two competing interests – cross-subsidisation. Although the pricing of agricultural, industrial and rural water services may generate similar controversies, this paper focuses on residential water in urban and peri-urban areas.
Cross-subsidisation has become a common pricing policy instrument in the past decade and half in both high, but more prominently low, income countries (Banerjee et al. Reference Banerjee2008), not just in the water sector but in other utility services such as electricity, natural gas, transport and telecommunication (Boland & Whittington Reference Boland, Whittington and Dinar2000; Komives et al. Reference Komives2005; Moulin & Sprumont Reference Moulin and Sprumont2002). Using the experience and evidence from the implementation of the cross-subsidy policy in the water supply sector in Zambia, this paper looks at the policy in practice, and draws broad lessons from the outcome of implementing it. The main argument of the paper is that while the intentions and objectives behind the cross-subsidisation policy in Zambia are clear, the results from the implementation of this policy are ambiguous, and the policy has so far has not been successful in realising the intended objectives. It is not clear from the available evidence how the poor, who are meant to benefit from the cross-subsidisation policy, actually benefit. One of the reasons for this limited success is that the cross-subsidy policy has not been the main focus of reforms in the water sector implemented in the past fifteen years. Cross-subsidy as an equity measure is secondary. Priority seems to have been given to realising the cost recovery targets. In view of this, it is argued in this paper that a more explicit or direct form of subsidy will be needed to achieve the equity objectives.
The paper is structured as follows. The next section briefly provides background information on the context in which the cross-subsidy policy is implemented, highlighting the influence of global forces in formulating and implementing this policy; it also discusses the key features, rationale and objectives of the policy. The third briefly outlines the cross-subsidy debate. The outcomes from implementing the policy are presented in the fourth section, highlighting the disconnections between policy and reality. The fifth section presents the lessons drawn from the experience of implementing this policy so far. The last section offers some concluding remarks.
BACKGROUND AND CONTEXT
Provision of water and sanitation services in Zambia, from independence until the early 1990s, was the responsibility of local government authorities (councils). Water services were provided as part of a package of social services which included housing, electricity, roads and other social amenities. However, towards the end of the 1980s, most councils started to experience serious financial and management challenges in providing these services. A prolonged period of inadequate funding to the social services sector resulted in the deterioration of social infrastructure and services, including water. Increasing demand for water from the growing urban population, together with the run-down infrastructure due to poor maintenance and low capital investment, made it difficult for most local authorities to provide acceptable water services to residents (NWASCO 2002; RoZ 1994), and by the mid 1990s, few of them could do so. It was within this deteriorating environment that the new water policy was introduced in 1994. But there is a much broader context to this policy.
The 1994 water policy reforms in Zambia should be seen as part of a broader process that started during the 1980s when international financial institutions (IFIs), using the debt crisis as a leverage point, began to implement structural adjustment programmes (SAP). These reforms were expected to improve efficiency and capacity in the provision of services, including water services. Within this framework, privatisation of public entities was promoted as a way to reduce public spending, debt and inefficiency, and to promote economic growth. Towards the end of the 1980s, the Zambian government was under pressure to implement these reforms as part of the conditions set by the IFIs for accessing aid. By 1993, the state had started to implement the liberalisation and privatisation strategy in all major sectors of the economy (Craig Reference Craig2000). In most African countries, the 1990s saw a strong shift towards the privatisation of utilities such as water, electricity, telecommunication and transport, mainly under pressure from multilateral and bilateral donor agencies (Bond et al. Reference Bond, McDonald and Ruiters2002). The argument for privatisation was made more appealing by the fact that most local authorities were finding it increasingly difficult to provide the services (Bayliss Reference Bayliss2003). Broadly, privatisation of the bulky social services was part of the public sector reform programme lobbied by the donors and IFIs (Bayliss & McKinley Reference Bayliss and McKinley2007).
Though the general mood was towards full privatisation, commercialisation was adopted in Zambia, mainly because no private sector investors were willing to invest in the water sector. Even though commercialisation did not involve a full transfer of state assets to private ownership, this strategy in Zambia (and elsewhere) has many features in common with privatisation, such as separating the water services from the rest of municipal services, strict financial performance targets, operating water services on commercial principles, and the introduction of market-based remuneration for managers (Bond et al. Reference Bond, McDonald and Ruiters2002). In the Zambian case, there have so far been no private investments; all the Commercial Utilities (CUs) are solely owned by the local authorities (Chitonge Reference Chitonge2007; Dagdeviren Reference Dagdeviren2008), but operated as separate commercial entities registered under the Companies Act. Creating commercial water utilities has been the principal focus of the water supply reforms. As noted below, the main objectives of creating CUs are to improve efficiency, sustainability, coverage and equity in the provision of water services. Currently, there are ten CUs in Zambia supplying water services to most urban and peri-urban populations (NWASCO 2009).
Technically, CUs are private companies operating water services on behalf of local authorities. The local municipalities, as the sole owners, are represented on the board of directors and appoint the management board, which is responsible for the daily operation of the water utilities. In this arrangement, while the local councils are still owners of the water companies in Zambia, they are not directly involved in the provision of water services. Since commercialisation gained momentum in 2000 in Zambia, donor agencies have been the major source of funding to the sector, and consequently have a significant influence in policy formulation and choice of programmes. According to a country evaluation report by Water Aid (WAZ 2009: 1), 90% of funding to the water sector in Zambia still comes from donors, with the state contributing less than 10%.
The approach which has been pushed by donors so far has focused on cost recovery to ensure the commercial viability of the water companies, and also to induce water conservation, by means of an effective price mechanism. As an afterthought, the government appended social justice and the equity principle to the policy as core values in the provision of water services. The equity part of the policy is expected to be achieved primarily through cross-subsidisation, since the government does not directly subsidise water consumption from public revenue. As explained below, revenue to finance the subsidy is assumed to be generated from a multiple-block tariff schedule in each CU.
In order to implement these reforms, a new institutional set-up was introduced in the Water Policy of 1994, elaborated in the Water Supply and Sanitation Act of 1997. Before 1994, the councils were the owners and service providers, as well as the policy makers and regulators of the water services sector. Under the current arrangement, the Ministry of Local Government is responsible for the formulation of policy, CUs are responsible for the provision of water services, and a statutory body (National Water Supply and Sanitation Council, NWASCO) is responsible for regulating the water and sanitation sector.
Although NWASCO is tasked with ensuring that government policy is implemented, this set-up involves the withdrawal of the state (local and central government) from direct involvement in service provision, taking the backstage role of drafting policy and sitting on the CUs boards. This is not unique to Zambia or developing countries. Withdrawal of the state from public service provision is a global strategy which has been backed by mainstream economic policy and promoted by donors and international development agencies since the early 1980s (Bayliss & McKinley Reference Bayliss and McKinley2007; Bond Reference Bond2004; Bond et al. Reference Bond, McDonald and Ruiters2002; Swyngedouw Reference Swyngedouw2005). The cross-subsidy policy in Zambia should be seen in this context. Arguably, this policy in Zambia is failing to achieve its objectives, as shown below, mainly because it was not the focus of the donor driven reform agenda. Cross-subsidisation is often antithetical to mainstream economic policy, and in most instances serves only the superficial purpose of appearing to satisfy equity and social justice demands.
WATER TARIFF POLICY IN ZAMBIA
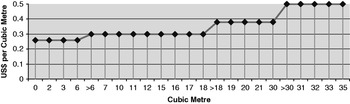
As noted above, the water sector in Zambia has undergone significant changes since the introduction of the new Water Policy in 1994. Among these is the establishment of CUs. The other important reform in the water supply sector is the establishment of the national regulator NWASCO. By 2001, there were nine CUs operating in urban and peri-urban areas of Zambia (NWASCO 2002). This number has now grown to ten (NWASCO 2009). All the CUs, as well as other providers (local authorities and private water schemes or trusts), are under the supervision of NWASCO, which reviews and approves water tariffs for all water services providers. According to NWASCO, there are a number of conditions which are taken into account, such as improved metering ratio, water quality, hours of service, unaccounted for water (UfW), billing, collection and staff efficiencies, state of the infrastructure and the viability of the provider, when approving tariff adjustment. NWASCO has adopted the increasing block tariff (IBT)Footnote 1 system for residential and commercial/industrial water supply for all CUs in Zambia. This tariff structure charges different rates based on the volume of water consumed as Figure 1 shows.
Chambeshi Water and Sewerage Company Tariff Structure 2009.

Although different CUs have different tariff schedules, they have all adopted the general structure with a multiple-block (usually four/five-block) tariff as shown in Figure 1. According to the tariffs approved for 2009, the first block for most CUs is set from 0 to 6 cubic metres (m3) or kilolitres per month. Water consumption falling within this block attracts the lowest charge in all the CUs, because it is assumed that most poor households' water consumption falls within this block (Banerjee et al. Reference Banerjee2008). Like many other countries where IBT is implemented, much attention is given to the first (and, to a lesser extent, the second) block, because these two blocks are meant to address the issue of affordability for poor households (Boland & Whittington Reference Boland, Whittington and Dinar2000). NWASCO (2004: 42) refers to the first six kilolitres of water as the ‘lifeline consumption’, and this is charged at the rate known as the ‘social tariff’. The second block is charged at a higher rate than the first block, as Figure 1 shows. The range of the second block differs from one CU to another. For some CUs, the second block is set from 6 to 30 kilolitres, while in other CUs it is set from 6 to 15 kilolitres only. In the same way, rates and ranges for the third and fourth (and, sometimes, fifth) blocks are different for each CU.
As Figure 1 shows, the increase in tariff between the blocks is not the same. For instance, moving from block one to block two, the rate increases by 15%, from block two to block three by 27%, and from block three to block four by 32%. The steepest rise is between blocks three and four, resulting in the rate for the fourth block being almost twice that of the first block. One key justification for this pricing structure is that the higher blocks (third, fourth and fifth) have to ‘generate the revenue for subsidizing the first block of [lifeline consumption] customers’, who are charged below the cost of providing the service (NWASCO 2004: 42).
Rationale for cross-subsidy
A number of reasons are given for adopting this pricing structure. One is that this is a ‘fair way of billing for consumption and that it helps avoid conflict between the service provider and customers’ (NWASCO 2004: 44, emphasis added). Second, this structure is seen to incorporate the principles of transparency, simplicity and affordability. Third, it is assumed to address the question of equity, and is often portrayed as an instrument of social policy to facilitate achievement of universal access to essential services. Fourth, it is also seen as an income redistribution tool, in so far as it results in a net transfer of income from high-volume to low-volume customers. Fifth, IBT is also seen as a means to promote conservation of water; it is argued that charging high-volume consumers a higher price discourages extravagant use of water, thus incorporating environmental concerns. The idea is that a higher price for high-volume consumption imposes a penalty on high-volume customers who may waste water by washing cars, maintaining swimming pools and keeping large green lawns. Sixth, it is often argued that IBT promotes marginal cost pricing, and so helps to send the correct economic signal to the customers (ibid.: 38–40). This paper does not seek to go into the arguments for and against IBT. The interested reader should refer to Boland & Whittington (Reference Boland, Whittington and Dinar2000), as well as Komives et al. (Reference Komives2005) and Le Blanc (Reference Le Blanc2007) . Here it suffices to mention that though the efficacy of IBT is often questioned by results from empirical studies, it still has a strong appeal to both politicians and the general public, especially in low-income countries.
Policy objectives
With regard to water supply and sanitation services in Zambia, the 1994 water policy's main objectives include improved efficiency in the delivery of services, expanding service coverage, sustainable water use through cost recovery, and equity by charging the poorer customers a social rate. According to the national water policy, one of the main objectives is ‘to achieve full cost recovery from user charges in the long run’, so that the services can be sustainable (RoZ 1994). In view of this, CUs were expected to reach full cost recovery after four years' operation (NWASCO 2004: 41). However, this objective comes with the goal of ensuring that the poor also have access to water at rates which they can afford – the equity issue. To realise these two objectives, the IBT was adopted and is being implemented by all service providers, especially the CUs. Thus, the IBT system was conceived as a policy instrument which would reconcile the conflicting economic and social objectives in the water sector.
The context
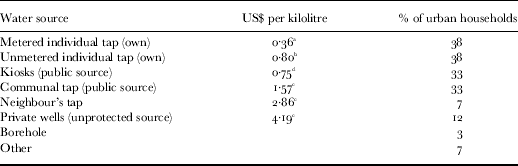
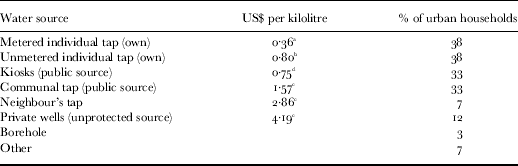
Though there are differences in the conditions under which CUs in Zambia operate, most of them face similar situations. It is also important to note that the cost recovery policy was implemented at a time when many people had lost their jobs due to the reform of the public sector, resulting in high levels of poverty, even in urban areas (RoZ 2005a). In most urban and peri-urban areas of Zambia where CUs operate, there are six groups of water customers defined by the way they access water. Table 1 shows the various categories of water customers and the estimated average costs per kilolitre for each category. The table also provides the estimated proportion of the urban and peri-urban households in each of these categories. Figures in Table 1 clearly show that the cost of water is different for each category. On average, water is cheapest for customers connected to the public network, with an estimated average cost of US$0.36 per kilolitre at 2006 prices. Water is most expensive for those who are not connected to the network, with those buying from neighbours and private wells paying the highest price. The latter, on average, pay more than ten times the price for connected customers.
Average cost of water by water source
Source: Own calculation based on data from DTF 2006 and author's data collected in 2007.
a This is an average cost of a cubic metre based on the average official tariffs approved by NWASCO for 2009. This is a simple mean; weighting could not be applied due to inadequate data. Thus, these figures are rough estimates.
b Calculated on the basis of average fixed charge for unmetered customers for 2007. The figure was arrived at using an estimated consumption rate of 50 litres per capita per day and an average household size of 6 (see DTF 2006; RoZ 2005b). The 50 litres per capita is well above the baseline consumption rate of 30 litres per capita recommended by the Regulator (see NWASCO 2004). This may not reflect the actual cost of water since the actual consumed volume is not known.
c These figures are calculated based on the DTF 2006 reported average cost of a twenty-litre container in 2005 for various sources.
d The figure is based on the author's data collected in 2007 and DTF 2006.
The exchange rate used is the average for 2005 to 2007, which is approximately US$1=K5000.
Table 1 also reveals that over 60% of urban and peri-urban households have no individual connections. Further, among households with individual connections, a significant proportion are not metered. If we use the average metering ratio of 43% for CUs (NWASCO 2008), only 16·3% of urban households have metered individual connections. This is an important factor in the context of a cross-subsidisation policy, since the official tariff structure, with a cross-subsidy mechanism, is in practice only applicable to users who are metered (NWASCO 2004: 55; Boland & Whittington Reference Boland, Whittington and Dinar2000; Le Blanc Reference Le Blanc2007; Whittington Reference Whittington2003). For the IBT system to be an effective tool for implementing the cross-subsidy policy, it is essential that a significant number of users access water from metered sources. Users who access water from unmetered sources are charged differently, usually on a monthly fixed rate based on an estimated average water consumption of households in the area. Households getting water from an unmetered communal tap, kiosk or neighbour are usually charged per twenty-litre container.
In addition, not all metered households are high-income households or high-volume customers who can generate enough surplus revenue to subsidise other users. In this case, it is apparent that the customer base with the ability to subsidise is small. This poses a major challenge to cross-subsidisation since for the policy to be effective, it ‘requires having the right balance between subsidy recipients and cross-subsidisers’ (Komives et al. Reference Komives2005: 17). In smaller urban centres, the section of possible net subsidisers is significantly small, making it difficult for any meaningful cross-subsidisation among the residential customers to occur.
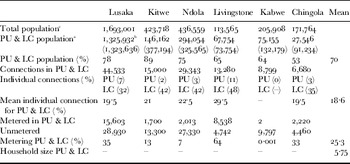
Water supply indicators in major cities and towns

Source: Own calculation based on DTF 2006, RoZ 2000b, Projected Mid-Year Population 2000–8 (CSO 2008) and City Population (Worldwide Index 2009).
–=no data available.
a The figures in brackets show the total population in the PU & LCs. The difference is a proportion of people in PU and LC who are not served.
b The figure for Lusaka City when adding the individual figures for PUs and LCs areas is more than the aggregate figure reported in the survey. The calculated figure is estimated at 1,354,401 for PU and LCs.
c The total population in the cities was estimated by using the CSO projected growth rates for 2005 to match the year when the DTFdata were collected. The population for Lusaka City was estimated by using the estimated proportions of LC+PU and high-cost areas. These figures are rough estimates based on available information.
Table 2 provides information on the key features of the context in which the cross-subsidy policy is implemented in the four major cities (Lusaka, Kitwe, Ndola and Livingstone) and two towns (Kabwe and Chingola). It makes evident the low level of metered individual connections. Of the 18·6% of households that have individual connections in peri-urban (PU) and low-cost (LC) areas, only one in four is metered. Given that these areas account for 70% of the urban population,Footnote 2 and that the cross-subsidy policy operates only in metered households, it is apparent that the policy applies to a small section of the population. The low level of individual connections and metering ratio in PU and LC areas implies that most households in the urban centres access water from sources where the possibility of a cross-subsidy is almost nil. For instance, if only 25% of the 18·6% of individual connections in PU and LC areas are metered, this implies that the cross-subsidy potentially applies only to less than 5% of households, who are either beneficiaries or subsidisers.
Under these conditions, pricing water services to achieve both cost recovery and social objectives is impossible. While peri-urban and low-cost households account for 70% of the urban population in these major cities and towns, only about 5% of these are metered, implying that the size of net cross-subsidisers is correspondingly small. On the flip side, this situation also suggests that only a small section has the chance to benefit from the policy of cross-subsidisation. Assuming that the small percentage of households who are connected is not the poorest, it then follows that the poorest (who in most cases are unlikely to afford a metered individual connection) are left outside the ambit of the policy. As evident from Table 1, people who are not connected to networks pay the highest prices. In effect, this scenario implies that the poor people are actually net subsidisers by virtue of paying higher prices, though the net surplus is captured by the intermediaries between the utility companies and the customer.
In cities like Kitwe, where almost 90% of the population live in PU and LC areas, it is difficult for any sizeable cross-subsidy between customers to occur. Realising enough surplus revenue to subsidise the larger PU and LC population requires charging the small proportion of high-volume customers in high-cost areas very high tariffs. But this runs the danger of inducing high-volume customers to disconnect from the network, opting for a stand-alone facility. Cities such as Lusaka, Kitwe and Ndola have an advantage in that they have a much larger industrial base that can be a source of revenue to subsidise the residential customers. However, industrial water consumers are very sensitive to price and service levels, which may sway them to disconnect from the network and establish stand-alone systems if services are so poor as to threaten the viability of commercial activities (Komives et al. Reference Komives2005; Moulin & Sprumont Reference Moulin and Sprumont2002).
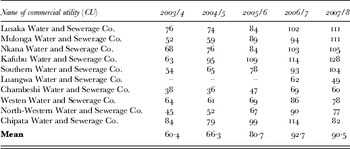
If one takes the cost of water per kilolitre presented in Table 1 together with the information in Table 2, it becomes difficult to argue for any meaningful cross-subsidisation between customers, or that the poor are the beneficiaries of this price structure. It is therefore not surprising that most CUs have been unable to meet their operating and maintenance (O&M) costs, let alone full cost recovery (see Table 3).
Operating & maintenance cost percentage coverage 2003–8

Source: Own calculation based on data from NWASCO 2008: 13.
NB: these are unweighted averages. Weighted averages for 2007/8 were 109. LGWSC started operating in 2006, hence no data prior to that.
Most of the CUs, despite tremendous improvements in the last seven years, are failing to break even. However, the problem of utilities failing to meet their running costs is not unique to the Zambian case. A worldwide survey of water utilities in 2004 conducted by Global Water Intelligence (GWI) involving 132 cities shows that even in high and middle-income countries, only half of CUs are able to meet their short and long-run costs, while in low-income ones only 3% of water utilities were able to generate enough revenue to cover running costs (Komives et al. Reference Komives2005: 20–2). Failure to meet O&M costs has been attributed to inappropriate tariff or pricing of water services. This raises the question of what is the appropriate pricing of water services, given the constraint to balance the equity and efficiency goals. This question has engendered an extended debate that is far from being resolved.
THE CROSS-SUBSIDY DEBATE
Debate on pricing of public services is not new. Theories and approaches to the pricing of public utilities are rooted in welfare economics, public utility and public finance literature which date back to the appearance of public utilities in Europe and America during the last quarter of the nineteenth century (Baumol & Bradford Reference Baumol and Bradford1970). From Jules Dupuit's bridge and road tolls (1844) through Alfred Marshall's consumer surplus (1920) to Ramsey (Reference Ramsey1927), Hotelling (Reference Hotelling1938) and Coase (Reference Coase1946), there have been fierce contestations on how to resolve the question of pricing public services. In the earlier debate, the emphasis centred on optimal pricing, and the core question to which debates responded was, what pricing mechanism results in the maximisation of welfare – the Ramsey question (Ramsey Reference Ramsey1927). Broadly, there has been general agreement that prices for public utility services should be set in such a way that the user pays the full cost of providing the services – the full responsibility approach. Nonetheless, there have been different views and approaches regarding cases where there are cost asymmetries on services with common costs, a situation that leads to a divergence between average and marginal costs (Coase Reference Coase1946). This has given rise to two views of price responsibility: ‘one where users are responsible for asymmetries in the cost function [no cross-subsidy or fairness principle], and one where they are not [cross-subsidy or equity principle]’ (Moulin & Sprumont Reference Moulin and Sprumont2002: 2).
Within this debate, the cross-subsidy or partial responsibility view advocates a pricing mechanism that takes into account only the marginal cost of making the service available, leaving out the fixed or capital investment costs. Originally, the partial responsibility approach proposed that the user pay the marginal cost of providing the service, while the state should cover the fixed cost in cases where average costs are higher than the marginal cost. Over the years, this approach has proved popular in many countries including high-income countries (OECD 2003). The reasons for its attractiveness include the fact that cross-subsidy is ‘politically correct’, and also that private service providers like it because it enables them to achieve full cost recovery without necessarily relying on governments which often fail to honour commitments to funding subsidy deficits (Komives et al. Reference Komives2005).
The no cross-subsidy or full responsibility view, on the other hand, argues that the partial responsibility solution leads to maldistribution of factors of production, distorts optimal income distribution, and eventually results in higher taxes (Coase Reference Coase1946). Despite wide support from many empirical studies and financial institutions, including the World Bank, this view is less popular, especially in low income countries where majority of citizens face difficulties paying for water (OECD 2003).
Although these two approaches continue to influence debates and policies about pricing of public services, the thrust of the debate has shifted from a preoccupation with ‘optimal pricing’ to practical issues over pricing arrangements which help resolve the conflicts inherent in water services. Generally, there is wide acknowledgment among analysts and policy makers that, considering the conditions under which utility prices are set, practical options are pushed away from the best to the second best (Baumol & Bradford Reference Baumol and Bradford1970; Dinar Reference Dinar and Dinar2000; Faulhaber Reference Faulhaber1975), if not third or fourth best, solutions (Meran & Hirschhhausen Reference Meran and Hirschhausen2009). Even if there is still strong adherence to the full responsibility or no cross-subsidy approach among donor and international development agencies, there is growing realisation that the pricing of utility services should take into account their affordability among different users, a matter which was earlier ignored as purely ‘a question of ethics’ and not an economic one (Coase Reference Coase1946: 172). In the last two decades, there has been a growing view that the challenge of utility pricing is not only an economic problem, and that effectively addressing it requires one to consider other factors including ethics, culture, politics and the institutional set-up (Dinar Reference Dinar and Dinar2000: 5).
Theoretically, one strength of the cross-subsidisation approach lies in its ability to take into account a broad range of socio-economic and political conditions under which a tariff is designed and implemented. Practically, the actual conditions are often taken for granted as the Zambian case illustrates, so that the resulting tariff structure applies only to a small constituency, leading to the widely noted unintended outcomes (Boland & Whittington Reference Boland, Whittington and Dinar2000; Dahan & Nisan Reference Dahan and Nisan2007; Meran & Hirschhausen Reference Meran and Hirschhausen2009; Whittington Reference Whittington1992). Although there has been persistent criticism of IBT in many low-income countries, the question is not whether there should be cross-subsidy or not, but more about how to design a tariff structure that achieves the intended policy objectives. Even in high-income countries where affordability of water services may not be an issue for many people, ‘clear potential benefits from increasing block tariff structure’ (OECD 2003: iii) are recognised.
POLICY OUTCOMES
Revenue sufficiency
It is clear that despite noticeable improvements made in the last seven years, most CUs in Zambia have failed to achieve cost recovery. Most of them have not even been able to collect enough revenue to cover their O&M costs. As Table 3 shows, prior to the 2005/6 reporting year, no CU was able to meet its O&M costs. For most of them, the ratio of internally generated revenue to O&M costs was below 70%. If this is a result of implementing a cross-subsidy policy, then this is a clear case of ‘unfunded subsidy’, a situation that jeopardises the long term sustainability of the service, and the capacity to improve its quality and expand it.
Even though the situation seems to have improved greatly in the last two reporting periods, with four CUs in 2006/7 and fiveFootnote 3 in 2007/8 managing to cover their O&M costs from revenue collected through water charges, most CUs are far from realising the objective of full cost recovery, which includes both O&M costs and interest on amortised fixed capital outlay. According to NWASCO, the current benchmark for full cost recovery is 150% of O&M costs. Up to 2008, no CU reached full cost recovery, although most CUs had been in operation for over eight years. Although the overall trend for the past five years shows great improvement for some CUs, others recorded a decline in O&M percentage coverage in the last two reporting periods (2006/7 and 2007/8). Of particular concern is the fact that five CUs reported a diminishing ability to cover O&M costs from their revenue, suggesting that the problem of revenue sufficiency is enduring. A NWASCO report (2008) also confirms that despite several tariff adjustments for all CUs since 2000, most CUs' rates are below average cost.
It is difficult (due to lack of credible data) to know with certainty whether the inability to cover O&M is a consequence of implementing a cross-subsidy, and most importantly if there is any net subsidy that accrues to the low-income households. From the evidence in Tables 1 and 2, it is unlikely that low-income household members are the net beneficiaries of this price structure. On the contrary, a high proportion of poorer households seem to be paying prices way beyond the average tariff and, in some cases, higher than the charge for the most expensive block. Assuming that all customers in the fourth or fifth block belong to high-income households, the question that arises is, how does cross-subsidisation occur to low-income households when even the highest-volume users (who are assumed to be well-off) pay a rate below the average costs? From this, it is probable that if there is any cross-subsidy in the system, it is being captured by the non-poor households who may be paying rates well below the average cost or full cost recovery.
Technical and commercial inefficiencies: the ‘leaky basket’
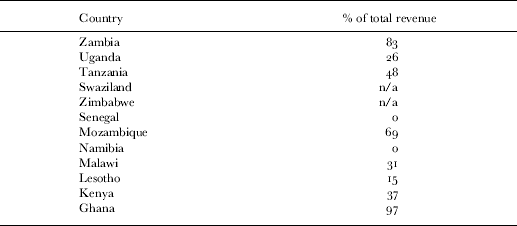
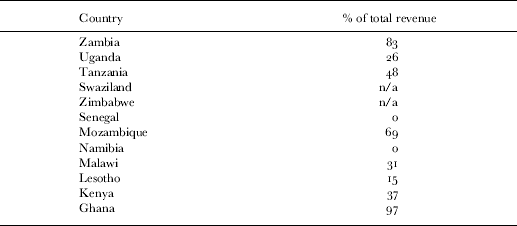
Part of the inability to cover running costs can be attributed to technical and commercial inefficiencies, such as high levels of unaccounted for water (UfW) lost through leakages, unmetered connections, inefficient billing and illegal connections. According to a NWASCO report (2008: 5), the weighted average for UfW in all the CUs in the 2007/8 reporting period was 45%, while the metering average ratio was 43%. In view of this, the failure to meet O&M costs for most CUs may be attributable to technical inefficiency, resulting mainly from rundown infrastructure. Conversely, failure to cover O&M is a reflection of the cumulative effects of failing to cover the full cost of providing services by the utilities. Failure to raise enough revenue to cover costs, in the long run, has compromised the utilities' ability to maintain the network, which in turn results in high technical inefficiencies such as UfW. The ratio of revenue lost due to UfW to total revenue in Zambia is among the highest in sub-Saharan Africa, as Table 4 shows.
Hidden cost from unaccounted for losses, % of revenue
Source: AICD Survey Database (http://ddp.ext.worldbank.org 2008).
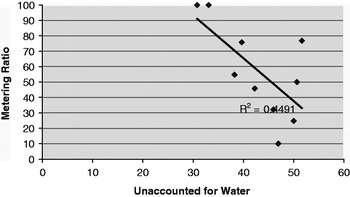
Up to 83% of total revenue is lost due to UfW. This makes it extremely difficult to cover O&M costs from tariffs, and then talk about cross-subsidisation. Although it has often been argued that metering can solve the problem of UfW (Banerjee et al. Reference Banerjee2008; Boland & Whittington Reference Boland, Whittington and Dinar2000; Dagdeviren Reference Dagdeviren2008; Whittington Reference Whittington2003), available evidence shows that the problem of UfW is much more than just a matter of metering the network. Evidence from the Zambian CUs shows a weak relationship between metering and the levels of UfW, as Figure 2 indicates. Although there seems to be an inverse relationship between metering and UfW, there must be other factors (such as the state, age, length and size of the network) that can account for more than half of the problems associated with UfW. Metering alone accounts for less than half of the variance.
Correlation Between UfW and Metering Ration for 10 Cus in Zambia.

Generally, the high fixed capital and long asset lives of the water infrastructure contribute to the high UfW. This is mainly due to the fact that, in the short term, the marginal cost is often equal to the average cost since the fixed cost can be ignored. However, as the infrastructure deteriorates in the long term, the average cost of providing water rises above the marginal cost, making it difficult for the utilities to break even. This problem is ‘more severe in the case of water utilities than electricity utilities because water networks and their associated services deteriorate quite gradually, without threatening the continuity of provision. For this reason, it is easier for politicians to underfinance water and sewerage services than electricity services’ (Komives et al. Reference Komives2005: 33). For a cross-subsidy programme to be successful, all these factors need to be taken into account. Failure to take full account of such factors can lead to a situation where the net subsidy is absorbed by either technical or commercial inefficiencies in the system.
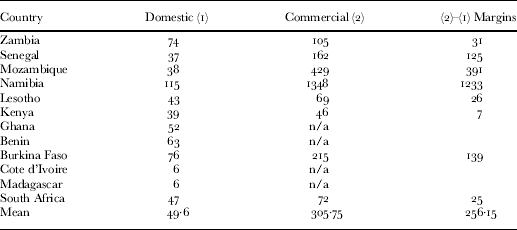
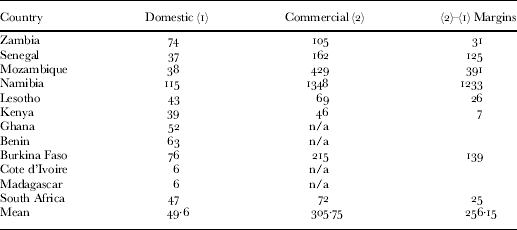
Effective domestic and commercial tariffs at 10 m3/year (US cents)
Source: Based on data from AICD WSS Survey Database (http://ddp.ext.worldbank.org 2008).
Contrary to claims that ‘water charges applied by Zambian utilities are still the lowest in sub-Saharan Africa’ (Dagdeviren Reference Dagdeviren2008: 108), average domestic water tariffs in Zambia are actually among the highest, as Table 5 shows. Out of twelve countries with data on domestic water tariffs, Zambia's average domestic water tariff for 10 m3 is the third highest after Namibia and Burkina Faso, and one and half times the average tariff for the twelve countries. So the reported failure to cover O&M costs for most of the CUs is not a matter of having low tariffs. There are other factors such as high levels of UfW which make it difficult for the CUs to cover their running costs, even when their tariffs are among the highest in the region.
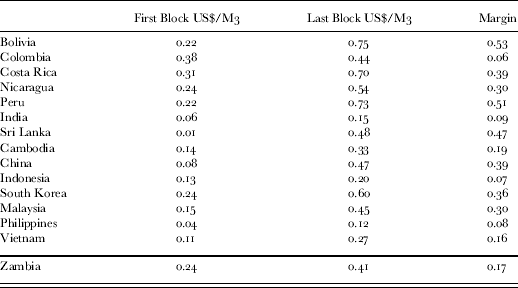
Conversely, the commercial/industrial tariff is among the lowest in the region. Even if we remove outliers such as Namibia and Mozambique, the margin between domestic and commercial/industrial water customers for Zambia is among the lowest. The margin between these two categories becomes even smaller if we compare higher volumes, as Table 6 shows. A large margin between the residential and commercial/industrial consumers is a sign of a progressive tariff which creates potential for cross-subsidisation between different categories of customers.
Comparative IBT Rates for Developing Countries
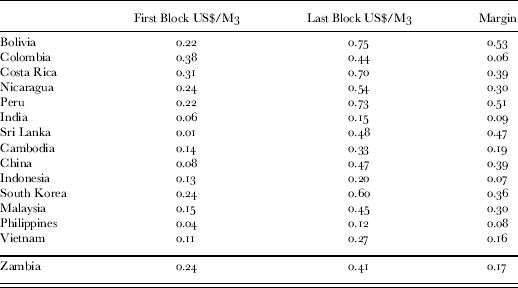
Source: Own calculation based on data from Komives et al. (2005: 24) and approved tariff for the four Zambia CUs (Nkana, Lusaka, Chambeshi, Western and Mulonga) for which 2009 tariff data were available.
Similarly, in terms of the margin between the first and last blocks, the Zambian case does not diverge far from the average for low and medium-income countries, as Table 6 suggests. The margin between blocks 1 and 2 roughly reflects the progressiveness of the tariff, and it is clear that the Zambian average is within the range sufficient to cover running costs. Thus the reported failure to cover O&M costs could be due to high technical inefficiencies, rather than low prices. In cases where only 50% of the pumped and purified water reaches the customer, it is likely that inefficiencies hamper the provider's ability to cover costs. Unfortunately, this is passed on to the customer in the form of high tariffs or poor services. If the subsidy is funded by the state, the money meant to assist low-income households may end up being absorbed by the inefficiencies in the system. In the Zambian case, high levels of UfW make the cost recovery and the cross-subsidy tasks difficult, if not impossible (Dagdeviren Reference Dagdeviren2008: 107).
Size of net subsidy
With regard to the net cross-subsidy, a number of issues emerge from the implementation of the programme. First, due to the small proportion of metered connections indicated in Table 1, the ratio of possible subsidisers is small, given that cross-subsidisers come mainly from metered connections (Le Blanc Reference Le Blanc2007; Whittington Reference Whittington2003). If the proportion of potential subsidisers is small, the net subsidy is unlikely to be large enough to cover the deficit, even if we assume that all the metered households fall in a high-volume consumption band. Moreover, if the reports that even the rates for the highest block are below average costs are true, then there may not even be any cross-subsidy between residential customers, given the understanding that a cross-subsidy can occur only when one customer pays less than the marginal cost (usually the long-run marginal cost or LRMC), while another customer of the same service pays above the marginal cost (QCA 2000: 65). Although there is a possibility of cross-subsidisation between residential and commercial/industrial customers, the net subsidy is likely to be small, since the margin between the residential and industrial tariff for most CUs is very small, as Table 7 suggests.
According to the approved tariffs for 2009, the average cost of a kilolitre of water in the 0 to 60 kilolitre range for Chambeshi Water was higher for domestic than for commercial customers, while for Western Water, the average cost between these two categories was the same. A considerable potential for generating a subsidy exists for Mulonga Water, where the difference between the domestic and commercial average costs is over 90%. But in most CUs the margin between domestic and commercial/industrial customers is too small to generate substantial subsidy (see also Table 5). Further, for CUs in smaller towns, the industrial/commercial base is too small to generate any significant subsidy.
Who is cross-subsidising whom?
Since there is no clear evidence to suggest that all high-volume consumers are actually from high-income households, one can assume that there are low-income households whose monthly consumption ends in the fourth or fifth block, while some high-income households may consume in the first or second blocks. Research conducted in other cities in developing countries (Boland & Whittington Reference Boland, Whittington and Dinar2000; Dahan & Nisan Reference Dahan and Nisan2007; Meran & Hirschhausen Reference Meran and Hirschhausen2009; Whittington Reference Whittington1992, Reference Whittington2003) shows that low-income households do not always consume within the first or second blocks.Footnote 4 In large low-income households, the poor end up consuming high volumes of water, and are therefore charged rates for the last block. For instance, Whittington (Reference Whittington1992), using data from Kumasi in Ghana, shows that, due to water sharing by neighbours, large low-income households pay a higher price on average. Similarly, Meran & Hirschhausen (Reference Meran and Hirschhausen2009), using data from Bangladesh, find that since poor households are often larger, they consume more water than smaller households which may be better-off. By consuming high volumes, large low-income households pay more than smaller households who may often be wealthier. In a study estimating the impact of household size on the cost of water, Dahan & Nisan (Reference Dahan and Nisan2007: 14), using data from Israel, find that as the size of the household increases beyond four members, ‘no quantity of water is given at a low price’. Marginal consumption does not decrease with increasing household size, but remains constant, leading to a situation where larger households consume increasingly higher amounts of water. Under the IBT, this scenario results in larger households paying higher average prices for water (ibid. 2007: 15). Thus, even metered low-income households may not be subsidised by high-income households.
In the Zambian case, since low-income households on average pay higher prices, it can be argued that the direction of the subsidy, if any, is not as obvious as is often claimed. This is especially true when one considers the price of water paid by those who are not connected to the network. As indicated in Tables 1 and 2, most low-income households, especially those which buy water from vendors, kiosks or neighbours, pay higher rates than the highest tariff for those who are connected. For households which rely on mobile vendors using trucks or wheelbarrows, the price can be as high as four times the official rate for the last block.
The argument has been made that the actual cost of supplying water to low-cost communities is higher than for wealthier areas, because of the state of infrastructure, the risks of defaulting on bills, and illegal connections. But if the cross-subsidy policy is to address the equity side of the equation, it is not clear how this is resolved in this tariff structure. As things stand, the net effect of the current pricing system is that the poor, who are supposed to benefit from cross-subsidisation, end up subsidising those who are better-off.
Diluted attention to the poor
One of the conditions for a successful cross-subsidy programme is that it should be transparent (QCA 2000). Both the subsidised and the subsidiser should be aware of the existence of the programme and the rationale behind its implementation. This ensures support for the policy and also reduces tension and misunderstanding between the different parties (Dinar Reference Dinar and Dinar2000). However, although the idea of subsidising water supply attracts wide support from politicians and the public at large, there are few members of the public who are aware of the existence of the programme and how it works. This creates two major problems. First, at the policy level, it can lead to the dilution of the attention given to the poor, since politicians are led to understand that there are mechanisms to take care of the poor, when in actual fact the net benefit to the poor cannot be ascertained or confirmed. Second, such programmes may be used by the state to prevaricate as to its responsibility and commitment towards the poor, especially if the provider is a private entity. In the Zambian case, where the service provider is considered as a private entity, the net result has been the abrogation of the state's responsibility towards fixed capital investments (Dagdeviren Reference Dagdeviren2008) and towards the poor (Chitonge Reference Chitonge2007). When asked about the means to ensure access to water for the poor, government officials are quick to point to the cross-subsidy programme as a measure that takes care of the poor, even when such measures deliver little or nothing. If the cross-subsidy programme and its implementation were transparent, it would afford the public the opportunity to scrutinise the impact of the programme (GSA 2005). The main idea behind a transparent cross-subsidy system is that it allows for the assessment of costs to ensure that the service provider does not have excess revenue or revenues below cost recovery (QCA 2000).
LESSONS FROM IMPLEMENTING CROSS-SUBSIDISATION
A number of lessons can be drawn from the experience of implementing a cross-subsidy policy discussed above. Though these lessons are largely based on the Zambian experience, they can be relevant to other places where IBT policy is implemented.
Tariff design requires careful attention to all relevant factors
One predominant theme that arises from this discussion is that in order to design and implement a tariff structure that serves its intended purposes, one must take into account a number of factors. Failure to pay attention to intervening factors in tariff design and implementation may lead to a situation where well-intended policy interventions produce unintended results. In the Zambian case, while the rationale for adopting IBT is clear and laudable, neglect of possible intervening factors has led to a situation where the objectives of IBT have become hard to realise. For instance, ignoring the various ways in which people access water, the size of population on metered connections, level of water consumption for different customers, the size and type of customers' dwellings, and also possible income and price elasticities in the designing of tariffs for CUs, has led to a situation where the cross-subsidy policy is producing negative results.
Balancing competing interests
It is also clear from the discussion that designing an effective tariff for essential services such as water is a complex matter that requires balancing of competing interests and objectives. Since a tariff for basic services such as water and electricity is a public policy instrument, it is often a result of compromises between various interests. For instance, while one has to consider the long-term financial sustainability of the service provider in setting a tariff, one cannot ignore the affordability and equity concerns. Paying attention to one set of interests while ignoring the others may compromise the effectiveness of a tariff to serve as a useful public policy or regulatory instrument (Whittington Reference Whittington2003). Often it is the service providers, who are well organised and able to articulate their interests, who tilt the scale to their advantage.
In cases where the tariff is regulated by a national authority, the balancing of interests must be part of a broader process of consultation with affected sections of society. Leaving tariff design and setting to expert consultants may not produce a price structure that harmonises the diverging interests in a widely acceptable way. Balancing is a difficult but necessary process, and experience has shown that this can be achieved through a process of broader public involvement.
Comprehensive consumer database
Another important lesson arising from the discussion is that a comprehensive customer data base is vital for designing an effective water tariff. Without detailed information about various features of the customer base, it is difficult to mould a tariff that addresses the complex competing interests in water services. With no information such as the number of households connected to the network, the number of metered individual connections, the level of demand among the various customer categories, the size of each category of customer, and an estimated number of possible customers in each block (in case of the IBT), it is almost impossible to implement an effective cross-subsidy policy (Komives et al. Reference Komives2005). As Nieswiadomy & Molina (Reference Nieswiadomy and Molina1989: 352) have observed, in order to obtain a favourable pricing outcome in the water services sector, it is important to know exactly which key variables influence customer responses and demand patterns. In the absence of credible and adequate data, it is difficult to have even a sketchy picture of the situation. For example, to have a rough estimate of the population in the main cities and towns, the author had to collate data from four different sources, whose parameters may be different. This compromises the ability to plan, design and imple ment effective policy interventions. Although such data are a challenge to gather and rarely exists, especially in developing countries (Komives et al. Reference Komives2005), nevertheless the importance of having an updated customer database cannot be overemphasised. In some countries, the water service provider does not even know exactly what the demand for water is, given the high UfW and large numbers of customers not captured on the network.Footnote 5
Paying attention to context specifics
As a public policy instrument, a tariff is meant to serve particular functions in a specific context. While the IBT framework and principles may be the same everywhere, their application should be sensitive to the specific context in which the tariff is set and applied. An IBT structure designed for Mumbai may not be appropriate in Nairobi or Rio. Designing an effective IBT system for Mumbai requires paying attention to the particular features of the Mumbai customer base and other relevant factors, such as the different ways in which people access water, the state of the water infrastructure, the capacity of the service provider (technical and commercial), and so on. Not only that but the local political–economy of the water sector (Dinar Reference Dinar and Dinar2000), various interest groups, cultural practices and power relations should be taken into account. All these factors influence what a particular tariff may achieve.
Transparency
Another important lesson from the above discussion is the importance of being transparent about a cross-subsidy programme. Disclosing the information about the size, origin, direction and destination of a subsidy can enable the actors to weigh its appropriateness. In the Zambian case, while it is clearly stated in the policy that the IBT is meant to cover the deficit incurred by providing water services at lower charges to low-income groups, there is no clear evidence showing how this works in practice, and who the beneficiaries are. As a result, it is difficult to see what the programme has achieved, though it is often cited as a measure aimed at helping the poor. If the programme was transparent enough, it would be possible to assess the outcome vis-à-vis the intended objectives. Interviews with customers and senior CU officials revealed that most of them were not even aware that there was such a policy and what its role was.
* * *
This paper has looked at the experience and outcome of implementing a water cross-subsidy policy in urban and peri-urban Zambia. What emerges from this experience is that while the policy is clear about the cross-subsidy programme, it is not clear in practice how cross-subsidisation in the water services sub-sector occurs. Further, there is no clear evidence that the ultimate beneficiaries of this programme are the poor. Evidence from implementing the programme suggests that most low-income households pay higher rates per unit than high-income households. This finding is supported by results obtained from studies conducted in other developing countries which show that poor households, because they are often not connected to the public network, end up paying higher prices for water services than most well-off households which are connected to the network.
One of the key policy implications is that the design of tariffs should take into account that most of the poorest households are not connected to public networks, and are often larger than better-off households. Further, in designing a cross-subsidy policy, the specific features of the context in which the policy is to be implemented need to be carefully examined. For households which are not connected to the network, direct or targeted subsidies such as water vouchers, rebates, discounts, tariff capping or vulnerable groups programmes may be more effective than an implicit cross-subsidy programme. The programme by the Devolution Trust Fund (DTF 2006) to support the expansion of water services to peri-urban areas in Zambia is one example of a possible targeted programme aimed at helping poor households. Although the programme does not involve a direct subsidy, it is explicitly directed at poor households. A one-off connection subsidy repeatedly advocated by many analysts (Whittington Reference Whittington2003) may not be a practical short-term solution in low-income countries where governments have little capacity to raise sufficient funds for the subsidy.
One of the key lessons from this study is that in order to design a tariff that is able to reconcile the competing interests in water services, one must pay attention to the economic, social and political factors. It is apparent that such a process should be based on broad consultations. Evidently this is a complex process, but one that must be carried out. A one-sided process, dominated by international experts and donors, may not harmonise the inherently diverging interests. Therefore, policy needs to emphasise broad consultation in the process of designing and adjusting tariffs. Since the inception of a consultative process in the review of tariffs in Zambia, there has been a significant improvement in the way the public perceives and responds to tariff adjustments (NWASCO 2008). However, these consultations have been restricted to tariff adjustment, while the design of the tariff is still outside the public domain. In addition, the review process should be extended to include the impact of the policy of cross-subsidisation. Currently, tariffs are reviewed annually, but the assumptions behind the tariff structures are rarely questioned. A frequent assessment of the impact of policy would, for instance, have clarified the question of who is subsidising whom under the current arrangement.