INTRODUCTION
Leishmania are sandfly-transmitted protozoans that are responsible for a spectrum of important diseases in humans. Current treatments are limited and, in the case of front-line antimonials, are being severely undermined by widespread resistance in clinical isolates (Croft and Coombs, Reference Croft and Coombs2003; Stuart et al. Reference Stuart, Brun, Croft, Fairlamb, Gurtler, McKerrow, Reed and Tarleton2008). While the core metabolic networks of these parasites share many similarities with those of the mammalian host, there is some justification for considering parasite enzymes involved in central carbon metabolism as potential drug targets. Parasite central carbon metabolism is required for both growth and defence against oxidative stress and other host microbicidal responses, and even partial disruption of these pathways may be sufficient to prevent the synthesis of metabolites essential for viability. Moreover, significant differences in the regulatory properties of leishmanial enzymes in central carbon metabolism and their mammalian counterparts have been observed, suggesting that it might be possible to develop parasite-specific inhibitors of these otherwise highly conserved pathways (van Weelden et al. Reference van Weelden, van Hellemond, Opperdoes and Tielens2005).
Leishmania proliferate within the mid-gut of the sandfly vector and the phagolysosome of (primarily) macrophages in the mammalian host. Nutrient levels in each of these niches can vary considerably during the course of infection, complicating the identification of pathways that are likely to be important in vivo. For example, flagellated promastigote stages may experience nutrient-rich conditions in the digestive tract of their sandfly vector, as the bloodmeal is digested and following sandfy sugar meals on plant sap. Nutrient levels may be severely depleted at other times, and non-dividing metacyclic promastigotes that accumulate in the mouthparts of the sandfly are likely to be nutrient-limited. Metacyclic promastigotes may experience further nutrient limitation following their intial phagocytosis by neutrophils in the mammalian host (Peters et al. Reference Peters, Egen, Secundino, Debrabant, Kimblin, Kamhawi, Lawyer, Fay, Germain and Sacks2008), as the phagosomes of these host cells are considered to be nutrient poor (Rubin-Bejerano et al. Reference Rubin-Bejerano, Fraser, Grisafi and Fink2003). Infected neutrophils eventually undergo apoptosis and lyzed host cells and parasites are rapidly cleared by macrophages (Peters et al. Reference Peters, Egen, Secundino, Debrabant, Kimblin, Kamhawi, Lawyer, Fay, Germain and Sacks2008). The macrophage phagolysosome is a more permissive environment for Leishmania, as internalized promastigotes differentiate to non-motile amastigotes in this compartment and start to proliferate (Rubin-Bejerano et al. Reference Rubin-Bejerano, Fraser, Grisafi and Fink2003). While little is known about the nutrient composition of the macrophage phagolysosome, there is increasing evidence that it varies depending on host immune responses and activation state of infected macrophages (Naderer and McConville, Reference Naderer and McConville2008). Intracellular amastigotes may therefore have to adapt to a continually changing microenvironment. Here, we summarize current information on Leishmania central carbon metabolism, emphasizing the different experimental approaches that have contributed to a greater understanding of how Leishmania adapts to life in the mammalian host and its pathogenesis. For general reviews of central carbon metabolism in the trypanosomatidae, the reader is referred to Hellemond et al. (Reference Hellemond, Bakker and Tielens2005), Bringaud et al. (Reference Bringaud, Riviere and Coustou2006) and Tielens and van Hellemond (Reference Tielens and van Hellemond2009).
LEISHMANIA CENTRAL CARBON METABOLISM
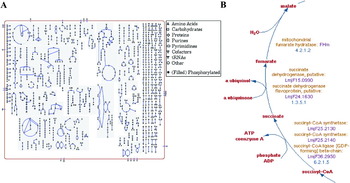
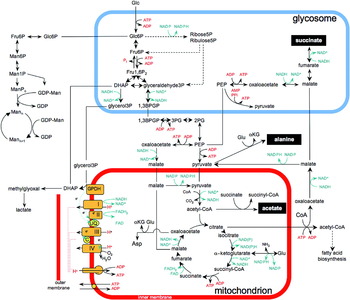
The genomes of a number of Leishmania species have now been sequenced, providing a broad overview of the parasite's metabolic potential (Opperdoes and Coombs, Reference Opperdoes and Coombs2007; Peacock et al. Reference Peacock, Seeger, Harris, Murphy, Ruiz, Quail, Peters, Adlem, Tivey and Aslett2007; Smith et al. Reference Smith, Peacock and Cruz2007; Doyle et al. Reference Doyle, MacRae, De Souza, Saunders, McConville and Likic2009). Predicted and experimentally determined metabolic pathways are contained within the curated Leishmania metabolic database, LeishCyc (Fig. 1) (Doyle et al. Reference Doyle, MacRae, De Souza, Saunders, McConville and Likic2009), as well as generic databases, such as the KEGG Pathway database (http://www.genome.jp/kegg/pathway.html). Aspects of Leishmania central carbon metabolism have also been inferred from studies on other trypanosomatids, particularly Trypanosoma brucei (Hellemond et al. Reference Hellemond, Bakker and Tielens2005; Bringaud et al. Reference Bringaud, Riviere and Coustou2006; Tielens and van Hellemond, Reference Tielens and van Hellemond2009). An overview of Leishmania central carbon metabolism is presented in Fig. 2.
Overview of Leishmania metabolic networks. (A). A screen shot of all annotated metabolic pathways in the LeishCyc metabolic database (http://leishcyc.bio21.unimelb.edu.au/) (Doyle et al. Reference Doyle, MacRae, De Souza, Saunders, McConville and Likic2009). Nodes represent metabolites, with the shape indicating class of metabolites (see key), while lines represent reactions. The results of multiple data sets (transcriptome, proteome and metabolome) can be overlaid on this metabolic map using the BioCyc Pathway tools (Doyle et al. Reference Doyle, MacRae, De Souza, Saunders, McConville and Likic2009). (B). Detail of reactions and enzymes involved in the part of the TCA cycle as represented in LeishCyc.

Central carbon metabolism in Leishmania. Schematic representation of central carbon metabolism in Leishmania promastigotes cultured in glucose-rich medium. The major secreted end-products (succinate, alanine and acetate) are shown on a black background. A number of enzymes in the glycolytic, gluconeogenic, pentose phosphate and succinate fermentation pathways are thought to be partially (with dual localization in the cytosol) or exclusively localized to the glycosome. Dotted arrows refer to multi-enzyme steps that are not shown.
Abbreviations: I–IV, complexes of the respiratory chain; αKG, α-ketoglutarate; 1,3BPGP, 1,3-bisphosphoglycerate; DHAP, dihydroxyacetone phosphate; Fru1,6P2, fructose-1,6-bisphosphatase; Glu, glutamate; GPDH, FAD-dependent glycerol 3-phosphate dehydrogenase; Glc6P, glucose-6-phosphate; Man6P, mannose-6-phosphate; ManPc, Man1,4-cyclic-phosphate; Mann, mannogen oligomers (Manβ1-2Man)n; PEP, phosphoenolpyruvate; 2PG, 2-phosphoglycerate; 3PG, 3 phosphoglycerate.

Carbohydrate metabolism
Cultured stages of Leishmania preferentially utilize simple sugars for the generation of energy (ATP and reducing equivalents) and essential biosynthetic precursors. In the absence of glucose, growth of all Leishmania stages is severely restricted, even when alternative carbon sources are available (Rodriguez-Contreras et al. Reference Rodriguez-Contreras, Feng, Keeney, Bouwer and Landfear2007). Leishmania constitutively express a number of sugar transporters that mediate the uptake of common hexoses (glucose, galactose, mannose), amino sugars (glucosamine, N-acetylglucosamine) and pentoses (ribose, xylose) (Rodriguez-Contreras et al. Reference Rodriguez-Contreras, Feng, Keeney, Bouwer and Landfear2007). These transporters belong to the facilitated transporter family, that move substrates down a concentration gradient rather than using active transport (Landfear, Reference Landfear2008). Internalized sugars are subsequently transported into glycosomes, modified peroxisome-like organelles, and phosphorylated by an ATP-dependent hexose kinase and other sugar-specific (glucose, galactose, ribose) kinases. During periods of rapid growth, most glucose-6-phosphate (Glc6P) is catabolized via the glycolytic pathway (Fig. 2). As in other typansosomatids, the first seven glycolytic enzymes are thought to be sequestered within the glycosome, while the final steps in glycolysis (including the ATP-generating conversions catalyzed by phosphoglycerate kinase and pyruvate kinase) are primarily or exclusively localized in the cytosol (Hellemond et al. Reference Hellemond, Bakker and Tielens2005; Tielens and van Hellemond, Reference Tielens and van Hellemond2009). As the early steps in glycolysis consume ATP and NAD (2 moles each for every mole of Glc6P used), these must be regenerated in order to maintain the steady-state concentration within the glycosome. In many trypanosomatids, including Leishmania, this is achieved by the import of phosphoenolpyruvate (PEP) into glycosomes and its fermentation to succinate, or decarboxylation to pyruvate (Fig. 2). As a result, succinate is secreted as a major end product in the presence of glucose as carbon source (Rainey and MacKenzie, Reference Rainey and MacKenzie1991). Glycosomal levels of NAD+/NADH may also be balanced by a glycerol 3-phosphate (G3P)/dihydoxyacetone phosphate (DHAP) shuttle between glycosomes and mitochondrion (Guerra et al. Reference Guerra, Decottignies, Bakker and Michels2006). In this cycle, DHAP is converted to G3P (regenerating NAD+) in the glycosome and then reoxidized at the inner mitochondrial membrane by a FAD-dependent G3P dehydrogenase (Guerra et al. Reference Guerra, Decottignies, Bakker and Michels2006) back to DHAP. This cycle increases glycolytic efficiency by reducing the need for succinate production, as well as providing precursors for lipid biosynthesis.
Hexose-phosphates, that are synthesized in the glycosome, can also be catabolized by enzymes of the pentose phosphate pathway to generate essential pentose phosphate sugars and NADPH (Maugeri et al. Reference Maugeri, Cazzulo, Burchmore, Barrett and Ogbunude2003). Alternatively, excess hexose-phosphates may be exported to the cytosol and incorporated into mannogen, the major short-term carbohydrate storage material of Leishmania (Ralton et al. Reference Ralton, Naderer, Piraino, Bashtannyk, Callaghan and McConville2003). Mannogen (previously termed mannan) is synthesized by a number of monogenetic (Crithidia spp., Herpetomonas spp.) and digenetic (Leishmania spp.) trypanosmatids, but not by T. brucei and T. cruzi (Gorin et al. Reference Gorin, Previato, Mendonca-Previato and Travassos1979; Mendonca-Previato et al. Reference Mendonca-Previato, Gorin and Previato1979; Ralton et al. Reference Ralton, Naderer, Piraino, Bashtannyk, Callaghan and McConville2003). Leishmania mannogen comprises relatively short chains (4–40 residues) of β1-2-linked mannose that accumulates in stationary phase promastigotes and intracellular amastigotes (Ralton et al. Reference Ralton, Naderer, Piraino, Bashtannyk, Callaghan and McConville2003). The pathway for mannogen biosynthesis has recently been delineated and shares similarities to pathways of glycogen or starch biosynthesis in other eukaryotes (Sernee et al. Reference Sernee, Ralton, Dinev, Khairallah, O'Hair, Williams and McConville2006). While none of the enzymes involved in mannogen biosynthesis have yet been identified, key enzymes involved in the conversion of glycolytic intermediates (Glc6P, Fru6P) to Man6P and GDP-Man (the essential sugar donor for mannogen biosynthesis) are located in the cytosol (Garami and Ilg, Reference Garami and Ilg2001a, Reference Garami and Ilgb), suggesting that mannogen biosynthesis and turnover occurs in the cytosol (Sernee et al. Reference Sernee, Ralton, Dinev, Khairallah, O'Hair, Williams and McConville2006). These observations suggest that hexose-phosphates are reversibly transported across the glycosome membrane, which may in turn alter the requirement for PEP import to maintain the ATP/ADP balance of this organelle.
Mitochondrial respiration
The end product of glycolysis, pyruvate, can either be secreted after transamination to alanine (a major overflow pathway in Leishmania) (Rainey and MacKenzie, Reference Rainey and MacKenzie1991), or imported into the mitochondria and converted to acetyl-CoA. Leishmania express all the enzymes involved in the tricarboxylic acid (TCA) cycle suggesting that acetyl-CoA may be completely oxidized in the mitochondrion (Hart and Coombs, Reference Hart and Coombs1982). However, studies on T. brucei procyclic stages have shown that the TCA enzymes are primarily involved in non-cyclic pathways, such as the reduction of malate to succinate, the formation of citrate for use in fatty acid biosynthesis and the catabolism of amino acids (Coustou et al. Reference Coustou, Besteiro, Riviere, Biran, Biteau, Franconi, Boshart, Baltz and Bringaud2005; van Weelden et al. Reference van Weelden, van Hellemond, Opperdoes and Tielens2005; Bringaud et al. Reference Bringaud, Riviere and Coustou2006). Further studies are therefore needed to define whether leishmanial TCA enzymes operate primarily in a cyclic and/or non-cyclic mode(s). The operation of TCA reactions in either cyclic and non-cyclic mode requires additional anaplerotic reactions to top up mitochondrial pools of TCA intermediates. Leishmania express two glycosomal isoforms of PEP carboxykinase, that could both contribute to the formation of mitochondrial malate (Fig. 2) (Bringaud et al. Reference Bringaud, Riviere and Coustou2006). The malic enzyme could also potentially catalyze the carboxylation of pyruvate to malate. These reactions are likely to be essential, as both Leishmania and other trypanosomatids lack homologues for PEP carboxylase, pyruvate carboxylase, or glyoxylate cycle enzymes that participate in anaplerotic reactions in other microorganisms.
Leishmania contain a conventional electron transport chain comprising of complexes I, II and III and a cytochrome C-complex IV, while lacking an alternative oxidase that is present in some other trypanosomatids (i.e. T. brucei) (Van Hellemond and Tielens, Reference Van Hellemond and Tielens1997a; Bringaud et al. Reference Bringaud, Riviere and Coustou2006). These complexes reoxidize NADH and succinate and generate a proton gradient that is used to drive the FoF1-ATP synthase. Inhibition of the Complex IV with cyanide or growth under anaerobic conditions induces a rapid, but reversible metabolic arrest (Van Hellemond and Tielens, Reference Van Hellemond and Tielens1997b). These observations suggest that substrate-level phosphorylation is insufficient for normal growth even under high glucose conditions. The inability of Leishmania promastigotes to grow under anaerobic conditions is also consistent with the absence of a membrane-bound fumarate reductase capable of using fumarate reduction as an electron sink (Van Hellemond and Tielens, Reference Van Hellemond and Tielens1997a). Interestingly, a similar dependence on mitochondrial oxidative phosphorylation and ATP synthesis has been observed in procyclic stages of some strains of T. brucei (Bringaud et al. Reference Bringaud, Riviere and Coustou2006; Zikova et al. Reference Zikova, Schnaufer, Dalley, Panigrahi and Stuart2009). Other T. brucei strains continue to grow when oxidative phosphorylation is inhibited (Lamour et al. Reference Lamour, Riviere, Coustou, Coombs, Barrett and Bringaud2005), suggesting that substantial variability can exist in the metabolic potential of different laboratory strains and presumably field strains of the same species.
Trypanosomatids also secrete acetate when cultivated in glucose-rich medium (Rainey and MacKenzie, Reference Rainey and MacKenzie1991). This metabolic end-product is primarily generated by a two-enzyme cycle involving acetate:succinate CoA transferase (ASCT) and succinyl-CoA synthetase. The former enzyme catalyzes the transfer of CoA from acetyl-CoA to succinate, while the latter converts the formed succinyl-CoA back to succinate, with concomitant production of ATP (Bringaud et al. Reference Bringaud, Riviere and Coustou2006). RNAi knockdown of ASCT in T. brucei has confirmed the importance of this enzyme in acetate production, as well as the presence of other acetate-producing pathways (Riviere et al. Reference Riviere, van Weelden, Glass, Vegh, Coustou, Biran, van Hellemond, Bringaud, Tielens and Boshart2004). Interestingly, recent studies on T. brucei have suggested that acetate generated in the mitochondrion may be exported to the cytosol and used to generate acetyl-CoA for fatty acid biosynthesis. This novel pathway bypasses the need for cytoplasmic citrate lyase (Riviere et al. Reference Riviere, Moreau, Allmann, Hahn, Biran, Plazolles, Franconi, Boshart and Bringaud2009).
Growth on other carbon sources
When glucose is limiting for growth, Leishmania can use amino acids as alternative carbon sources. Amino acid uptake is mediated by a large family of amino acid permeases, some of which are regulated in a stage-specific manner (Akerman et al. Reference Akerman, Shaked-Mishan, Mazareb, Volpin and Zilberstein2004; Shaked-Mishan et al. Reference Shaked-Mishan, Suter-Grotemeyer, Yoel-Almagor, Holland, Zilberstein and Rentsch2006). Catabolic pathways for many amino acids (Gln/Glu, Pro, Asn/Asp, Ala, Ser, Gly, Thr, Ile, Met, Val and Cys) that generate intermediates in the TCA cycle, have been identified or are predicted (Opperdoes and Coombs, Reference Opperdoes and Coombs2007). Other amino acids are used for specific biosynthetic purposes rather than for energy metabolism. For example, arginine and leucine are used for polyamine and sterol/isoprenoid synthesis, respectively. Unlike T. brucei, Leishmania promastigotes and amastigotes do not appear to utilize proline or threonine preferentially as alternative carbon sources in the absence of glucose (Hart and Coombs, Reference Hart and Coombs1982; Saunders, Chambers and McConville, unpublished observations). Apart from their use in oxidative phosphorylation, amino acids provide most, if not all, carbon skeletons for gluconeogenesis (Naderer et al. Reference Naderer, Ellis, Sernee, De Souza, Curtis, Handman and McConville2006). TCA cycle intermediates are channeled into this pathway by PEP carboxykinase (Fig. 2), while the essentially irreversible glycolytic reaction catalyzed by phosphofructokinase (PFK) is bypassed by fructose-1,6-bisphosphatase (FBP). Intriguingly, Leishmania FBP co-localizes in the glycosome with PFK and both enzymes are constitutively expressed and active (Naderer et al. Reference Naderer, Ellis, Sernee, De Souza, Curtis, Handman and McConville2006). As the simultaneous operation of both FBP and PFK would lead to a futile cycle of ATP consumption with major implications for the glycosomal energy balance, it is likely that these enzymes are regulated by post-translation/allosteric mechanisms that have yet to be determined.
A number of studies have shown that intracellular stages of Leishmania scavenge complex lipids from the host cells (McConville and Blackwell, Reference McConville and Blackwell1991; Winter et al. Reference Winter, Fuchs, McConville, Stierhof and Overath1994; Zhang et al. Reference Zhang, Hsu, Scott, Docampo, Turk and Beverley2005). Early studies also suggested that free fatty acids may be an important carbon source for L. mexicana promastigotes and amastigotes, based on measurement of 14CO2 production from 14C-labelled fatty acids (Hart and Coombs, Reference Hart and Coombs1982). However, more recent studies, using 13C-labelled fatty acids, have suggested that only a small proportion of carbon in TCA cycle intermediates is derived from scavenged fatty acids, despite high rates of fatty acid uptake and modification (Naderer et al. Reference Naderer, Ellis, Sernee, De Souza, Curtis, Handman and McConville2006). It is possible that different species/strains of Leishmania may utilize fatty acid β-oxidation to different extents and this may be further influenced by different growth conditions. All trypanosomatids lack a functional glyoxylate cycle (required for net conversion of acetyl-CoA to hexoses) and are therefore unable to grow using fatty acids as sole carbon source. These studies suggest that scavenged fatty acids are used primarily in lipid remodeling and biosynthetic pathways, rather than as a major source of energy.
STAGE-SPECIFIC CHANGES IN METABOLISM
Microbial pathogens frequently alter the transcription and/or translation of genes in central carbon metabolism in response to changes in nutrient conditions including the availability of carbon sources (Fan et al. Reference Fan, Kraus, Boily and Heitman2005). In Trypanosoma brucei, the differentiation of procyclic to bloodstream form trypomastigotes is associated with a marked up-regulation of glycolytic enzymes and down-regulation of enzymes involved in mitochondrial respiration and the TCA cycle, reflecting the adaptation of the latter to the glucose-rich environment of the mammalian bloodstream (Tasker et al. Reference Tasker, Timms, Hendriks and Matthews2001). In stark contrast, most genes in Leishmania central carbon metabolism are constitutively transcribed throughout the parasite life cycle. Only 3–10% of mRNAs detected in microarray analyses differ by >2-fold across all life cycle stages. Of the mRNAs that do change, the majority encode for surface antigens, cytoskeletal and ribosomal proteins (Holzer et al. Reference Holzer, McMaster and Forney2006; Cohen-Freue et al. Reference Cohen-Freue, Holzer, Forney and McMaster2007). Similarly, proteomic analyses, designed to map stage-specific alterations in protein expression, have generally failed to detect concerted changes in the levels of enzymes associated with central carbon metabolism. However, two recent proteomic analyses, on L. donovani axenic amastigotes and L. mexicana lesion-derived amastigotes (Rosenzweig et al. Reference Rosenzweig, Smith, Opperdoes, Stern, Olafson and Zilberstein2007; Paape et al. Reference Paape, Lippuner, Schmid, Ackermann, Barrios-Llerena, Zimny-Arndt, Brinkmann, Arndt, Pleissner and Jungblut2008), identified increases in enzymes involved in gluconeogenesis, mitochondrial respiration and fatty acid β-oxidation in the two amastigote stages as compared to cultured promastigotes (Rosenzweig et al. Reference Rosenzweig, Smith, Opperdoes, Stern, Olafson and Zilberstein2007; Paape et al. Reference Paape, Lippuner, Schmid, Ackermann, Barrios-Llerena, Zimny-Arndt, Brinkmann, Arndt, Pleissner and Jungblut2008). The interpretation of these data is complicated by the fact that the fold-changes are generally low (<2-fold) and are not consistent between the two different species. As most of these enzymes are possibly localized to either the glycosome or mitochondria, changes in the complement of these organelles may provide a trivial explanation for the stage-specific differences in protein expression. Regardless, it is likely that many of the metabolic responses of Leishmania to changes in nutrient levels are regulated by post-translational mechanisms. Indeed, recent analysis of the phosphoproteome indicate major changes in activity of the kinase/phosphatase network in different developmental stages (Morales et al. Reference Morales, Watanabe, Laurent, Lenormand, Rousselle, Namane and Spath2008; Rosenzweig et al. Reference Rosenzweig, Smith, Myler, Olafson and Zilberstein2008) and a number of MAP kinases have been shown to be required for infectivity in the mammalian host (Wiese, Reference Wiese1998, Reference Wiese2007; Kuhn and Wiese, Reference Kuhn and Wiese2005; Morales et al. Reference Morales, Renaud, Faigle, Shorte and Spath2007). The constitutive expression of central carbon metabolic enzymes may allow these parasites to adapt to fluctuating nutrient conditions in both the sandfly and mammalian hosts or, as outlined below, to exploit different carbon sources in these niches.
Carbon metabolism of intracellular amastigote stages
While a number of early studies showed that Leishmania amastigotes have reduced rates of glucose uptake compared to promastigotes (Rainey and MacKenzie, Reference Rainey and MacKenzie1991), recent genetic studies indicate that glucose uptake and metabolism are essential for amastigote growth and infectivity. Targeted deletion of the three high affinity glucose transporters in L. mexicana resulted in viable parasites that were highly attenuated in ex vivo macrophage infection assays (Burchmore et al. Reference Burchmore, Rodriguez-Contreras, McBride, Merkel, Barrett, Modi, Sacks and Landfear2003). The L. mexicana ▵lmgt mutant was killed at elevated temperature normally encountered in the mammalian cells, accounting for loss of virulence. Interestingly, recent studies on a suppressor strain of L. mexicana ▵lmgt mutant demonstrated that L. mexicana contains an additional hexose transporter, which could partially restore thermotolerance when up-regulated (Feng et al. Reference Feng, Rodriguez-Contreras, Buffalo, Bouwer, Kruvand, Beverley and Landfear2009). Furthermore, glucose uptake is not just required for promastigote-amastigote differentiation, as fully differentiated amastigotes also fail to grow in media lacking a hexose source (Rodriguez-Contreras et al. Reference Rodriguez-Contreras, Feng, Keeney, Bouwer and Landfear2007). Collectively, these findings suggest that the flux through the gluconeogenic pathway is insufficient to supply the hexose requirements of either promastigote or amastigote stages. Paradoxically, a L. major mutant lacking the final committed enzyme in the gluconeogenic pathway, is also severely attenuated in susceptible mice (Naderer et al. Reference Naderer, Ellis, Sernee, De Souza, Curtis, Handman and McConville2006). The inability of this mutant to proliferate in macrophages indicates that the phagolysosome compartment is relatively hexose poor. A speculative interpretation of these results is that Leishmania amastigotes utilize scarce supplies of hexose in the phagolysome for essential pathways of carbohydrate biosynthesis (such as N-glycosylation, mannogen biosynthesis), while deriving much of their energy from other carbon sources. Alternatively, the availability of different carbon sources (glucose, amino acids, etc.) in the phagolysosome might fluctuate, depending on the phagocytic/activation state of host macrophages, and multiple carbon utilization pathways are needed.
As previously discussed, amino acids are likely to constitute the major alternative carbon source used by intracellular amastigotes (Naderer et al. Reference Naderer, Ellis, Sernee, De Souza, Curtis, Handman and McConville2006). Amastigotes may obtain amino acids that have been generated by the breakdown of host proteins and peptides in the phagolysosome lumen or, alternatively, they may degrade host proteins in their own lysosome (Besteiro et al. Reference Besteiro, Williams, Coombs and Mottram2007). Intracellular amastigotes up-regulate the expression of several lysosomal proteases and these have been shown, by a variety of genetic and chemical approaches, to be important for establishment and maintenance of infection (Besteiro et al. Reference Besteiro, Williams, Coombs and Mottram2007; Bryson et al. Reference Bryson, Besteiro, McGachy, Coombs, Mottram and Alexander2009). Degradation of host proteins in the parasite lysosome could thus be important for both energy generation as well as supplying the natural amino acid auxotrophies of wild type parasites. It is notable that Leishmania mutants with unnatural amino acid auxotrophies, obtained by the genetic disruption of the relevant biosynthetic pathway (i.e. for serine and methionine), grow normally in macrophages (Scott et al. Reference Scott, Hickerson, Vickers and Beverley2008), supporting the hypothesis that the phagolysosome is generally rich in amino acids. However, some amino acids, such as arginine, may become limiting for intracellular amastigote growth (Kropf et al. Reference Kropf, Fuentes, Fahnrich, Arpa, Herath, Weber, Soler, Celada, Modolell and Muller2005). Activation of macrophages with INF-γ results in the depletion of arginine and the production of anti-leishmanial reactive nitrogen species, that both are likely to contribute to the control of amastigote growth. Conversely, proinflammatory cytokines, such as IL4, can lead to increased arginase activity and polyamine levels in the host cell that promote parasite growth. Leishmania also express an arginase that is required for conversion of exogenous arginine to polyamines. This enzyme is not essential for virulence of L. donovani or L. major suggesting that infective promastigotes and amastigotes can effectively salvage most of their polyamine requirements directly from the host cell (Gaur et al. Reference Gaur, Roberts, Dalvi, Corraliza, Ullman and Wilson2007; Naderer and McConville, Reference Naderer and McConville2008; Reguera et al. Reference Reguera, Balana-Fouce, Showalter, Hickerson and Beverley2009).
MEASUREMENT OF PARASITE METABOLISM IN VIVO
The preceding discussion highlights the need for new approaches to identify aspects of parasite metabolism that are important for survival in vivo. Recently developed metabolomic approaches may be particularly useful in this regard. Metabolomics refers to the quantitative analysis of low molecular weight metabolites in biological samples. While complementary to other ‘omics’ approaches, it also offers unique insights in microbial metabolism. Specifically, changes in the metabolome will reflect the cumulative changes in up-stream regulatory processes such as gene transcription, protein translation and post-translational modification, as well as changes in extracellular nutrient levels. Analysis of the metabolome may also reveal changes in the metabolism that are driven by alterations in metabolite uptake. Finally, analysis of the metabolome should facilitate the identification of novel or unanticipated metabolites and pathways in these organisms.
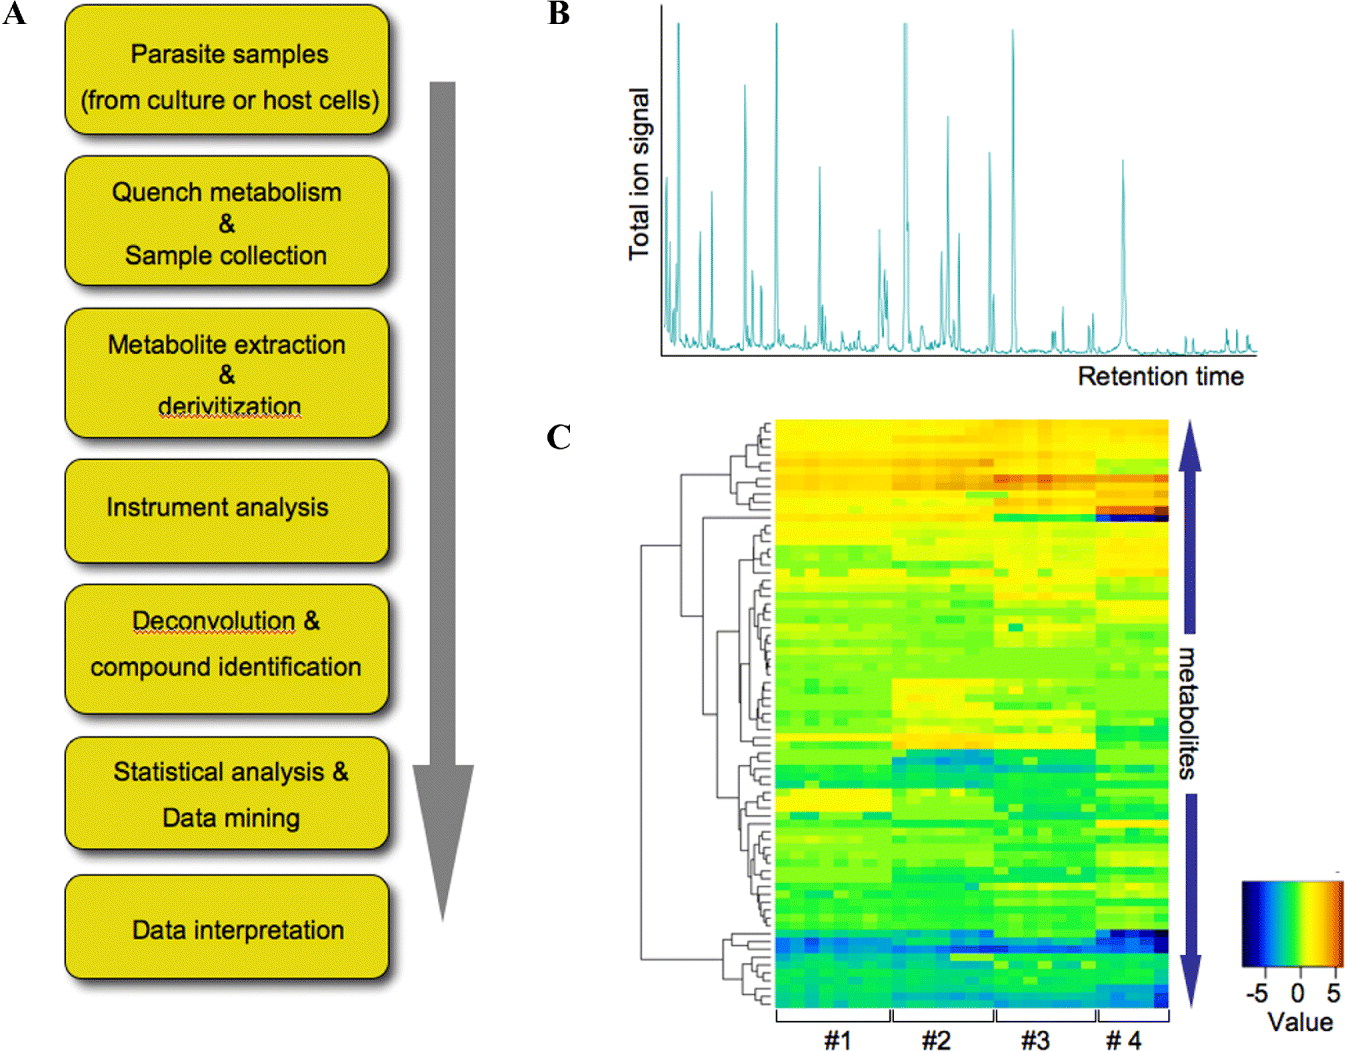
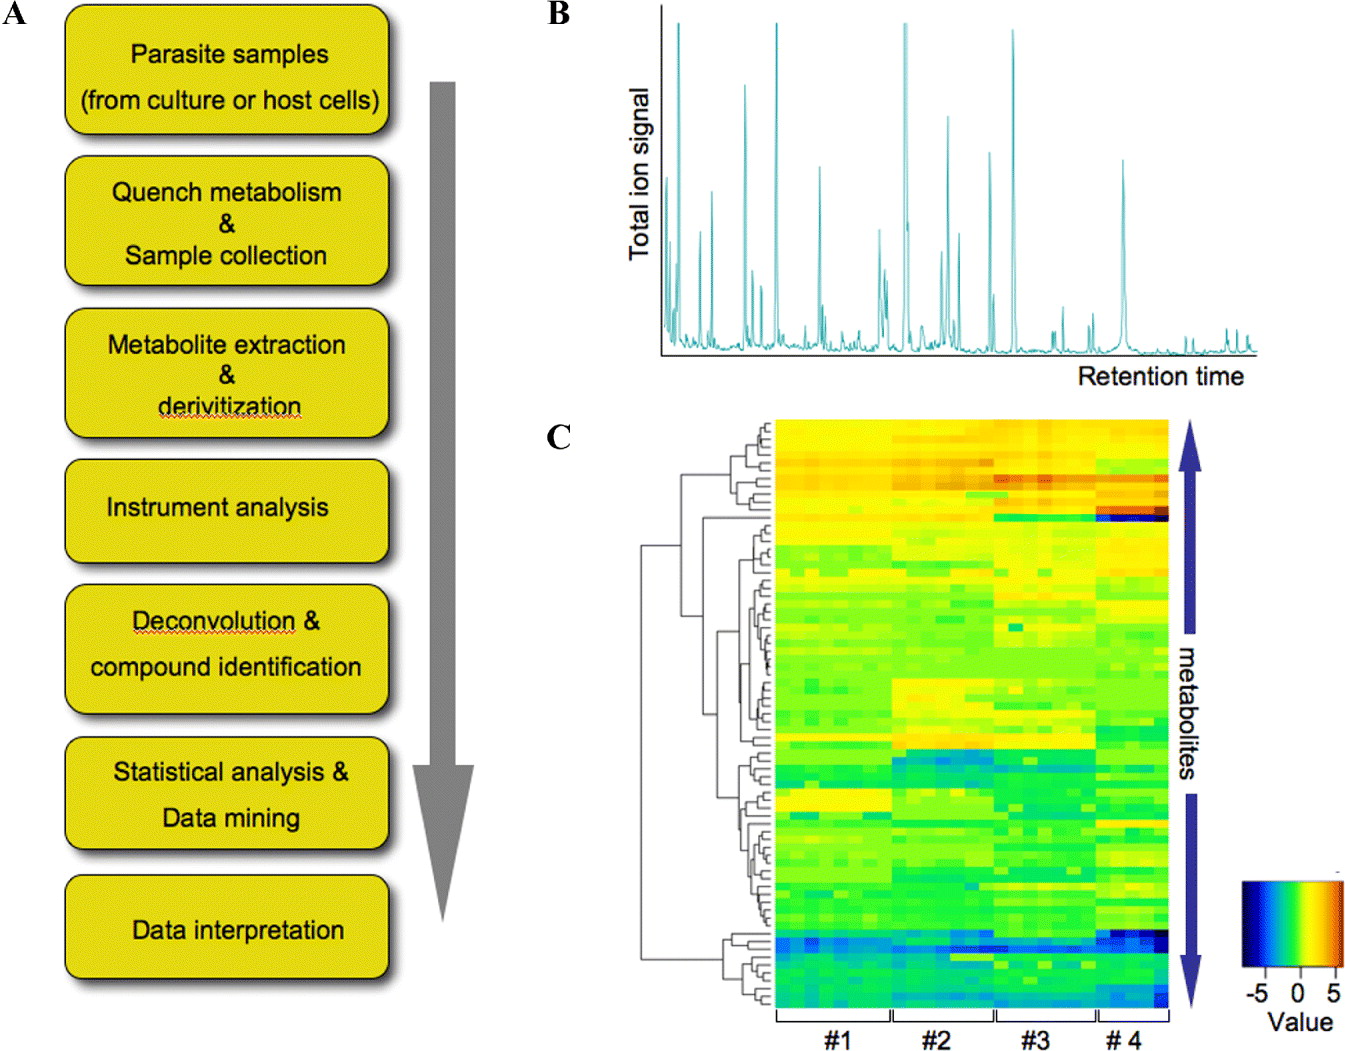
Procedures for undertaking the metabolomic analysis of Leishmania and other protozoa have recently been developed (Fig. 3) (De Souza et al. Reference De Souza, Saunders, McConville and Likic2006). These protocols typically involve; the rapid quenching of metabolism (preventing changes during subsequent processing steps) and extraction of polar and apolar metabolites; the quantitative analysis of metabolite levels using one or more analytical platforms; and subsequent down-stream signal processing and data analysis. While a number of methods for quenching metabolism have been developed for different applications, rapid (seconds) chilling of Leishmania cultures to 0°C has proved, in our hands, to reliably and reproducibly quench metabolism of different Leishmania stages, prior to harvesting by low temperature centrifugation (De Souza et al. Reference De Souza, Saunders, McConville and Likic2006). Polar and apolar metabolites are then extracted from washed cell pellets using organic solvent-water mixtures (typically containing chloroform, methanol and water) with or without further fractionation by phase partitioning. A number of different analytical approaches can be used to detect the extracted metabolites, with each approach offering distinct advantages and disadvantages. The most sensitive analytical techniques are the hyphenated mass spectrometric methods, such as gas chromatography-mass spectrometry (GC-MS), liquid chromatography-mass spectrometry (LC-MS) and capillary electrophoresis-mass spectrometry (CE-MS). GC-MS is particularly useful for quantification of intermediates in central carbon metabolism, such as sugar-phosphates, organic acids, amino acids and fatty acids (Fig. 3B and C). An analytical pipeline for analysis of Leishmania polar metabolites by GC-MS, that allows for metabolite peak alignment, deconvolution and quantification in complex GC-MS chromatograms, has been developed and greatly facilitates bioinformatics analysis (Robinson et al. Reference Robinson, De Souza, Keen, Saunders, McConville, Speed and Likic2007). LC-MS and direct-infusion MS approaches are highly complementary to GC-MS and offer a number of advantages over GC-MS, including the ability to analyze metabolites without derivitization, greater sensitivity and mass accuracy in the case of high resolution instruments (Rogers et al. Reference Rogers, Scheltema, Girolami and Breitling2009). Nuclear magnetic resonance spectroscopy (NMR) is also commonly used in metabolomic studies (Gupta et al. Reference Gupta, Goyal, Singha, Bhakuni, Roy and Rastogi1999). While generally less sensitive than the mass spectrometric approaches, NMR is capable of detecting many metabolites (particularly highly polar compounds) with a high degree of accuracy and reproducibility.
Parasite metabolomics. A. Scheme showing the steps involved in metabolic analysis of parasite systems, including Leishmania. B. GC-MS chromatogram of polar metabolites extracted from L. mexicana promastigotes. Parasite metabolism was quenched by rapid chilling of the cultures and cell pellets extracted in chloroform:methanol:water (1:3:1 v/v). Polar metabolites obtained after biphasic partitioning were methoximated and converted to their trimethylsilyl derivatives prior to GC-MS. Prominent peaks in these chromatograms include all amino acids, organic acids (TCA, GSF intermediates), neutral sugars and oligosaccharides, sugar phosphates and fatty acids. C. Quantitative analysis of polar metabolite levels in different Leishmania extracts. Extracts from log and stationary phase promastigotes (1,2) and axenic and lesion amastigotes (3 and 4), were normalized and levels of each metabolite (rows) visualized in the heat plot. The colour scale indicates the area of each metabolite peak relative to medium of all peaks (values as fold difference after normalization). Metabolite levels in independent replicate analyses (columns) demonstrate the reproducibility of these analyses.
As with other ‘omics’ approaches, analysis of the metabolome does not in itself provide information on metabolite dynamics or, in the case of microbial pathogens, the extent to which metabolites have been synthesized or imported by the organism. An extension of metabolomics analysis is to introduce metabolic precursors (glucose, amino acids, etc.) labelled with 13C (or 15N) stable isotopes (Zamboni et al. Reference Zamboni, Fendt, Ruhl and Sauer2009; Zamboni and Sauer, Reference Zamboni and Sauer2009). Measurements of 13C enrichment in a wide range of metabolites can then be used to infer metabolic fluxes. Isotope enrichment can be measured using both mass spectrometry or NMR (Coustou et al. Reference Coustou, Biran, Breton, Guegan, Riviere, Plazolles, Nolan, Barrett, Franconi and Bringaud2008). One of the major limitations of current metabolomics (and proteomics) analysis of Leishmania and other parasites is the limited coverage achieved with current technologies. One way of overcoming this limitation is to combine metabolomic analysis with mathematical modeling approaches. A mathematical model of the reconstructed metabolic network of L. major has recently been reported (Chavali et al. Reference Chavali, Whittemore, Eddy, Williams and Papin2008). The iAC560 model was used to predict metabolic fluxes under different growth conditions; to identify metabolic pathways not currently annotated in the genome (i.e. additional reactions required to make the model work); to predict nutrient requirements in different media; and to assess the consequences of single or double gene deletions (Chavali et al. Reference Chavali, Whittemore, Eddy, Williams and Papin2008). While the iAC560 model represents a major resource for modeling Leishmania metabolism, significant deviations were observed between model predictions and experimental data, reflecting the large number of assumptions used to complete the model (Chavali et al. Reference Chavali, Whittemore, Eddy, Williams and Papin2008). Data obtained from metabolomic and 13C-isotopomer experiments will aid future iterations of these mathematical models, as will the establishment of expertly curated databases such as LeishCyc (Doyle et al. Reference Doyle, MacRae, De Souza, Saunders, McConville and Likic2009). The latter uses the well-established BioCyc ontology and provides a unified platform for the development of genome scale metabolic reconstructions. The output of mathematical models, such as iAC560, are also dependent on the objective functions employed (Oberhardt et al. Reference Oberhardt, Chavali and Papin2009). For example, whether the end point is maximum growth, most efficient utilization of nutrients, minimum energy consumption, etc. Experimentally determined fluxes will facilitate the choice of an appropriate objective function to use under different conditions.
CONCLUSIONS
A variety of different experimental approaches are being used to develop a more sophisticated picture of both the metabolic potential of Leishmania and the contribution that specific pathways play in virulence and disease. From analysis of the Leishmania genomes and biochemical studies, it is apparent that these parasites can utilize a range of carbohydrates and amino acids as carbon sources. While they also contain the enzymatic machinery for fatty acid β-oxidation, further studies are needed to determine whether lipids are used as a major carbon source in vivo. Leishmania are auxotrophic for many essential metabolites, including amino acids, purines, vitamins and heme, which must all be scavenged from the host cell. We have previously speculated that the complex nutrient requirements of Leishmania may explain, in part, why these parasites colonize the otherwise hostile environment of macrophage phagolysosome. Another notable feature of Leishmania, is the apparent lack of transcriptional and translational regulation of enzymes in central carbon metabolism. This is not just a consequence of the parasite's unusual transcriptional machinery, as other trypanosomatids, notably T. brucei, can strongly regulate expression of enzymes involved in glycolysis and mitochondrial respiration during their life cycle. We speculate that constitutive expression of central carbon metabolic enzymes in Leishmania allows these parasites to exploit fluctuating nutrient levels in both the sandfly vector and mammalian host. The capacity to rapidly exploit multiple carbon sources may confer a high degree of robustness on the metabolic networks of Leishmania contributing to their remarkable capacity to cause acute, as well as long lasting chronic infections in highly divergent host environments.
ACKNOWLEDGEMENTS
Work from the authors' laboratory was supported by the Australian National Health and Medical Research Council and the Australian Research Council. MJM is a NHMRC Principal Research Fellow.