Davida Teller was, at heart, a vision scientist who studied visual development. She took on this high-potential but very difficult line of research because she was utterly convinced that theoretical explanations in vision science could be tested, and perhaps falsified, by examining how vision changed as a function of infant age.
In order to achieve her lifetime goal of challenging standard vision theory using infant data, Davida needed data on infant vision that could be subjected to the same quantitative analysis and modeling as was being applied to the vision of adults at that time. Her forced-choice preferential looking (“FPL”) method uses infant looking behavior to provide that data. FPL is based on two observations. First, in real life, infants clearly look at some important stimuli (e.g., the mother’s face), and in the laboratory, they prefer to look at “something” (e.g., a target stimulus) rather than “nothing” (e.g., a blank screen). Second, FPL is also based on the observation that an adult can easily determine whether an infant is looking to the right or the left of the vantage point of the observer. Davida was not the first person to observe these two fundamental behaviors: particularly, Robert Fantz (Reference Fantz, Ordy and Udelf1962) used dichotomous looking preference elicited by two side-by-side stimuli to study the pattern vision of infants. However, the approach taken by Fantz and others required the investigator to judge the number of looks or the total looking time the infant spent on each of the stimuli, a potentially subjective and time-consuming process. Davida’s contribution was to unite the two behaviors into a two-alternative forced choice system (Teller & Bornstein, Reference Teller, Bornstein, Salapatek and Cohen1987) that moved the study of infant vision into the realm of discrete-trial psychophysics, which is the workhorse of the study of the vision of adults.
A typical FPL stimulus is shown in Fig. 1a. At the beginning of each trial, the observer is unaware of the left–right location of the stimulus. The trial ends when the observer judges which side of the display contains the stimulus, based only on the infant’s looking behavior. If the infant subject can see the stimulus (i.e., can discriminate the stimulus from its surrounding field), he/she looks at it, and the adult “observer” can easily determine whether the stimulus is on the right or the left side of the display. In that case, performance for the infant-and-observer team on the side-identification task will be very good (typically 90% correct or better). This percent correct is scored objectively, so it cannot be inflated by wishful thinking on the part of the observer. Therefore, there is no need to measure interobserver reliability, as there is when looking time or number-of-looks is judged and tabulated. In contrast, if the infant subject cannot see the stimulus, he/she cannot look at it preferentially, and the team must perform at chance, that is, at 50% correct. The psychometric data are the fraction correct performance for the infant-and-observer team, as a function of the stimulus parameter (such as luminance or wavelength), and the statistical significance of performance is governed by a single error bar around the observer’s fraction correct.
(a) Stimulus display for infant discrimination experiments; red target stimulus is embedded within the gray surround; discrimination is studied by the ability of the infant to detect the stimulus in this display. (b) Stimulus display for infant preference experiments. The two companion stimuli are both clearly visible to the infant.

Davida’s thinking about her FPL method was greatly influenced by Giles Brindley’s philosophical analysis of visual psychophysics experiments (Brindley, Reference Brindley1970, pp. 132–138; Teller, Reference Teller1984). Brindley divided all psychophysical experiments into two classes: “Class A,” where the subject was judging the identity or nonidentity of the sensations evoked by two stimuli (this judgment could in principle be scored objectively as correct or wrong), and “Class B,” where the subject was judging some quality of the stimulus (this judgment was subjective, and could not be scored as correct or wrong). Brindley placed threshold and matching experiments into Class A, and all other psychophysical methods into Class B.
Inasmuch as the FPL method relies on the ability of the infant to distinguish between the test stimulus and its surrounding field (Fig. 1a), FPL experiments fall into Brindley’s Class A: the behavior of the infant-observer team is controlled by the visual equivalence or nonequivalence of the target and its surrounding field, and the left–right choice is objectively scored as correct or wrong. The interpretation of FPL data is therefore vulnerable to the issues that are problematical for Brindley Class A experiments in general (Teller, Reference Teller1984) (see also Boynton & Onley, Reference Boynton and Onley1962, for a slightly different critique of Brindley). The interpretation of a Class A experiment depends on the axiomatic linking proposition that when two stimuli produce identical physiological effects on the visual system, the (infant) subject must not be able to distinguish between them. Identical physiological responses must produce identical behavior. For example, if two stimuli produce identical responses in the (infant’s) photoreceptors, no amount of subsequent visual processing can tell the infant subject that they are different. This linking proposition is probably unassailable. However, its converse is not necessarily correct, in infant research as in the research on adults. It is not necessarily true that identical behavior in response to two stimuli compels us to infer identical physiological responses, because two or more different visual physiological responses could certainly produce the same visual behavior. It is easy to think of such instances: maybe the infant’s retina generates different signals from the two stimuli, but the infant visual system is not sensitive to the difference. Or, maybe the infant can see both stimuli very well, but the infant is truly indifferent as to which he/she prefers. Finally, in the case of infant subjects, infant behavior must be observed by an adult. This makes infant psychophysics slightly suspect on its face: maybe the infant doesn’t “want to look” or the adult observer “cannot tell” from the infant’s behavior what the infant sees. There are examples of all these scenarios in the infant vision literature, and progress in the study of infant vision depends on a careful review of each of these in each experiment.
Infant color vision
To make progress in the study of infant vision, Davida turned her attention to color. Her first experiment was to determine whether infants had color vision at all, that is, whether they could discriminate between lights based only on their different spectral composition. These discrimination studies were all Brindley Class A experiments. Consider the example of Fig. 1a: a red light embedded within a white surrounding field. Can the infant detect the red light (discriminate between the red light and the white surrounding field) no matter how its intensity is adjusted? We know that adults have color vision because the adult subject can detect the red light by discriminating it from the white surrounding field, no matter how the intensity of the red light might be adjusted. Of course, you cannot just give an infant an intensity control knob to determine whether there is a luminance match at which the discrimination is not possible. Therefore, Davida and David Peeples (Peeples & Teller, Reference Peeples and Teller1975) showed infants red lights, covering a sixfold range of intensities embracing the adult photopic match. They found that 2-month-old infants could make all those discriminations essential perfectly. Infants have color vision!
Next, Davida and her team moved from that descriptive experiment to a series of theoretically motivated experiments to see what photoreceptors were involved. With Russell Hamer, Orin Packer, D. Varner and others (Hamer et al., Reference Hamer, Alexander and Teller1982; Packer et al., Reference Packer, Hartmann and Teller1984; Varner et al., Reference Varner, Cook, Schneck, Mcdonald and Teller1985), she showed that most 2-month-old infants can make all the specific discriminations that are impossible for classic adult dichromats (see also Bornstein, Reference Bornstein1976; Suttle et al., Reference Suttle, Banks and Graf2002). Davida understood very clearly that those experiments did not demonstrate that infants are trichromats (Werner & Wooten, Reference Werner and Wooten1979; Teller & Bornstein, Reference Teller, Bornstein, Salapatek and Cohen1987). For just one example, if infants were using only the L cones plus the rods (or some other second, unknown visual pigment), they could be dichromats, yet they could use their rod signals (or the signals arising in some novel photoreceptor type) to discriminate between pairs of lights that match for the typical adult dichromat. Many of these experiments were done at relatively low luminance values (10 scotopic cd/m2 or less), and infants sometimes use their rods to discriminate between colored targets and their surrounding stimulus fields (Clavadetscher et al., Reference Clavadetscher, Brown, Ankrum and Teller1988; Brown, Reference Brown1990). However, subsequent experiments (Brown & Teller, Reference Brown and Teller1989) showed evidence for a “Sloan notch” in the cone test spectral sensitivity curve, which is the spectral signature of chromatic opponency (Thornton & Pugh, Reference Thornton, Pugh, Mollon and Sharpe1983), and the infant and adult data were fit successfully by a standard color-opponent model based on the spectral sensitivities of the L and M cones. So in all likelihood at least L and M cones were functioning by age 3 months, and infants were able to use them to make discriminations based on wavelength. Since that work, the field has advanced greatly in our understanding of the genetics of visual pigments, and it is now clear that there is no mysterious, previously unknown visual pigment lurking in the infant retina.
Infant color preferences
Although she developed the FPL method for use in studying infants and exploited it fully in the study of infant vision, Davida was constantly frustrated by its inherent inefficiency. The strength of the FPL method is that it is dichotomous and objective: either the adult observer guesses the left/right location of the stimulus correctly, or else the adult makes an error. However, that is also its great weakness: everyone who tests infants has the impression that the infant’s looking behavior contains more information about what the infant sees than just whether the stimulus is on the left side or on the right. And certainly, it is impossible to use FPL to study infant perception of stimuli that are so easily seen or distinguished from one another that they produce 100% correct performance on the psychometric function, because at those performance stimulus levels, no further modulation of forced-choice detection performance is possible.
Therefore, in 2003, Davida moved from Brindley Class A experiments and the stimulus shown in Fig 1a, to Brindley Class B experiments, using the stimulus configuration shown in Fig. 1b. In the Class B setup, the two stimuli are both perfectly visible to the infant, and can generally be distinguished from each other if they are presented in the usual FPL configuration (Fig. 1a). On trials when the 4-month-old infant is shown two distinct stimuli, one of which is a spectrally pure (saturated) color and one of which is a neutral gray or white (as in Fig. 1b), the infant essentially always looks at the chromatic stimulus. Of course, this preference compels the inference that the infant can discriminate between the two stimuli, but it can also show that the infant is abstracting a quality of the stimulus (its color) that is different from its visibility. This is at the heart of a Brindley Class B experiment. Davida and her group used this paradigm to study the appearance of colors in a simultaneous color contrast experiment (Pereverzeva & Teller, Reference Pereverzeva and Teller2004) and the perception of lightness in studies of simultaneous luminance contrast, adaptation, and habituation (Chien et al., Reference Chien, Palmer and Teller2003). Other investigators had been doing Class B studies of infant vision for many years (e.g., Bornstein, Reference Bornstein1975; Bornstein, Kessen & Weiskopf, Reference Bornstein, Kessen and Weiskopf1976; Dannemiller & Hanko, Reference Dannemiller and Hanko1987), but Davida’s methods differed from those studies in that her method was in the discrete-trial psychophysics tradition, with a percent-of-trials dependent measure.
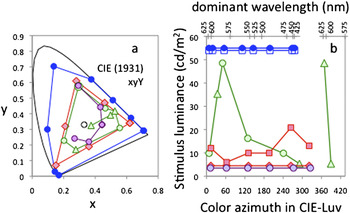
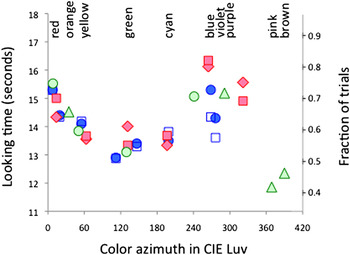
What can we learn about infant vision by examining the “spontaneous color preferences” that infants show for chromatically pure stimuli, as shown in the configuration of Fig. 1b? There are three relevant data sets: a data set of Davida’s (Teller et al., Reference Teller, Civan and Bronson-Castain2004), and experiments by two prominent psychologists who study human development, Marc Bornstein (Reference Bornstein1975) and Anna Franklin (Reference Franklin, Pitchford, Hart, Davies, Clausse and Jennings2008).Footnote 1 The three studies used rather different stimuli and methods. Fig. 2a shows the chromaticities and Fig. 2b shows the luminances of the stimuli in each of these experiments. Notice particularly that Teller et al. used both stimuli that were matched in luminance for adults (red diamonds in Fig. 2), and also stimuli that were matched in adult brightness (red squares in Fig. 2). However, all of those stimuli were most likely at mesopic luminances for infants (Brown, Reference Brown1990). Bornstein used what were probably photopic luminances (for infants), and the luminances of Franklin et al. varied widely from stimulus to stimulus. Both Bornstein and Franklin et al. recorded total looking time, whereas Teller et al. recorded the fraction of trials on which the infant preferred the colored over the neutral stimulus. Both Bornstein and Franklin et al. paired the various chromatic stimuli with each other, and Bornstein also collected a data set in which the stimuli were presented singly. Teller et al. and Bornstein used dark surrounding fields, whereas Franklin et al. matched the surrounding, alternately, to one or the other of the chromatic stimuli that infants were comparing. Fig. 3 shows the infant data from these three studies. Because the units of measure were different, we scaled the preferential looking data of Teller et al. (units on the right-hand ordinate) to reveal their similarity to the other two data sets. The units on the x-axis are the color angle within CIE-Luv 1974 uniform chromaticity space. It is important to stress again that a color at a given value along the x-axis of these graphs will differ in spectral purity and luminance, within and across the studies (Fig. 2). In spite of all these technical differences between the studies, the results are remarkably similar.
(a) Stimulus chromaticities; white point, D65. (b) Stimulus luminances. Blue, Bornstein (Reference Bornstein1975) [bandwidth = 20 nm (Bornstein & Cox, Reference Bornstein and Cox1974), CIE coordinates from Mizokami et al. (Reference Mizokami, Werner, Crognale and Webster2006); circles: stimuli presented pairwise; squares, stimuli presented singly, displaced downward for clarity]; green, Franklin et al. (Reference Franklin, Pitchford, Hart, Davies, Clausse and Jennings2008) (circles: primary colors; triangles: secondary colors); red, Teller et al. (Reference Teller, Civan and Bronson-Castain2004) (diamonds: luminance-matched; squares: adult brightness-matched); purple, Zemach et al. (2007); infant ages were: 4 months (Bornstein), 4–9 months (Franklin et al.), and 3 months (Teller et al. and Zemach et al).

Infant color preferences from three studies. Colors and symbols as in Fig. 2. The left ordinate applies to Franklin et al. (green symbols) and Bornstein (blue symbols, circles displaced upward by 10.3 s; squares displaced upward by an additional 0.53 s); the right ordinate applies to Teller et al. (red symbols).

The agreement between the data sets in this graph would surely have delighted Davida. Not only were the methods and stimuli very different, but also the three investigators were from different scientific traditions, and were testing different hypotheses. Davida was generally interested in infant color perception: “If the perceptual aspects of infant color vision are to be studied, suprathreshold stimuli must be used, and response measures that might potentially capture the perceptual dimensions of infant color vision are needed.” In contrast, Bornstein and Franklin et al. were specifically interested in the question of whether infants look longer at the “primary” lights at the centers of color categories (red, yellow, green, and blue) or at “secondary” lights at the boundaries between primary color categories (Bornstein: orange, chartreuse, cyan, and violet; Franklin: orange, purple, pink, and brown). Bornstein asked, “Do infants at this early age look more out of pleasure (at the more salient category centers) or in order to comprehend and categorize (at the more cognitively challenging category boundaries)? … If infants fixate longer at color category boundaries the results would tend to support the cognitive interpretation of (infant) attention; whereas, if infants fixate longer at color category centers the results would favor the preference interpretation.” Franklin and her colleagues were interested in the question of whether, over development, “the fundamental nature of primary compared with secondary colors in color language arises from the neurophysiology of the human visual system... or whether the salience of certain color categories... should be attributed to... cognitive, and cultural dimensions (e.g., Jameson & D’Andrade, Reference Jameson, D’Andrade, Hardin and Maffi1997; Jameson, Reference Jameson2005) or the... statistical properties of colors in the natural environment (Yendrikhovskij, Reference Yendrikhovskij2001) [p. 472] . Franklin et al. examined this question by “assessing the salience of primary and secondary colors in preverbal infant perception when no language is involved.”
In spite of these differences in stimuli, methods, and intellectual traditions, the data look remarkably similar, especially on the long-wavelength end (at the left of the graph).
Theoretical interpretation of the data
Are the differences in infant looking behavior across colors due to different sensory signals in the low-level color mechanisms, or are they due to higher-level cognitive effects, such as infant hedonistic preference, color comprehension, or categorical color perception? It is hard to make quantitative predictions based on those cognitive effects, but it is easy to test (and possibly refute) the hypothesis that the sensory signals of low-level color mechanisms account for infant looking behavior. If the data can be fit by a standard model of color vision, that will strengthen the view that infant color preferences are sensory in origin; otherwise, the incompatibility of the data with the sensory model will strengthen the cognitive explanations for infant color preferences.
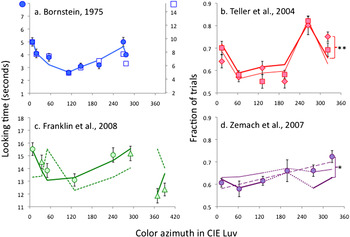
The sensory model proposed by MacLeod and Boynton (Reference MacLeod and Boynton1979) fit the data well (Fig. 4). The MacLeod–Boynton space has dimensions defined by the responses of the L, M, and S cones, which we model here using the Smith–Pokorny fundamentals (Smith et al., Reference Smith, Pokorny and Starr1976). Luminance is L + M, and within the constant-luminance plane, the RG axis is the contribution of the L cones (the contribution of the M cones is implicit), and the B axis is S. The coordinates of a particular color in the MacLeod–Boynton color space were:
 $${\rm{Lum}} = L + M{\rm{,}}$$
 $$RG = {L \mathord{\left/ {\vphantom {L {\left( {L + M} \right)}}} \right. \kern-\nulldelimiterspace} {\left( {L + M} \right)}},$$
 $$B = {S \mathord{\left/ {\vphantom {S {L + M}}} \right. \kern-\nulldelimiterspace} {L + M}}.$$
The fits of the MacLeod–Boynton model to the data. Colors and symbols as in Fig. 2. (a) Bold line: fit to the average of both sets of data. (b) Bold line: fit to luminance-matched data; fine line: fit to brightness-matched data. (c) Bold line: fit with the colors projected onto the constant-luminance plane; dashed line: fit in three dimensions, including luminance (see text for details). (d) Bold line: fit with the same parameters as for the luminance-matched stimuli in (b); fine line, parameter k1 adjusted separately for the Zemach et al. data set; dashed line, linear regression of nonzero slope. Dotted lines in (d) indicate that the cyan data point (at about 198° azimuth in CIE-Luv) was obtained using large amounts of extrapolation. Asterisks, the model prediction was significantly different from the corresponding data point at *P < 0.05, **P < 0.01, based on t-tests, with 10 subjects, after Bonferroni correction for multiple comparisons.

In this analysis, an infant’s performance for a given target stimulus depended on the Euclidean distance D t,c that separated the target t from the comparison stimulus c, within the constant-luminance plane. There is no a priori reason to expect that the contributions of the RG and B dimensions to infant color discrimination are the same as those of the adult. Indeed, the optical density of the ocular lens is known to be low in infants (Werner, Reference Werner1982; Hansen & Fulton, Reference Hansen and Fulton1989) (reviewed in Brown, Reference Brown1990), and could cause an increase in the contribution of B (Smith & Pokorny, Reference Smith and Pokorny1995), so we held the RG contribution at 1.0, and allowed the relative scaling of the two axes to be adjusted by a free parameter k1.
 $$D_{{\rm{t,c}}} = {\rm{Sqrt}}\left( {\left( {RG_{\rm{t}} - RG_{\rm{c}} } \right)^2 + k_1 {\rm{*}}\left( {B_{\rm{t}} - B_{\rm{c}} } \right)^2 } \right).$$
In Teller et al., each target stimulus was compared to a white standard, so performance was predicted from the separation of each stimulus and its white point in color space. In Bornstein, stimuli were compared pairwise within a dark surrounding field, so performance was predicted from the distance separating each target stimulus from the average location of all the stimuli in the study. In Franklin et al., stimuli were compared pair-wise to each other, embedded within a white surround that matched one of the stimuli in luminance. In that case, we compared each stimulus to the average luminance of the white surround, which was near the average location of all the colored stimuli in the experiment. In each case, if the target was farther from white (and looked more saturated to adults), our model predicted that infants would look at it at longer or more frequently than a stimulus that was closer to white. We also needed a and b, the free parameters required to predict performance P (looking time or fraction of trials):
 $$P = a \times D + b.$$
The least-squares fit of the model to these three data sets is generally good (Fig. 4a–4c). The single exception is the purple stimulus for the luminance-equated condition in Fig. 1c. Particularly, notice that the fit to the pink and brown data of Franklin et al. (lower right corner of Fig. 4c) is not bad.
The key characteristic of the MacLeod–Boynton model is that it allowed us to deal conveniently with luminance by considering only the RG and B coordinates of the stimuli within the constant-luminance plane, as in eqns. (2) and (3), above. This was absolutely necessary: if we allowed luminance to remain in the model, it could not be fit to the Franklin data. The problem is illustrated in Fig. 4c, where the full three-dimensional MacLeod–Boynton model, including luminance, is shown as a dashed line:
 $$D_{{\rm{t,c}}} = {\rm{Sqrt}}\left( {k_2 \times \left( {{\rm{Lum}}_{\rm{t}} - {\rm{Lum}}_{\rm{c}} } \right)^2 + \left( {RG_{\rm{t}} - RG_{\rm{c}} } \right)^2 + k_1 {\rm{*}}\left( {B_{\rm{t}} - B_{\rm{c}} } \right)^2 } \right).$$
The dashed line in Fig. 4c was predicted from eqn. (6) when the luminance contribution was k2 = 1, and the parameters a and b in eqn. (5) were adjusted so that the mean and standard deviation of the prediction were the same as the mean and standard deviation of the data. The fit in Fig. 4c is poor. When the best fitting values of a and b from eq. (5) were used, the optimum contribution of luminance to eq. (6) was k2 = 0.0002. That is, the fit was best with essentially no luminance contribution at all. When the luminance contribution was held at k2 = 1 and a and b from eq. (5) were adjusted for optimum fit, the best fit was obtained at a = 0: a constant function fit the data better than the model. This three-dimensional model (and any other model that does not remove luminance) predicted that infants will look much longer at the very bright yellow light than at the red light, which was much dimmer, and that infants will look longer at the very bright, desaturated “pink” light than at the “brown” light, which was more saturated but much dimmer. Both of those predictions were incorrect. In a similar vein, the different luminance values between conditions in Teller et al. (Reference Teller, Civan and Bronson-Castain2004) (Fig. 2b, compare red squares and diamonds) had little effect on the overall shape of the data set in Fig. 4b, and introducing luminance into the model did not improve the fits.
We explored the uniqueness of the model by considering other color models, using the same general method described above. A model based on the DKL color space (Krauskopf et al., Reference Krauskopf, Williams and Heeley1982; Derrington et al., Reference Derrington, Krauskopf and Lennie1984) fit the data essentially as well as the MacLeod–Boynton model did, but only if we divided each of the DKL color channel responses by the luminance [the main difference between the MacLeod–Boynton model and the DKL model is that the MacLeod–Boynton model does this automatically (eqns. 1–3)]. The Hurvich & Jameson model of color perception (Hurvich & Jameson, Reference Hurvich and Jameson1957), even when normalized to remove the contribution of luminance, was less successful. We also draw the reader’s attention to another paper from the Franklin group and Anya Hurlbert (Franklin et al., Reference Franklin, Bevis, Ling and Hurlbert2010), which concluded that the RG cone contrast, but not the B cone contrast, predicts about half the variance in infant preference in their experiment (see footnote 1, above).
It is noteworthy that none of these models required a contribution from the rods. Teller et al.’s stimuli were all very large and they were not bright enough to be in the purely photopic luminance range for infants (Figs. 3 and 4 of Brown, Reference Brown1990), so the rods surely responded differentially to these stimuli. The lack of a required rod component in these models would be expected if rod signals travelled to the brain via the luminance channels. The model fits might not definitively rule out any rod contribution at all to these data sets, but it makes it highly unlikely that rods predominate infant preferences among colors.
To summarize the model fits, models without a luminance contribution generally succeeded, and the model based on the constant-luminance plane of MacLeod–Boynton color space was particularly successful. In contrast, models that assume a luminance contribution failed. Therefore, we can conclude from this part of the curve-fitting exercise that when two stimuli of very different chromaticities are presented to the infant in a configuration like Fig. 1b, the infant looking behavior is governed by stimulus chromaticity, and not by luminance.
The Zemach et al. data set
The model described above is, at its heart, a model of sensory color differences. When we fitted the MacLeod–Boynton model to the data set of Teller et al. (Reference Teller, Civan and Bronson-Castain2004), we predicted that infants will prefer stimuli that are more different from white, compared to stimuli that are less different from white. If this is correct, then there should be no difference in infant preference among stimuli that are equally perceptually different from white. So, several years later, Davida and her team did a more elaborate preference experiment (Zemach et al., Reference Zemach, Chang and Teller2007) to examine that hypothesis. They created a set of stimuli, of constant luminance, whose chromatic purity was manipulated to make them equally discriminable (for infants) from the white comparison stimulus, at 75% correct detection, in the stimulus configuration shown in Fig. 1a. If infants’ preferences were controlled by their ability to tell the difference between the chromatic stimulus and the white comparison stimulus, these chromatic stimuli should also be equally preferred, when compared to white in the stimulus configuration in Fig. 1b. A crucial assumption here is that lights that are equally discriminable from white are equally perceptually different from white, a reasonable, if unproven, assumption.
Fig. 4d shows the preference data from this experiment (Zemach et al., Reference Zemach, Chang and Teller2007, Fig. 8).Footnote 2 According to the hypothesis that infant color preference is controlled by perceived color differences, the Zemach data should be constant. They were not constant (P < 0.0001 on the one-way ANOVA performed by Zemach et al.), so the authors concluded that something other than the detectability of the color differences between the chromatic stimuli and white must be responsible for infant preferences for those chromatic stimuli. In Fig. 4d, we fitted the MacLeod–Boynton model to those data, holding all the constants at the levels set for Teller et al. in Fig. 4b. The result (bold purple line in Fig. 4d) showed a statistically significant mismatch for the purple stimulus (t 9 = 3.52, P < 0.05, based on 10 subjects, after Bonferroni correction for five repeated comparisons). This could be improved (fine purple line in Fig. 4d) by refitting the constant k1 for that data set only, without regard to the fits to Fig. 4b. This improved fit left no statistically significant difference between the data points and the model (after Bonferroni correction). However, Teller et al. and Zemach et al. used identical methods, and the experiments were carried out in the same laboratory using only slightly different stimuli, so it does not seem right to allow this extra degree of freedom. A regression line with nonzero slope (long-dashed line in Fig. 4d) also fit the data nicely, leaving no significant difference between the data and the regression line. However, there is no theoretical reason to fit such a line, given that the stimuli were all equated empirically to be equally discriminable from white. None of the other models we tried for the other data sets did any better than the MacLeod–Boynton model in fitting the Zemach et al. data. There is no established way of incorporating rods into the MacLeod–Boynton model, but even ignoring this fact, we could find no simple way of adding a rod contribution that improved matters materially. Thus, the discrepancy between the infant behavior and the prediction in the purple end of Fig. 4d is probably real, and is not accounted for by the standard model.
What are we to make of the statistically significant failure of the standard model to predict the luminance-matched purple data in Teller et al. and Zemach et al.? It is tempting to attribute these preferences to a hedonistic preference for purple colored stimuli. However, the other data sets we examined here did not suggest this, because the standard sensory model fit the data in the purple condition in those other data sets well. Furthermore, the residual differences were not all in the direction of a purple preference. Specifically, the Teller et al. brightness-matched data were above the prediction for purple stimuli (compare the squares to the red bold line in Fig. 4c), but the data for purple stimuli in Franklin et al., and the data for violet stimuli in the Bornstein data set were at or below the prediction, all by nonsignificant amounts. We therefore do not have any particular explanation for these two failures.
The MacLeod–Boynton model we have been working with provides a useful framework for studying color information processing in the early visual pathway. When it was pushed to its limit, this standard model did not fully account for infant spontaneous preferences in the purple condition of the luminance-matched data in the Teller et al. data set and the purple condition of the Zemach et al. data set. However, that failure should not detract from its overall success in showing that the preference of infants is controlled by the chromaticity of highly saturated stimuli, even when those stimuli are not very bright [as in the Teller et al. (Reference Teller, Civan and Bronson-Castain2004) and in the Zemach et al. (Reference Zemach, Chang and Teller2007) experiments], or when those stimuli may be brighter or dimmer than the surrounding field (Bornstein, Franklin et al.), or when the stimuli being compared differ in luminance (Franklin et al., Teller, 2004). In the 1970s and 1980s, FPL experiments showed that infants have color vision; here, preferential experiments showed that infants often ignore luminance and look at stimuli because of their colors.
Discussion
Any visual psychophysicist will recognize the common psychophysical assumption here: when behavior is based on color, the null hypothesis is that behavior can be accounted for by an early, low-level representation governed by linear opponent combinations of signals from the three cone types. We only infer something different (i.e., reject the null hypothesis) when the evidence against the low-level representation of color is very compelling. In this particular case, the infant data were generally well fit by a low level representation, provided we removed any dependence of the resulting signal on luminance. However, it is perilous to conclude from an analysis like ours that we have understood anything terribly deep about infant vision by the successful fitting of these standard models. Davida warned us repeatedly about the pitfalls of drawing too specific an analogy between behavior and its physiological underpinnings, based only on mathematical descriptions like the one we show here.
For this reason, we offer our fits to four sets of infant spontaneous color preference data with little comment, beyond a simple list of hypotheses that have been ruled out by that exercise. We have ruled out the hypothesis that infant behavior is always controlled primarily by luminance: the standard chromaticity model fit the data well if the stimuli were projected onto the constant-luminance plane, but it particularly fit the Franklin et al. data very badly, and did not fit the Teller et al. data any better, when luminance was added back into the model. Bornstein believed that “since the stimulus wavelengths were photometrically equated for luminance,” the different looking-times for the different wavelength bands of light “provide evidence for color vision at this early stage of infancy.” At the time, it was not known with any degree of certainty whether the luminous efficiency function of infants was similar to that of adults (see Werner & Wooten, Reference Werner and Wooten1979, for an in-depth discussion of this point). However, the present analysis showed that even if there were mismatched luminances for some or all of the stimuli, none of that mattered, because infant looking behavior was governed by the two chromatic equations [eqns. (2) and (3)] with no luminance contribution at all.
The present analysis also ruled out the hypothesis that infant mesopic color perception is greatly influenced by signals from rods, under conditions where there is clear evidence from other work (Clavadetscher et al., Reference Clavadetscher, Brown, Ankrum and Teller1988) that rods predominate infant matching behavior for much of the spectrum. The data reviewed here were generally well fit by the standard model, without consideration of rods at all. This suggested that the rod contribution to infant vision travels along with luminance signals, which the infants apparently ignore.
We have also ruled out the hypothesis tested by Bornstein and by Franklin et al. that preverbal infants make a cognitive distinction between primary and secondary colors. Bornstein reported that the focal colors were more preferred than their neighboring transitional colors. However his results did not provide evidence of a hedonistic preference for primary (center) rather than a cognitive interest in secondary (boundary) colors, because his data can be fit well by the standard sensory model. Franklin et al. reported “a striking salience of focal red and very weak salience of focal pink and brown,” but average salience of other primary colors (yellow, green, and blue) and secondary colors (orange and purple). They cautiously concluded that “although the distinction between primary and secondary colors is apparent in many of the world’s languages, …there is limited evidence from this study to support this distinction in preverbal perception.” Their results were also generally well fit by the standard model, suggesting that the best explanation is sensory rather than cultural. The present exercise also rules out the standard concepts from the adult literature on color cognition outlined by Franklin et al. It is not necessary to posit that infants must learn the statistical distributions of color in the world (Yendrikhovskij, Reference Yendrikhovskij2001), or that culture somehow influences the tendency of children to prefer some colors more and other colors less.
Instead, these four previously published data sets suggest that the color preferences of infants as young as 4 months result straightforwardly from the fact that the sensory response to colors depends on their chromaticity. We do not espouse the extreme reductionist hypothesis that every single aspect of infant color vision can be explained by the standard model of the contrasts presented to the cones. But neither do we find much evidence here to indicate that the color perception of infants is different from that predicted by the standard model of the color vision, based on the low-level sensory processes of the human visual system.
Acknowledgment
Support from NSF BCS-1152841 to D.T.L. We are grateful to Dr. Loraine Sinnott for statistical advice.