Introduction
In the transitional period from the post-5G toward 6G, the design of the radio frequency front-end (RFFE) for mobile terminals is undergoing a profound architectural revolution [Reference Balteanu1]. Currently, the widespread adoption of carrier aggregation technology, the increasing number of multiple-input multiple-output (MIMO) channels, and the congestion of noncellular communication frequency bands are reshaping the radio frequency (RF) environment [Reference Balteanu1, Reference Fattinger, Volatier, Al-joumayly, Yusuf, Aigner, Khlat and Granger-jones2]. Therefore, achieving concurrent processing of signals across any number of frequency bands in miniaturized terminals has become a critical bottleneck. This context has greatly spurred the demand for miniaturized, high-performance multiplexers, especially in wearable devices [Reference Detratti, Lopez, Perez, Palacio and Lobeira3–Reference Bouse, King and Chu5]. Therefore, achieving both low loss and high isolation with an extremely compact size has become a challenge in the design of the next-generation RFFE.
Surface acoustic wave (SAW) filters play a vital role in modern RFFE systems through continuous innovation in materials, acoustic structure, and packaging technologies [Reference Ruppel6, Reference Chen, Li and Zhu7]. Among these, lithium tantalate on insulator (LTOI) technology is increasingly demonstrating significant potential as a multiband integrated platform [Reference Takai, Iwamoto, Takamine, Fuyutsume, Nakao, Hiramoto, Toi and Koshino8–Reference Takamine, Takai, Iwamoto, Nakao and Koshino10]. By precisely confining acoustic energy within submicron-sized piezoelectric film, LTOI can achieve resonators with a high-quality factor [Reference Seah, Ballandras, Courjon, Bernard, Clairet, Makdissy, Laroche, Aspar, Michoulier, Ndiaye, Raveski, Chappaz, Hilt, Alami-idrissi, Achatz, Rolland, Didier, Allibert, Drouin and Huyet11], providing an excellent physical basis for multiband integration.
For the implementation of multiplexers, traditional solutions rely on combinations of discrete components or multi-chip module packaging [Reference Yang, Hsiung, Hung and Lin12–Reference Tseng, Yang, Hsiao, Chen and Wu16]. While technically feasible, these approaches suffer from drawbacks. For example, the increased number of components leads to higher system complexity, interconnect parasitic effects worsen insertion loss (IL), and miniaturization remains a challenge [Reference Liu, Pei, Zhao, Xu, Zhong and Yu17, Reference Joseph and Ball18]. Conversely, monolithic integration offers a promising path to improve chip yield, reduce package size, and reduce parasitic effects. However, it also imposes higher demands on substate performance and impedance matching design methodologies.
In existing multiplexer designs, the passband impedance of each channel is typically designed to be 50 Ω. For conventional duplexer designs, simple phase shifters or LC networks are widely utilized to rotate the counter-band impedance to a high-impedance region [Reference Iwaki, Tanaka, Ueda and Satoh19–Reference Takai, Iwamoto, Takamine, Wada, Hiramoto, Koshino and Nakajima26]. However, designing a triplexer with a large frequency gap remains challenging. An example is the integration of GPS L5/L1 and Bluetooth (BT), where the overall span exceeds 1.3 GHz. Under such conditions, the aforementioned design methods are no longer applicable. Additionally, the wide-bandgap will introduce issues with high-frequency spurious responses.
To address these challenges, this study proposes an analytical synthesis strategy based on numerical de-embedding. This approach effectively achieves matching across a wide-bandgap of 1.3 GHz. A notch inductor structure is introduced to suppress leakage in the specific frequency band. Based on this method, we validated and realized a monolithic SAW triplexer based on LTOI substrate. This device achieves monolithic integration of dual-frequency GPS L1/L5 and BT within a compact 2.5 mm × 2 mm footprint, demonstrating significant potential for wearable applications.
Design
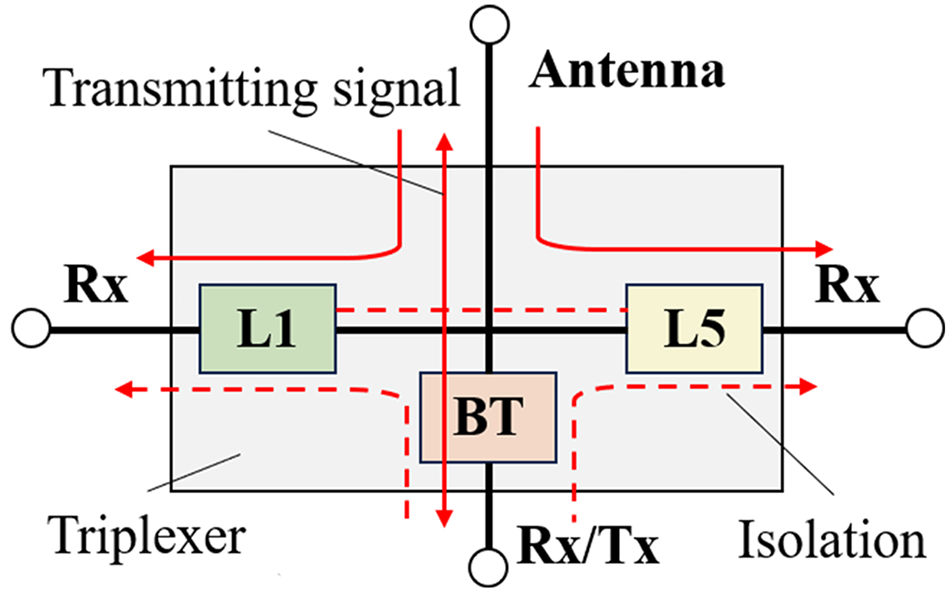
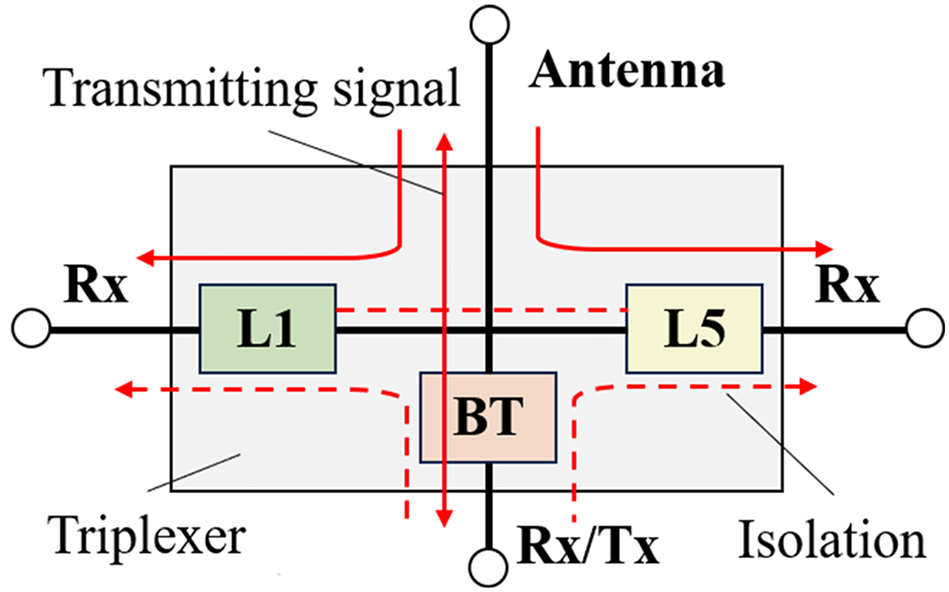
The proposed triplexer is designed for dual-frequency GPS L1/L5 and BT band. The basic configuration of the proposed four-port triplexer is shown in Fig. 1. As shown in Fig. 1, the L5 and L1 bands are used for dual-frequency GPS positioning signal reception, while the BT band realizes RF wireless communication transmission and reception in the RF front-end module. The dashed line in Fig. 1 represents the leakage path of the signal between the frequency bands. Good isolation between frequency bands is crucial in the device design. The frequency ranges of the L5, L1, and BT bands and other specifications of the three frequency bands are summarized in Table 1.
Basic configuration of the proposed triplexer.
Summary of specification
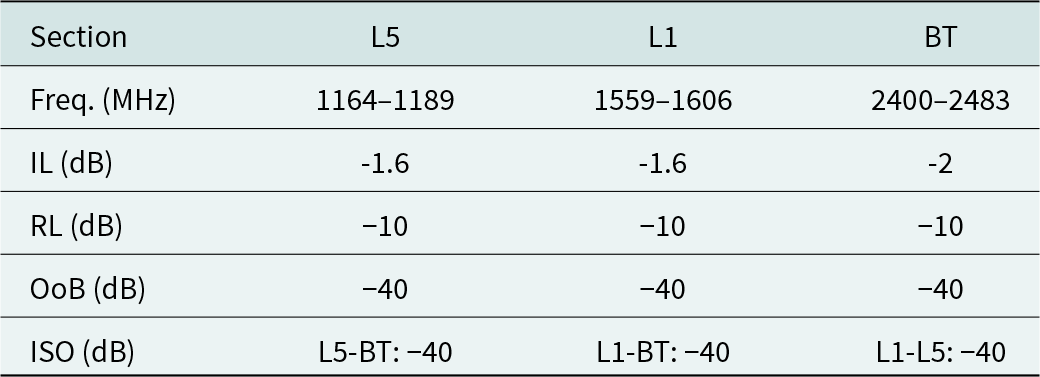
Table 1 Long description
The table lists RF performance specifications for three sections: L5, L1, and BT. It provides each band’s frequency range in megahertz, along with insertion loss, return loss, out-of-band rejection, and isolation values in decibels. L5 covers 1164 to 1189 MHz and L1 covers 1559 to 1606 MHz; both have insertion loss of minus 1.6 dB. BT covers 2400 to 2483 MHz and has slightly higher insertion loss at minus 2 dB. Return loss is consistent across all three sections at minus 10 dB, and out-of-band rejection is also consistent at minus 40 dB. Isolation is specified between band pairs and is minus 40 dB for L5 to BT, L1 to BT, and L1 to L5. Values are given as targets in decibels; interpretation depends on the measurement setup and test conditions, which are not included here.
ISO = isolation between two frequency bands; OoB = out-of-band rejection; RL = return loss.
Analytical synthesis of matching networks
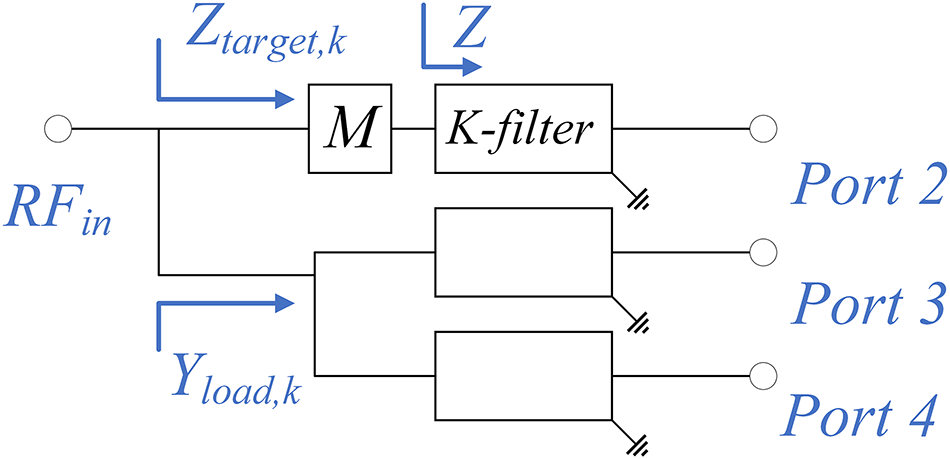
SAW filters exhibit capacitive behavior in the low-frequency regions far from the passband. This derives from the fundamental physical characteristics of SAW resonators. Utilizing this principle, we can employ numerical methods to determine the integrated matching network in triplexer design. This approach avoids the ambiguity in topology selection and simulation convergence issues often encountered in direct optimization. For triplexer design, we propose a numerical de-embedding matching method. The process can be summarized in the following four steps. The schematic diagram of the triplexer analytical synthesis is shown in Fig. 2.
The schematic diagram of triplexer analytical synthesis.
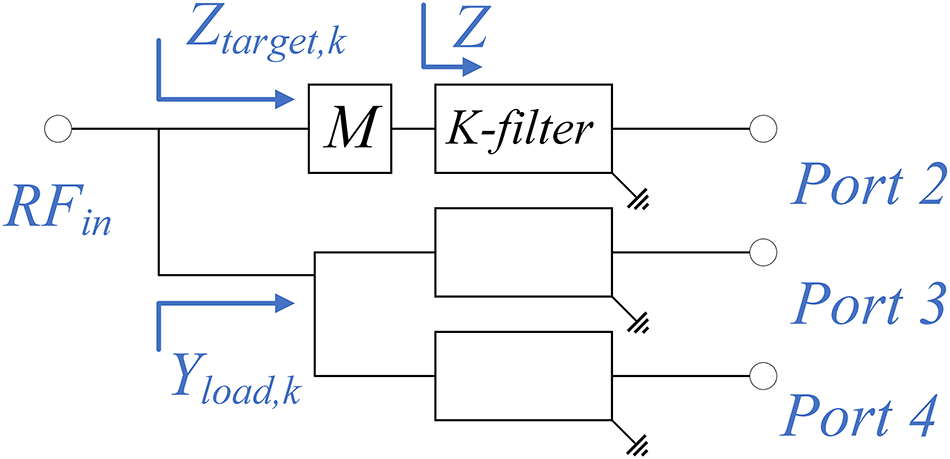
Characterization of cumulative parasitic loading: For any specific channel k operating at the center frequency  ${f_{ck}}$, the other N − 1 channels are all within its stopband. Therefore, these non-operating channels introduce a significant reactive load effect at the common port. We define
 ${Y_{load,k}}$ as the cumulative load admittance. It represents the sum of the admittance of the other channels at
 ${f_{ck}}$:
 \begin{equation}{Y_{load,k}}\left( {{f_{ck}}} \right) = \mathop \sum \limits_{i \ne k}^N {Y_{in,i}}\left( {{f_{ck}}} \right) = {G_{para,k}} + j{B_{para,k}} \approx j{B_{para,k}}{\text{ }}\end{equation}
where  ${G_{para,k}}$ and
 ${B_{para,k}}$ represent the parasitic conductance and susceptance at the frequency of channel k, respectively. When
 ${f_{ck}}$ of channel k is in the deep rejection region (far from the passband), the conductance
 ${G_{para,k}}$ of the SAW filter can be ignored.
De-embedding complex targets: To make sure 50 Ω impedance matching at the antenna’s common port, the target impedance of the matching network for channel k should be designed as a pre-distortion complex admittance 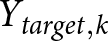 ${Y_{target,k}}$. This admittance can effectively compensate for the parasitic load from step one.
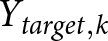 ${Y_{target,k}}$ can be expressed as the following equation:
 \begin{equation}{Y_{target,k}}\left( {{f_{ck}}} \right) = {Y_0} - {Y_{load,k}}\left( {{f_{ck}}} \right) = {G_0} - j{B_{para,k}}{\text{ }}\end{equation}
where  ${Y_0}$ is the characteristic admittance of 20 mS. Converted to the impedance domain, the synthetic
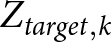 ${Z_{target,k}}$ target can be expressed as:
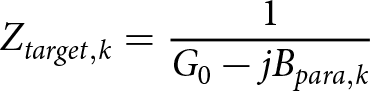 \begin{equation}{Z_{target,k}} = \frac{1}{{{G_0} - j{B_{para,k}}}}{\text{ }}\end{equation}
Construction of feasible matching regions (FMR): The strict single-point target 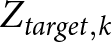 ${Z_{target,k}}$ is relaxed to a solution space that satisfies the bandwidth requirements. Therefore, we design the FMR as shown in the following equation:
 \begin{equation}FM{R_k} = \left\{ {Z\left( f \right) \in \mathbb{C}\left|\left| {\frac{{Z\left( f \right) - {Z_{target,k}}}}{{Z\left( f \right) + {Z_{target,k}}}}} \right|\right. \leqslant {{{\Gamma }}_{spec}},\forall f \in B{W_k}} \right\},\end{equation}
where Z represents complex impedance,  ${{{\Gamma }}_{spec}}$ represents the target reflection coefficient at the antenna common port, and
 $B{W_k}$ represents the operating bandwidth of channel k. This region indicates that the antenna common port meets the system return loss (RL) requirements.
- Topology and trajectory implementation: Within the boundaries defined by FMR, one can transform the intrinsic impedance of the k-channel filter to the FMR, thus achieving the synthesis of a triplexer.
Characterization of individual filters
The circuit structure of the individual filter in the proposed triplexer is shown in Fig. 3. Each series or parallel resonator is a one-port SAW resonator based on the LTOI substrate. Ladder-type structure filters are designed in the triplexer due to their better attenuation effect on both sides of the passband and good isolation between bands. The L5 and BT filters utilize π-type ladder topology; the L1 filter utilizes a T-type topology.
Circuit structure of the three individual filters.
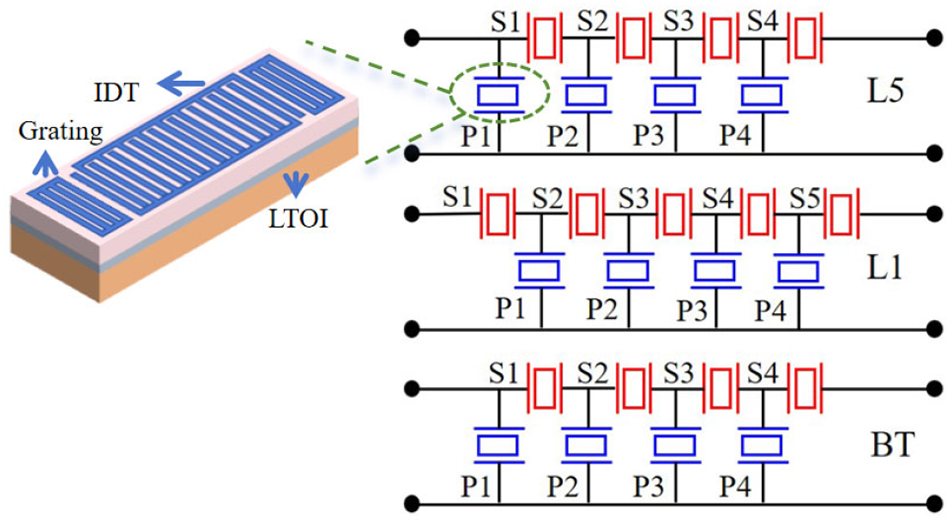
Figure 3 Long description
The diagram illustrates the circuit structures of three individual filters labeled L5, L1 and BT, each utilizing a ladder-type topology. At the top left, an inset shows a surface acoustic wave resonator based on an LTOI substrate with an interdigital transducer and grating. The L5 filter at the top features a series of four resonators labeled S1 to S4, connected in series with parallel resonators labeled P1 to P4. The L1 filter in the middle follows a similar pattern with series resonators S1 to S4 and parallel resonators P1 to P4. The BT filter at the bottom also includes series resonators S1 to S4 and parallel resonators P1 to P4. Each filter is connected by horizontal lines representing the circuit paths, with the series resonators depicted as red rectangles and the parallel resonators as blue rectangles.
The three filters shown in Fig. 3 were designed individually using the coupling-of-modes (COM) model [Reference Hashimoto27]. The physical dimensions of the SAW resonators interdigital transducers (IDTs) were determined by optimizing the pitch (P), aperture (W), and number of finger pairs (N). The detailed physical parameters are listed in the Appendix. Figure 4 shows the simulation results of the three filters. From Fig. 4, it can be observed that each filter demonstrates good performance with small IL and large RL, which means that each filter is well designed.
Simulation results of the individual filter corresponding to (a) L5, (b) L1, and (c) BT frequency band. (d)–(f) represent the S11 of the L5, L1, and BT filters in Smith chart, respectively.
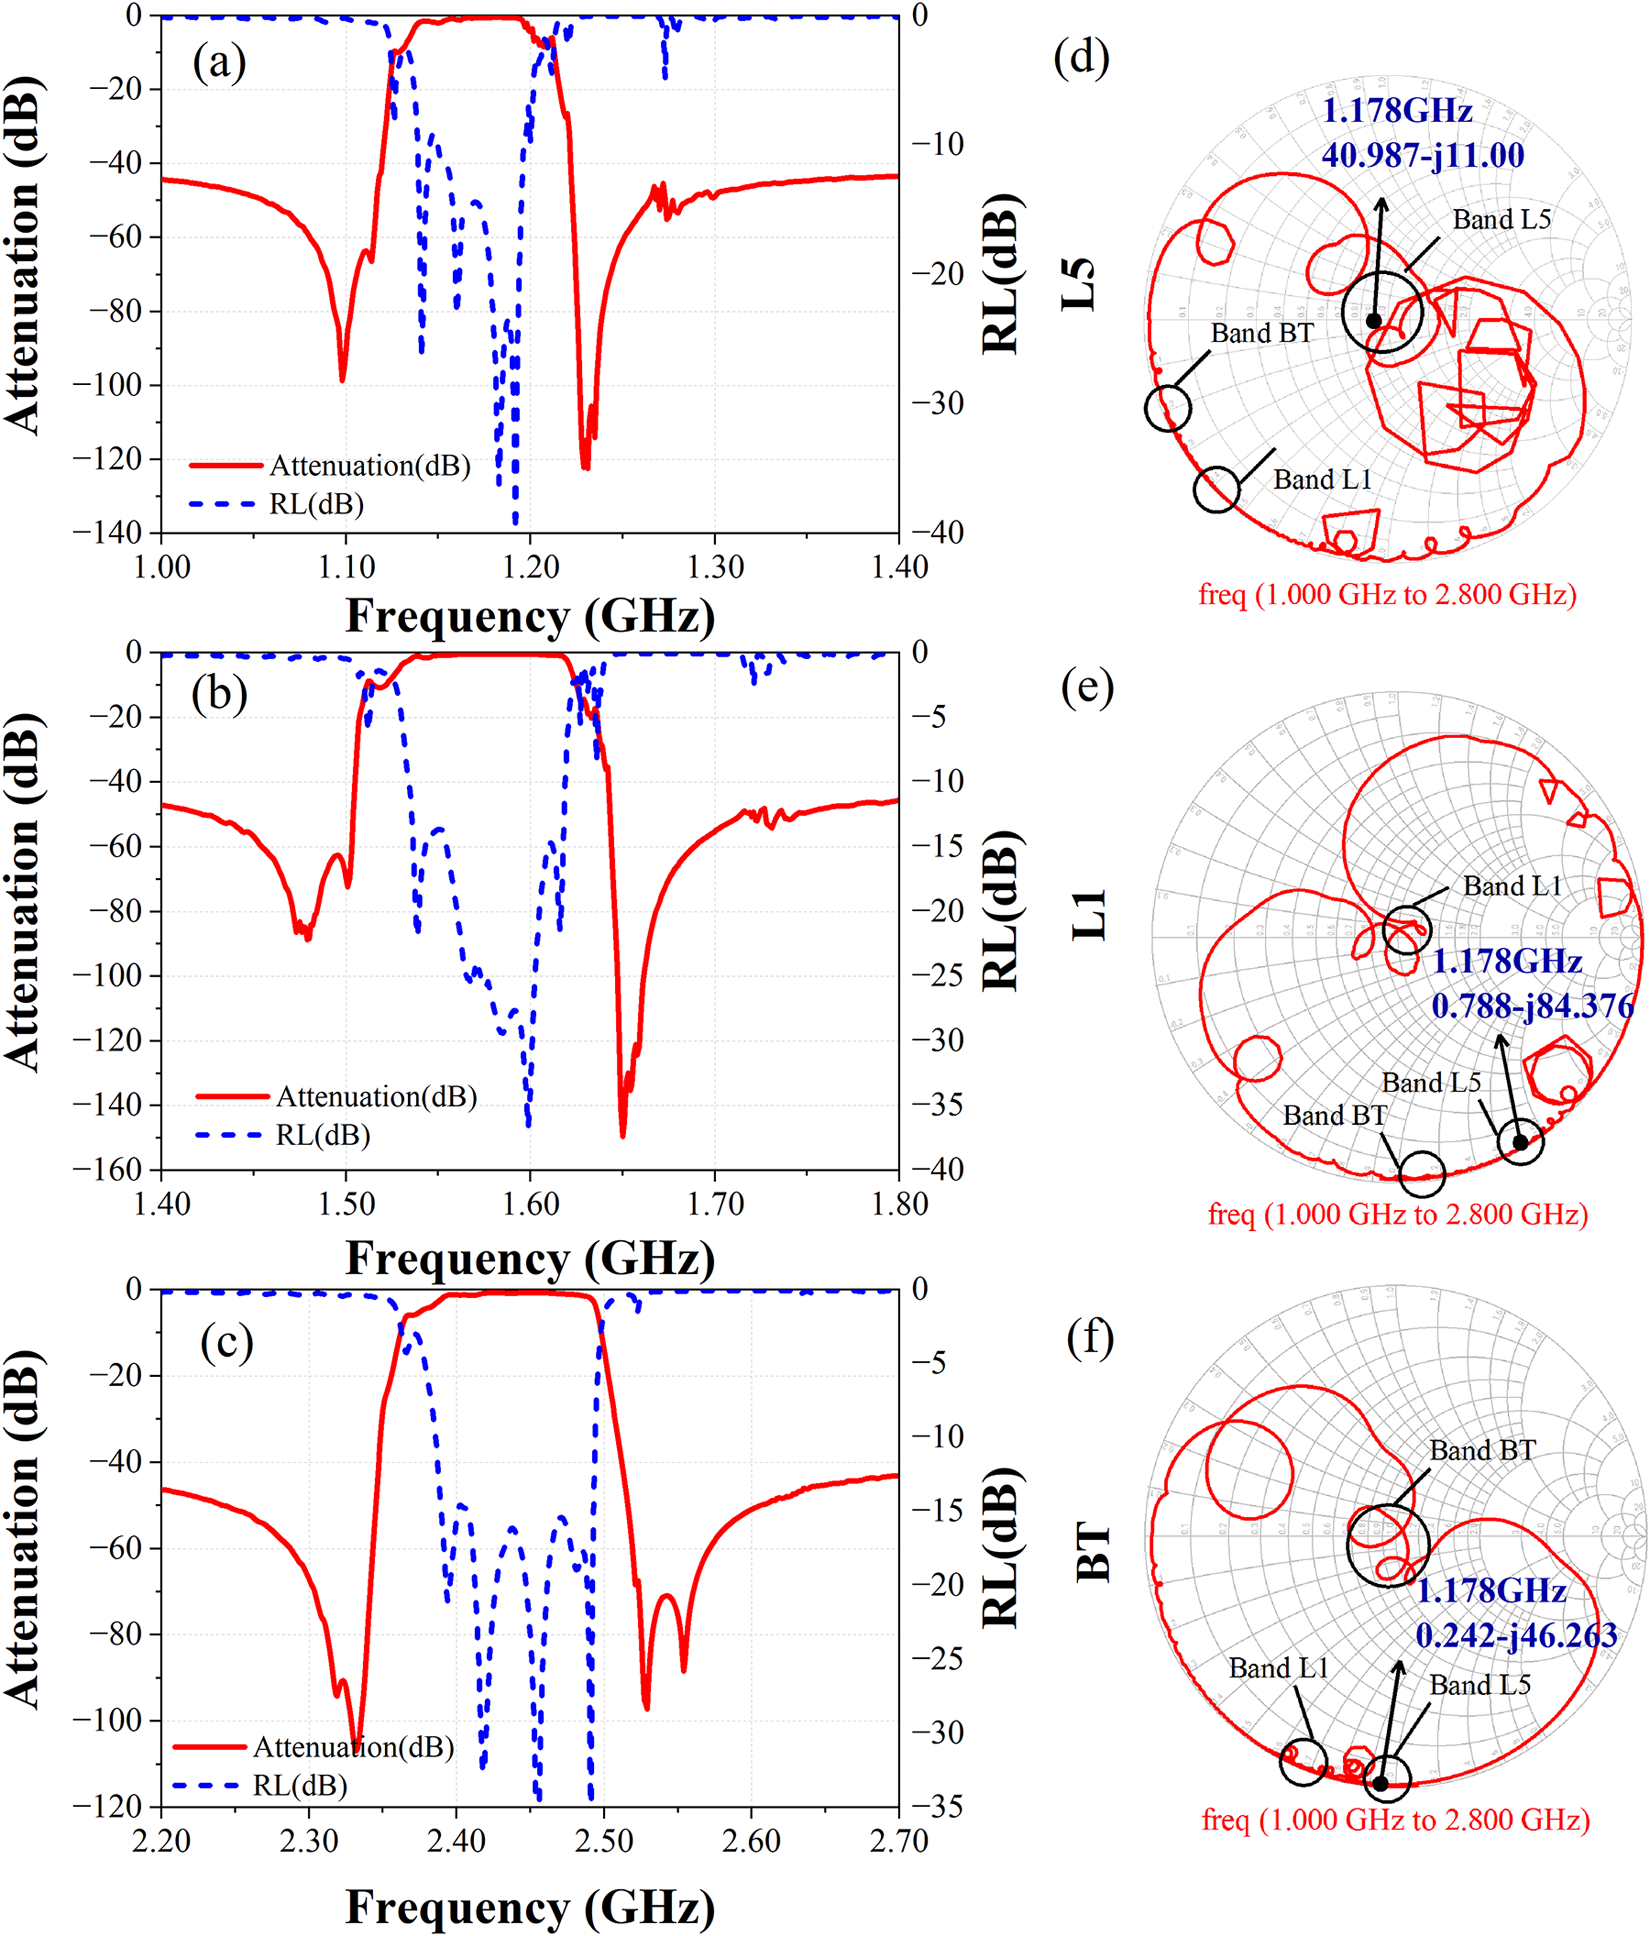
Figure 4 Long description
The image consists of six panels showing simulation results for individual filters corresponding to L5, L1 and BT frequency bands. Panels (a), (b) and (c) display line plots of attenuation and return loss in decibels versus frequency in gigahertz. The x-axis is labeled ′Frequency (GHz)′ and the y-axis is labeled ′Attenuation (dB)′ and ′RL (dB)′. In panel (a), the L5 band shows notches at approximately 1.18 GHz with attenuation reaching around -40 dB. Panel (b) for the L1 band shows notches at approximately 1.57 GHz with similar attenuation depths. Panel (c) for the BT band shows notches at approximately 2.45 GHz. Panels (d), (e) and (f) are Smith charts representing the S11 parameter for the L5, L1 and BT filters, respectively. The Smith charts indicate impedance behavior over the frequency range from 1.0 GHz to 2.8 GHz, with notable points marked at specific frequencies such as 1.178 GHz and 2.242 GHz. The plots demonstrate good filter performance with small insertion loss and large return loss, indicating well-designed filters.
Design of GPS L1/L5 and BT triplexer
To implement the design of the dual-frequency GPS L1/L5 and BT triplexer, we applied the numerical de-embedding synthesis method proposed in the “Analytical synthesis of matching networks” section. In this design case, given that the L5 channel is located at the lowest frequency band of the triplexer, the L1 and BT channels exhibit purely capacitive characteristics with negligible conductance in the L5 frequency range. Consequently, the L5 channel was selected as the reference channel k. Figure 4(d)–(f) presents the impedance values of each filter at the L5 center frequency (1.178 GHz). According to Eq. (1), the calculated cumulative loading admittance  ${Y_{load}}$ is j0.0335 S. Assuming that the system impedance is 50 Ω at the common port of the triplexer, we performed de-embedding on channel k to compensate for the parasitic loading effects from L1 and BT. Based on Eq. (2), the target admittance
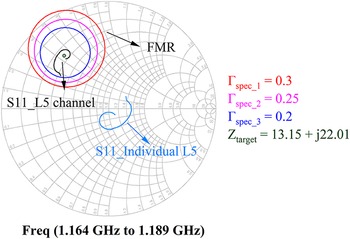
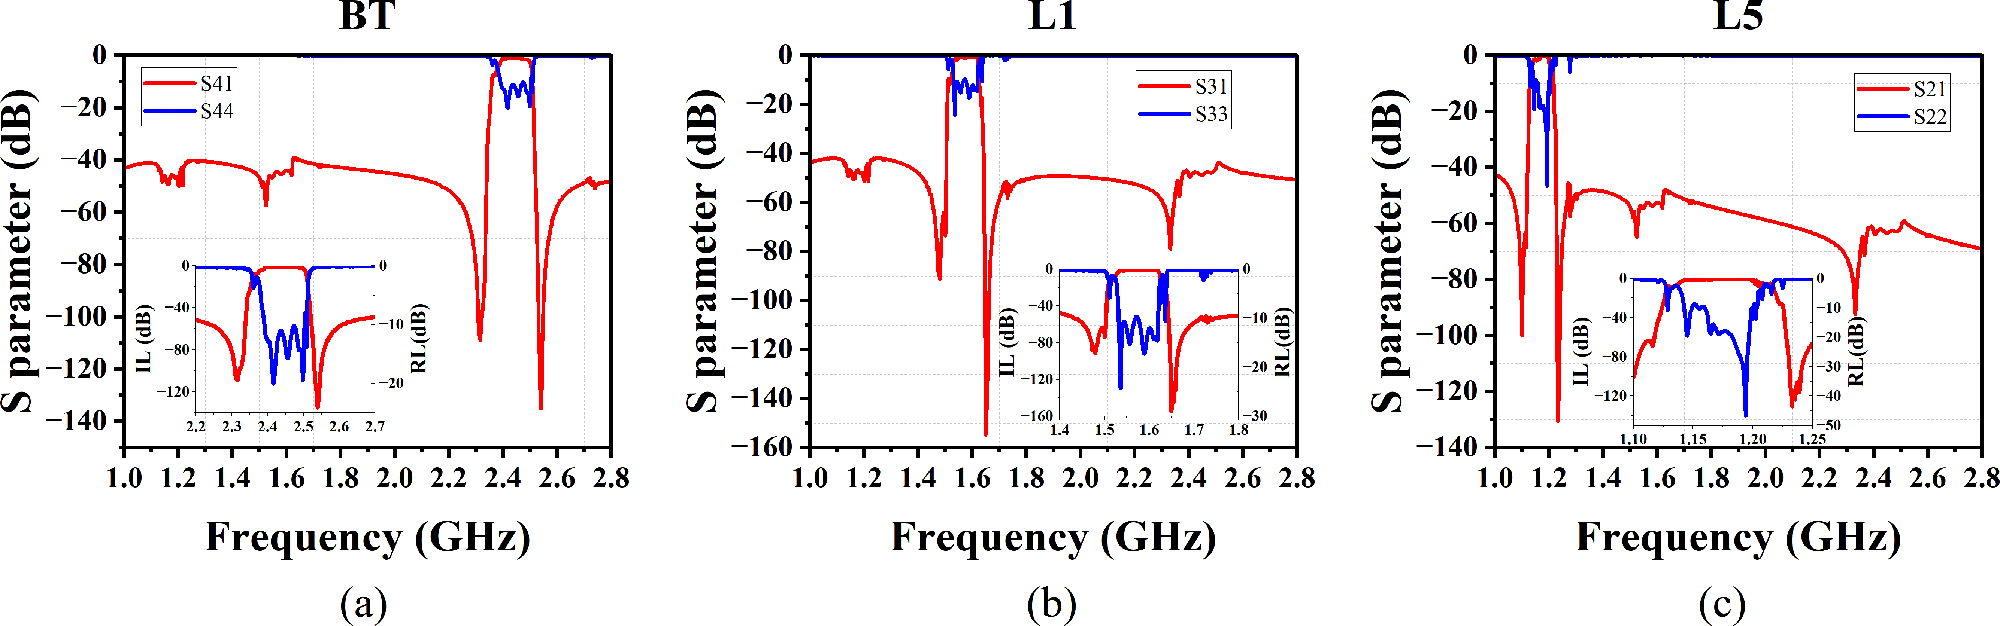
 ${Y_{target}}$ for channel k was derived as 0.02 − j0.0335 S, which corresponds to a target impedance of 13.15 + j22.01 Ω. This impedance point is defined as the ideal matching point (reflection coefficient Γ = 0) at the center frequency. Subsequently, the strict single-point target was relaxed to a solution space that satisfies the bandwidth requirements. Following this, constant reflection circles and the FMR were plotted on the Smith chart. As shown in Fig. 5, the constant reflection coefficient circles corresponding to Γ = 0.2, 0.25, and 0.3 are distributed in the inductive low-impedance region of the Smith chart. Therefore, we cascaded a matching network between the common antenna port and the L5 filter to transform the passband impedance of the L5 channel into the FMR This network consists of a series inductor and a parallel capacitor. Through this special topology configuration, the impedance trajectory of L5 was successfully rotated into the target region, thereby achieving the final matching and design of the triplexer. Figure 6 presents the simulation results of the synthesized triplexer, which exhibits excellent performance in terms of IL, RL, and out-of-band (OoB) rejection.
Smith chart with the constant reflection coefficient circles and FMR.
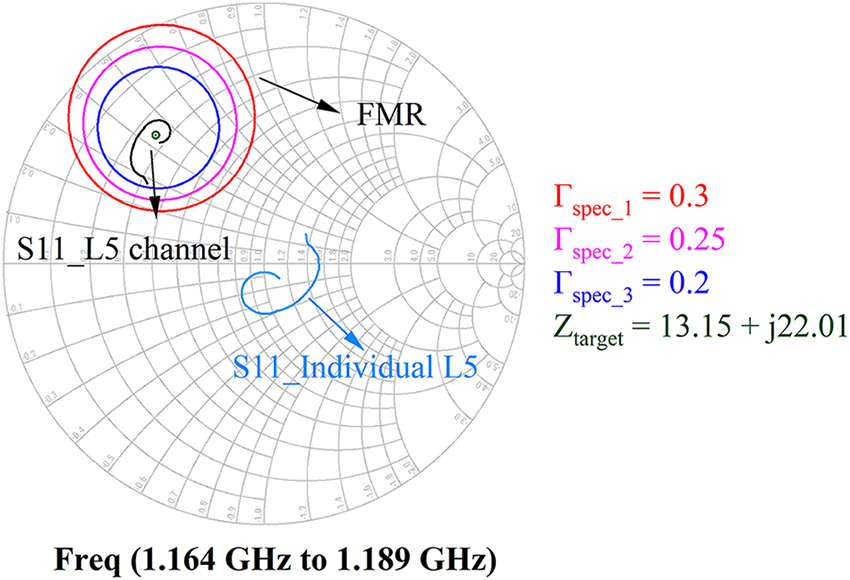
Figure 5 Long description
The Smith chart displays the S11 input reflection coefficient for the L5 channel over a frequency range of 1.164 gigahertz to 1.189 gigahertz. The horizontal axis represents the normalized resistance component and the vertical axis represents the normalized reactance component of the impedance plane. Two impedance traces are visible. One is labeled S11 underscore L5 channel and the other is labeled S11 individual L5. Both traces are plotted across the stated frequency range. The chart includes three constant reflection coefficient circles labeled gamma subscript spec underscore 1 equals 0.3, gamma subscript spec underscore 2 equals 0.25 and gamma subscript spec underscore 3 equals 0.2. These circles are centered near the chart origin and represent progressively tighter matching thresholds. A target impedance point is marked and labeled Z subscript target equals 13.15 plus j22.01 ohms, located in the inductive low-impedance region of the chart. A shaded region labeled FMR is also present, positioned in the upper inductive portion of the chart near the low-resistance side. The S11 individual L5 trace follows a curved arc that passes through the inductive low-impedance region. The S11 underscore L5 channel trace shows a broader swept path across the same region. The target point at 13.15 plus j22.01 ohms falls within or near the innermost reflection coefficient circle of 0.2. The frequency label at the bottom reads Freq open parenthesis 1.164 gigahertz to 1.189 gigahertz close parenthesis.
Simulation results of the synthesized triplexer. (a), (b) and (c) represent the performance of BT, L1, and L5, respectively.
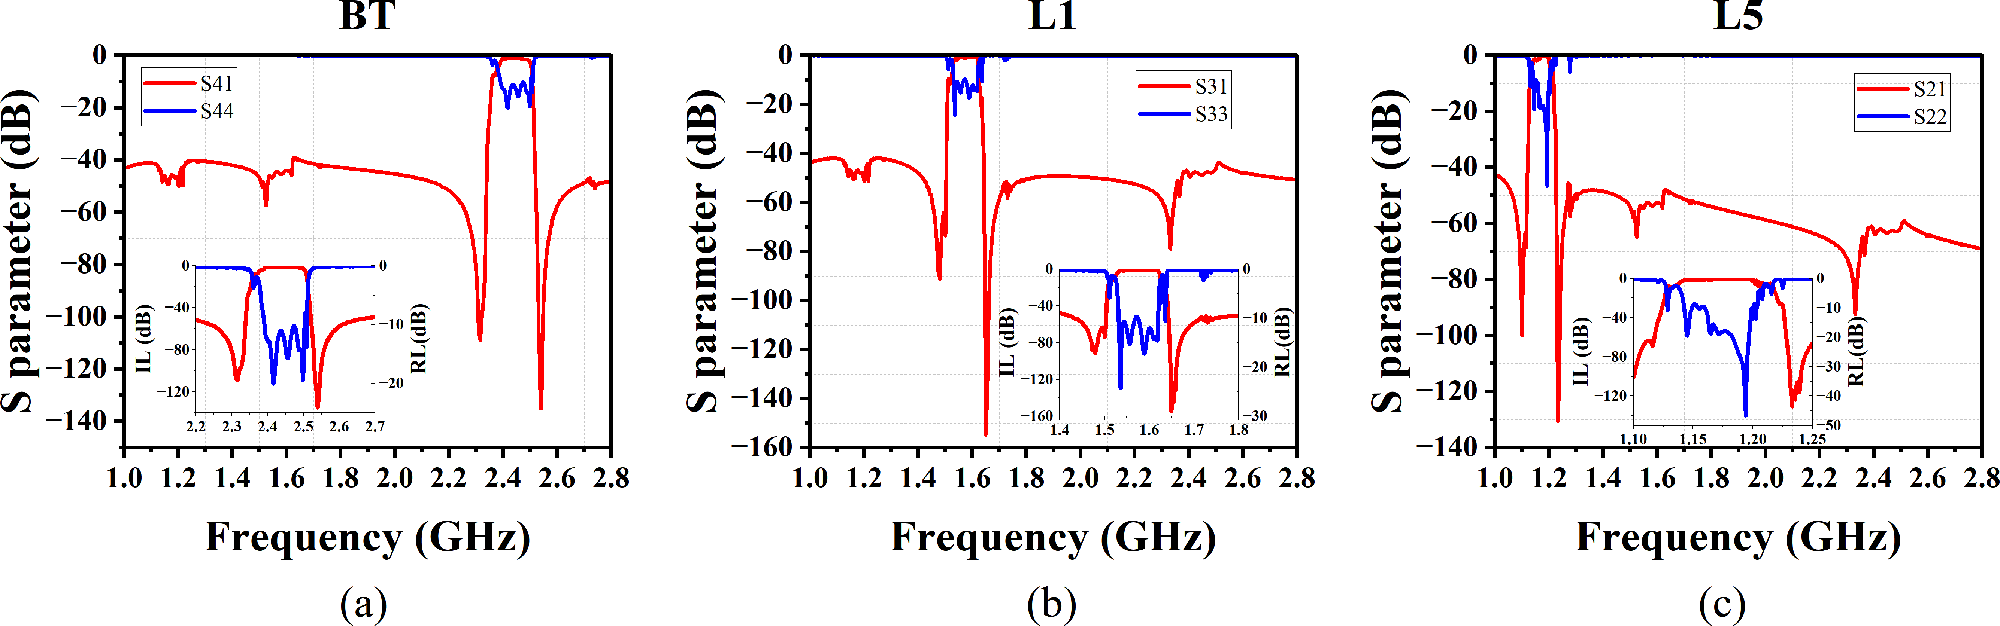
Figure 6 Long description
The image A showing a line graph titled BT. The x-axis is labeled Frequency (GHz), ranging from 1.0 to 2.8. The y-axis is labeled S-parameter (dB), ranging from 0 to minus 140. A legend shows S41 (red) and S44 (blue). The red curve stays near minus 40 to minus 60 over most of the range, with a deep notch near about 2.6 GHz reaching close to minus 140. The blue curve is near 0 around about 2.4 to 2.5 GHz and is much lower outside that region, with multiple dips between about 1.3 and 1.7 GHz reaching below minus 100. An inset plot shows the same two traces over a narrower frequency span around about 1.4 to 1.8 GHz, with the inset y-axis labeled IL (dB) and RL (dB). The image B showing a line graph titled L1. The x-axis is labeled Frequency (GHz), ranging from 1.0 to 2.8. The y-axis is labeled S-parameter (dB), ranging from 0 to minus 160. A legend shows S31 (red) and S33 (blue). The red curve is around minus 40 to minus 60 across much of the band, with a deep notch near about 1.45 GHz reaching near minus 100 and another deep notch near about 2.5 GHz reaching near minus 140. The blue curve is near 0 around about 1.55 to 1.65 GHz and is far lower outside that region, with dips below minus 120 in several places. An inset plot shows the same two traces over a narrower span around about 1.4 to 1.8 GHz, with the inset y-axis labeled IL (dB) and RL (dB). The image C showing a line graph titled L5. The x-axis is labeled Frequency (GHz), ranging from 1.0 to 2.8. The y-axis is labeled S-parameter (dB), ranging from 0 to minus 140. A legend shows S21 (red) and S22 (blue). The red curve is around minus 40 to minus 70 over most frequencies, with a deep notch near about 1.2 GHz reaching close to minus 140. The blue curve is near 0 around about 1.15 to 1.25 GHz and is much lower outside that region, with values dropping below minus 100 across large parts of the remaining band. An inset plot shows the same two traces over a narrower span around about 1.4 to 1.8 GHz, with the inset y-axis labeled IL (dB) and RL (dB).
Isolation improvement of the triplexer
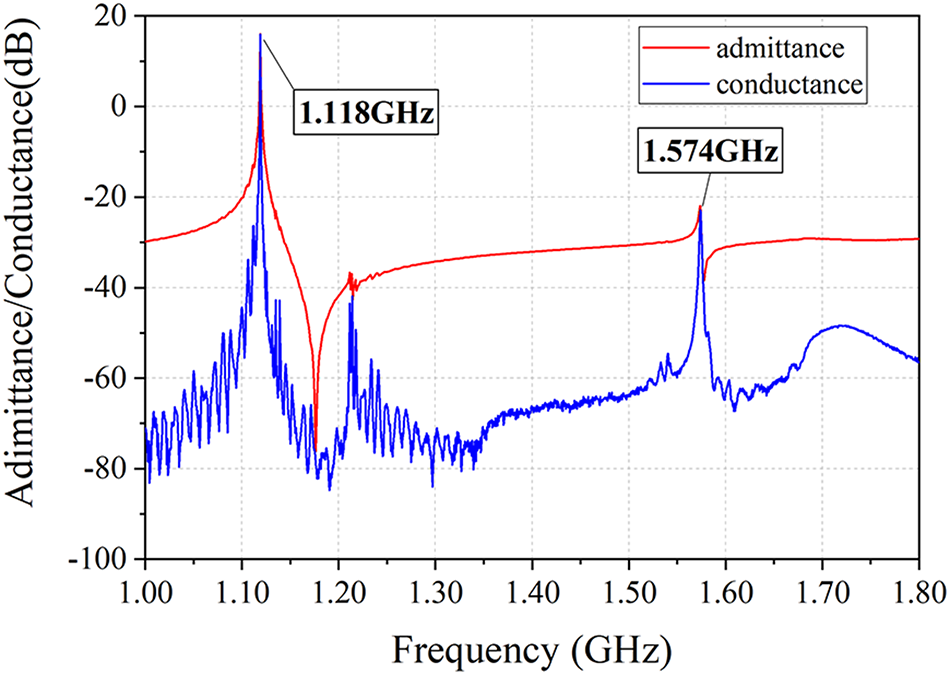
In this work, the three filters are designed based on silicon-based LTOI resonators, which exhibit undesired high-frequency spurious modes at ≈1.4 times the main resonant frequency [Reference Inoue and Solal28]. The spurious modes arise from the reflection of energy at the silicon substrate. However, this specific spurious mode cannot be simulated by the COM model. Figure 7 shows the admittance response of the typical SAW resonator used in this work. It can be clearly seen that the series resonance frequency of the main resonance mode is about 1.118 GHz, while the series resonance frequency of the high-frequency spurious mode is about 1.574 GHz. This spurious mode forms a small passband, which often affects the out-of-band rejection on the right side of the filter’s passband and results in signal leakage.
Measured admittance and conductance of the SAW resonator.
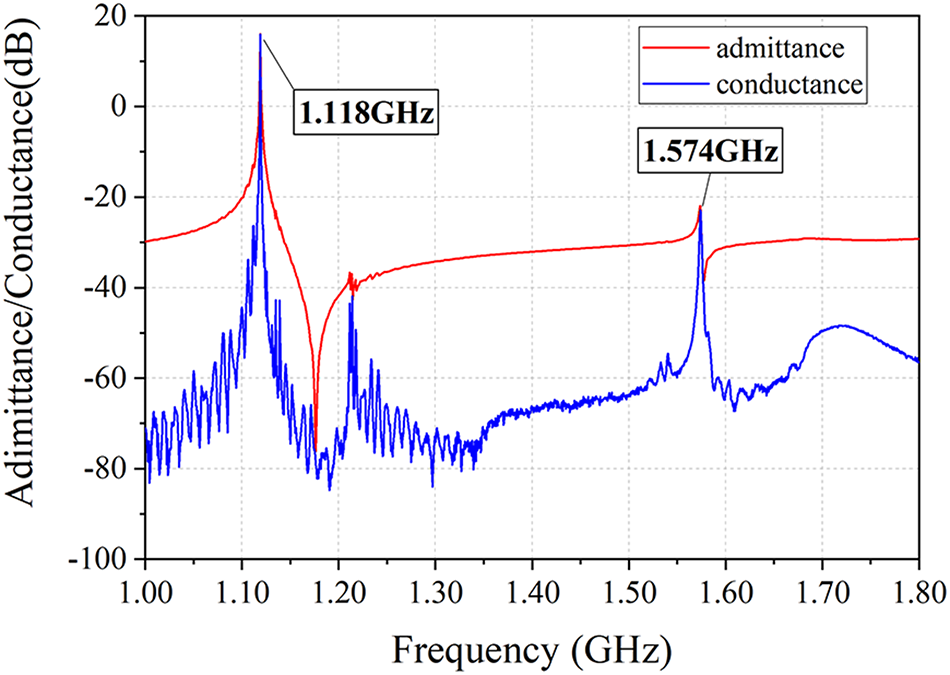
In this work, the high-frequency spurious mode of the L5 filter in the triplexer just occurs in the passband of the L1 band. Then, unwanted signal leakage occurs from the L5 filter. At the same time, this also leads to a reduction in isolation between the L5 and L1 bands. Thus, the isolation between the L5 and L1 bands must be improved.
To improve the isolation between adjacent frequency bands caused by high-frequency spurious modes in silicon-based LTOI resonators, as shown in Fig. 8(a), a 0.9-nH inductor is proposed to be added in series with the last grounding elements of the L5 ladder-type filter, thereby introducing a notch in the L1 frequency range. Figure 8(b)–(d) illustrates the responses of the triplexer with a notch. It can be seen from Fig. 8(b) that the attenuation in the L5 band is not affected by the introduction of the inductors. The isolation between the L5 and L1 filters is significantly improved, as shown in Fig. 8(d). Unfortunately, the isolation between the BT and L5 filters degrades as shown in Fig. 8(c). Due to the large margin of isolation between BT/L5 and BT/L1, this degradation is acceptable to a certain extent.
The influence of notch design on triplexer performance. (a) Configuration diagram of the L5 with notch design. (b) The attenuation of the L5 band. (c) The isolation between the L5 and BT bands. (d) The isolation between the L5 and L1 bands.
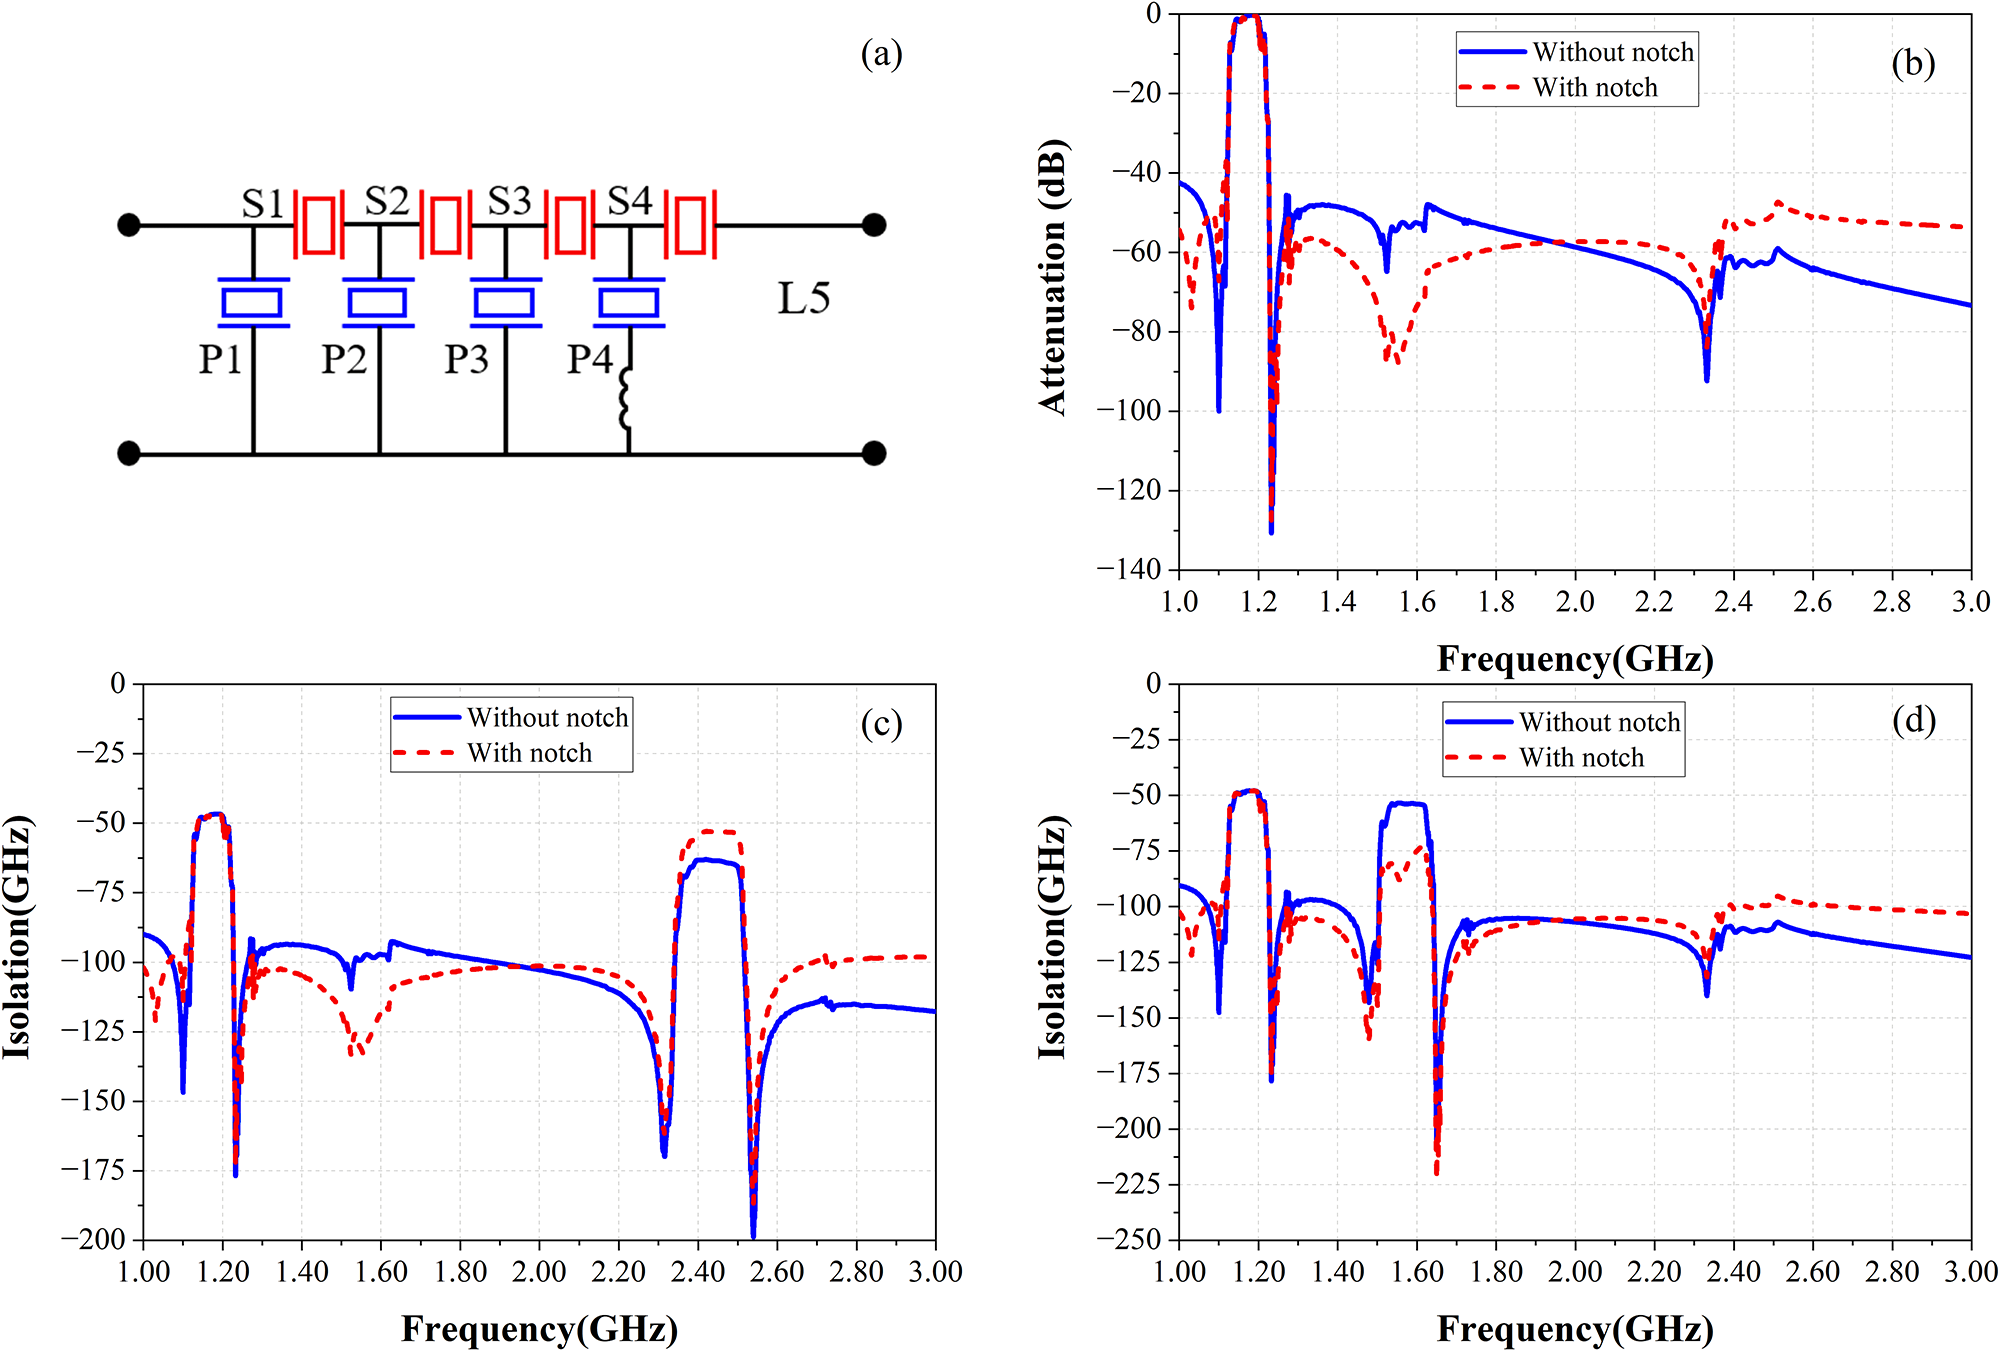
Figure 8 Long description
A) A circuit diagram labeled L5 shows a filter network with four repeated branches. Each branch has a series element labeled S1 to S4 and a shunt element labeled P1 to P4. B) A line graph with y-axis labeled Attenuation (decibel) and x-axis labeled Frequency (gigahertz) from 1.0 to 3.0. The y-axis ranges from 0 to minus 140. Two curves, Without notch and With notch, show attenuation differences. The With notch curve shows a dip around 1.5 gigahertz. C) A line graph with y-axis labeled Isolation (decibel) and x-axis labeled Frequency (gigahertz) from 1.0 to 3.0. The y-axis ranges from 0 to minus 200. Two curves, Without notch and With notch, show isolation differences. The With notch curve shows improved isolation around 1.8 gigahertz. D) A line graph with y-axis labeled Isolation (decibel) and x-axis labeled Frequency (gigahertz) from 1.0 to 3.0. The y-axis ranges from 0 to minus 250. Two curves, Without notch and With notch, show isolation differences. The With notch curve shows a significant dip around 2.2 gigahertz. The graphs illustrate how the notch design affects attenuation and isolation across different frequency bands.
Electromagnetic co-simulation and implementation
In order to ensure better performance, the layout and substrate design of the triplexer were verified through circuit and electromagnetic joint simulations. Figure 9(a) shows the final layout of the triplexer after grounding and routing optimization, with a final size of 1500 μm × 1400 μm. Figure 9(b) shows a 3D view of the triplexer substrate and packaging. The designed organic substrate has a size of 2.5 mm × 2.0 mm, with a dielectric constant of 4.1. A planar spiral inductor is embedded in the substrate to enhance the isolation between the L5 and L1 bands. An impedance matching pad is introduced on the front side of the substrate between the L5 filter and the antenna port.
(a) The layout of the designed triplexer. (b) 3D schematic of the package implementation.
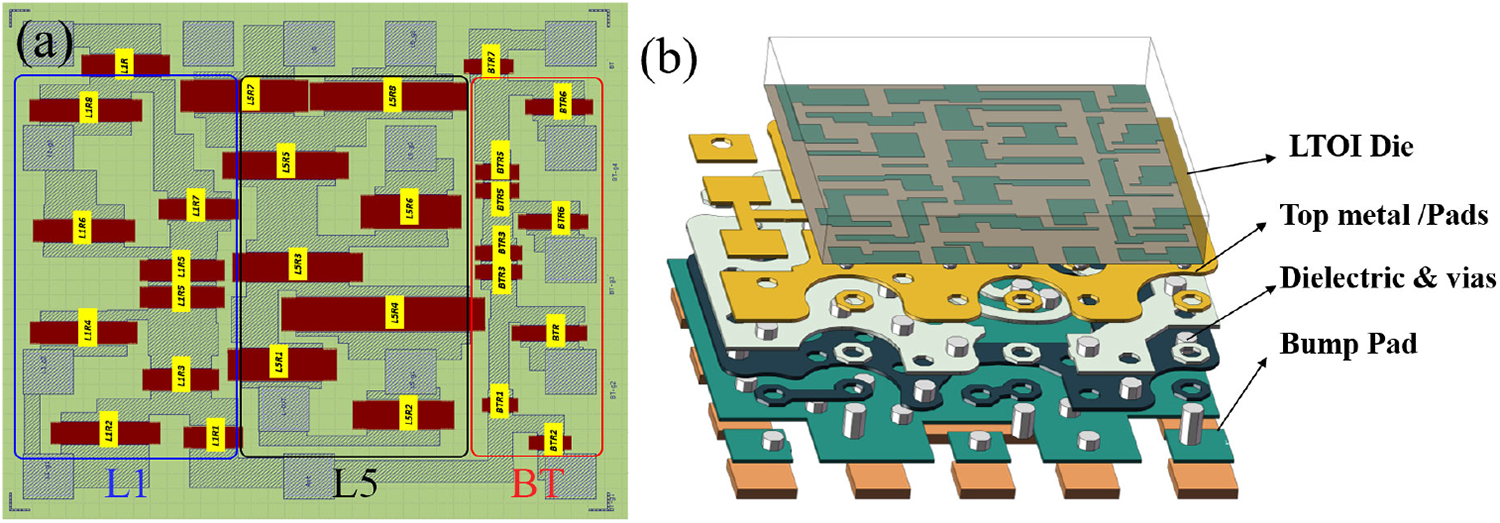
Figure 9 Long description
Insufficient visual information to describe this element accurately.
Device fabrication
The designed triplexer was fabricated and is shown in Fig. 10(b). The filters for the three frequency bands are monolithically integrated on the silicon-based Y-cut 42° LTOI substrate in a monolithic configuration. The device is packaged using Chip Scale Package technology, with a post-packaging size of 2.5 mm × 2.0 mm × 0.6 mm.
(a) Photograph of the fabricated triplexer mounted on the test board. (b) Photograph of the packaged triplexer.
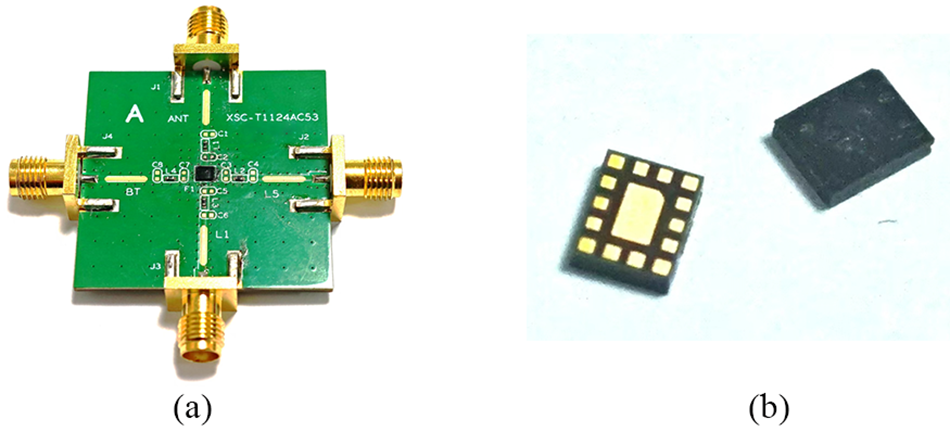
Figure 10(a) shows the photograph of the packaged triplexer mounted on the test board for measurement. The antenna port and the three filter ports are connected to SMA connectors through surface-mount coplanar lines. And the electrical performance of the triplexer was measured using a vector network analyzer (Keysight E5071).
Electrical response of the fabricated triplexer
Figure 11 compares the measured performance of the fabricated triplexer with the simulation results. A good agreement is observed between the measurement and the simulation. However, differences are observed near the transmission zeros (TZs) on both sides of the L1 passband, as shown in Fig. 11(b). This could be due to imperfect grounding in the physical circuit, which results in signal leakage. Additionally, the measured triplexer exhibits high-frequency spurious modes on the upper side of each passband, which were not predicted by the COM model used in the design.
Experimental results and joint simulation results of the triplexer. (a) Response of the BT band. (b) Response of the L1 band. (c) Response of the L5 band. (d) Isolation between the L1 and L5 bands. (e) Isolation between the L5 and BT bands. (f) Isolation between the L1 and BT bands. (g)–(i) present the RL of the fabricated triplexer, respectively.
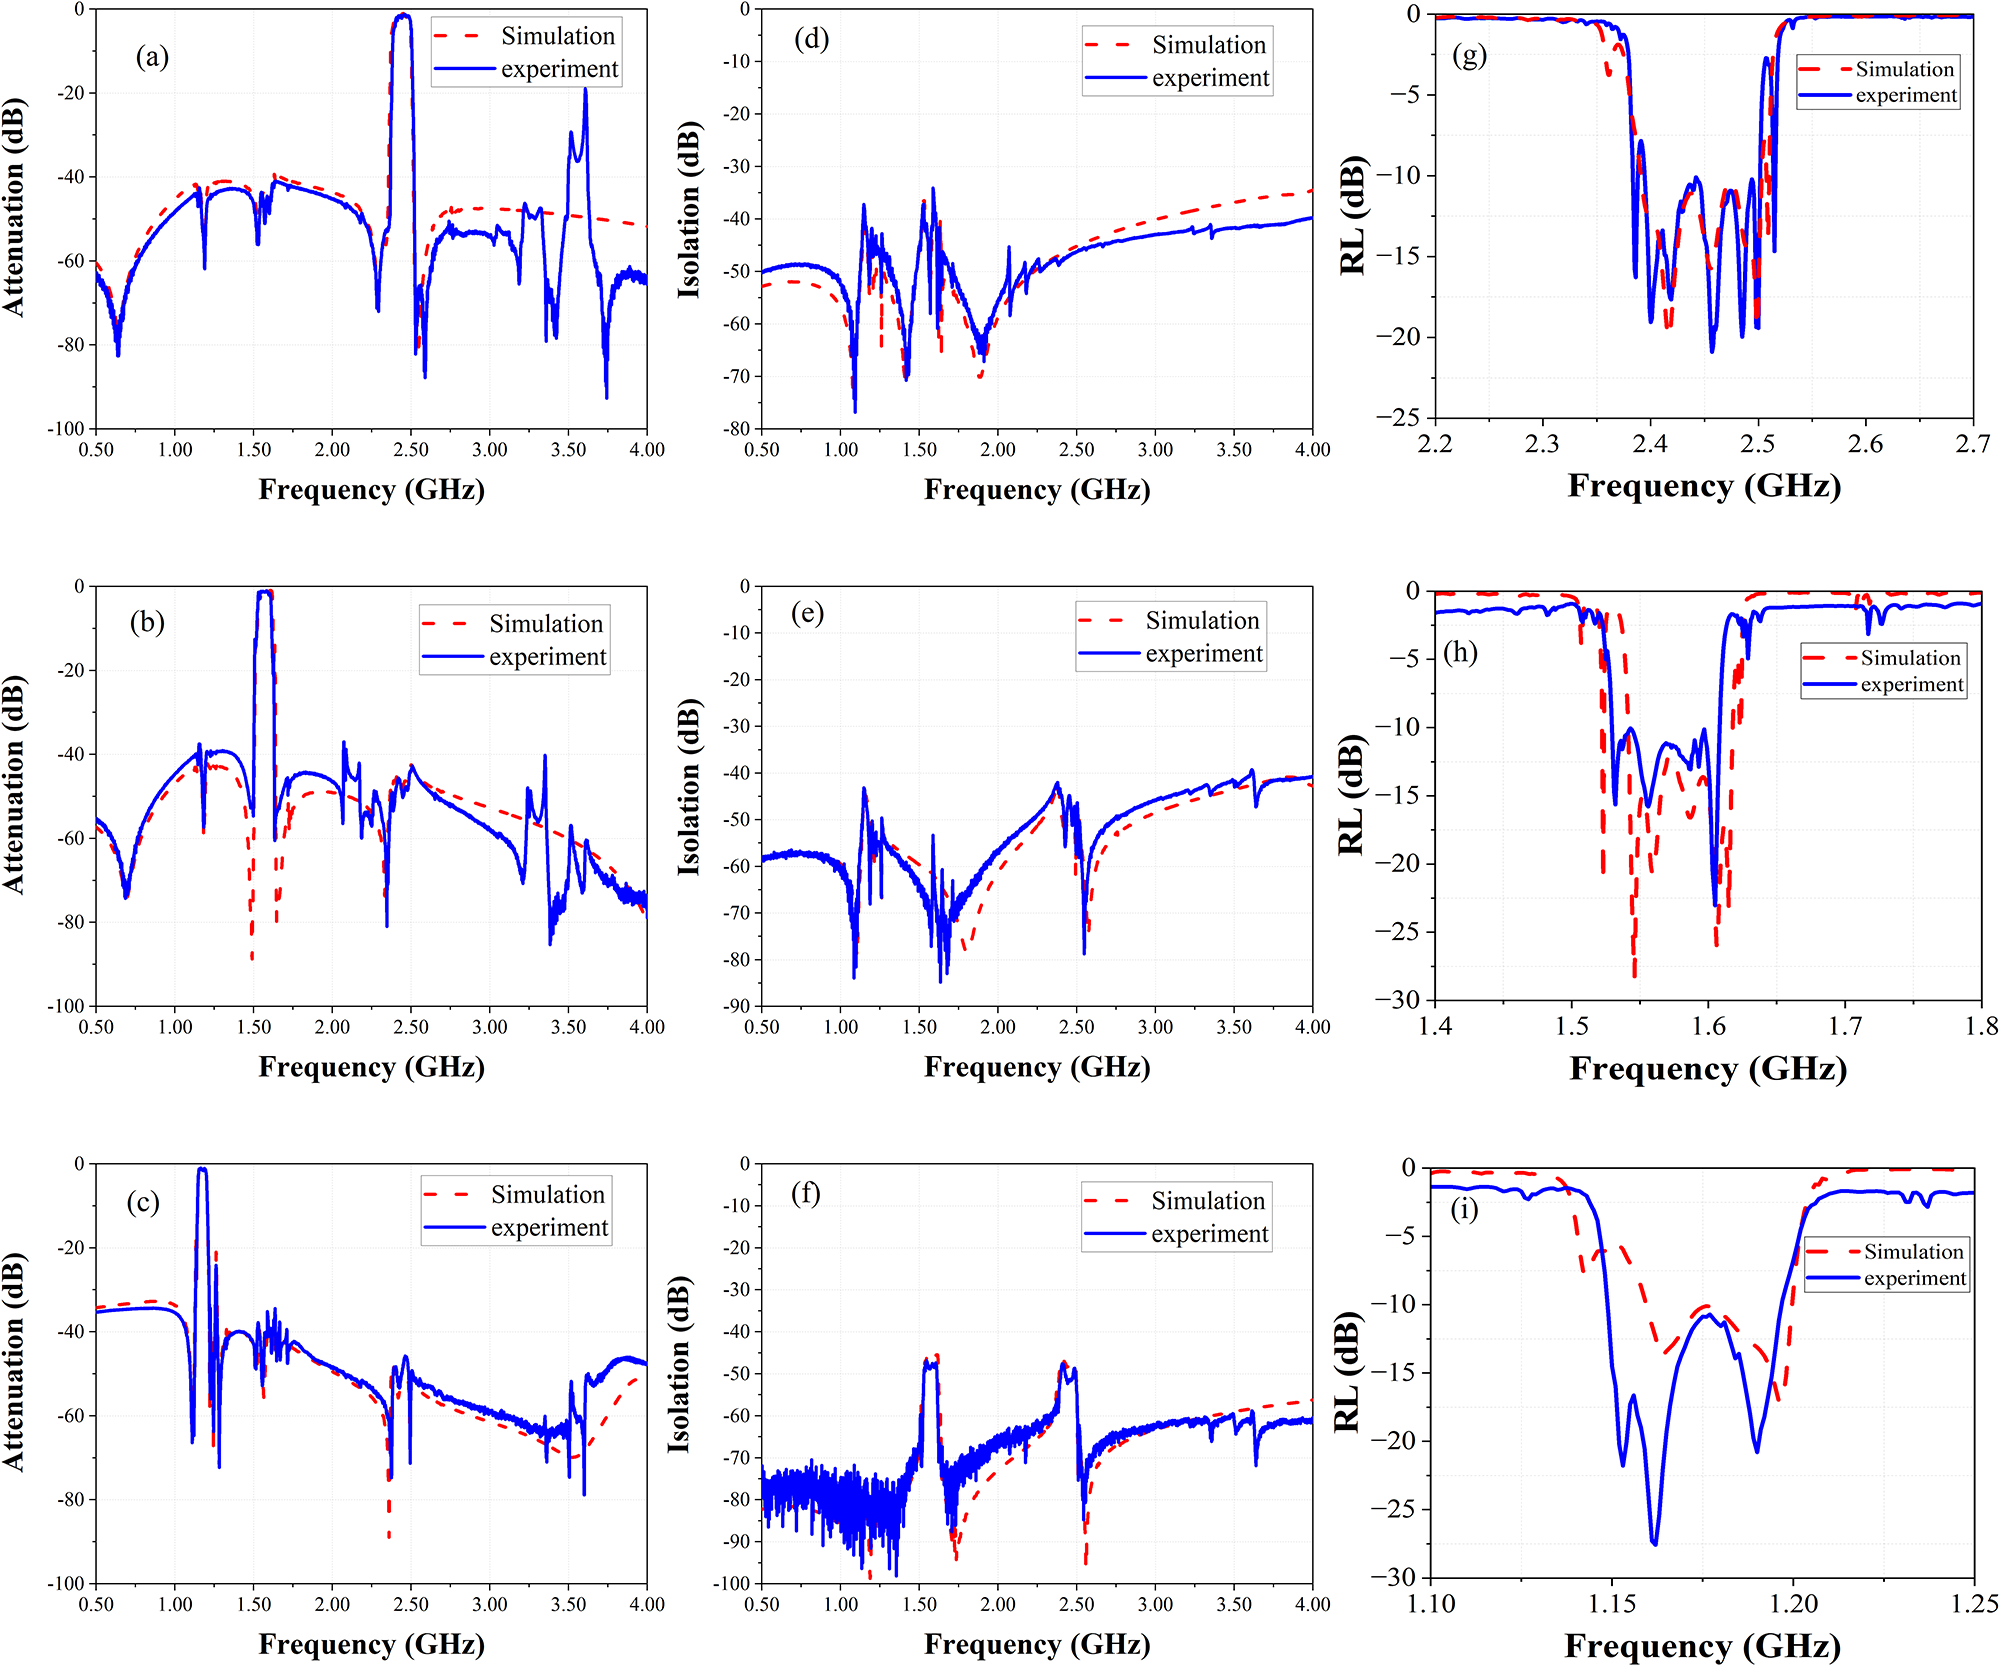
Figure 11 Long description
The composite figure contains nine line plots arranged in a three by three grid. Each plot overlays two curves: a dashed line representing simulation and a solid line representing experimental measurement. The x-axis of all nine plots is labeled Frequency in gigahertz. The y-axis labels and ranges differ by group as described below. Plots a, b and c occupy the left column and show attenuation in decibels on the y-axis, ranging from approximately minus 30 decibels to 0 decibels. Plot a covers the frequency range from approximately 0.50 gigahertz to 4.00 gigahertz and shows the BT band response, with a passband centered near 2.45 gigahertz and attenuation minima reaching approximately minus 2 to minus 3 decibels within the passband. Plot b covers the same frequency range and shows the L1 band response, with a passband centered near 1.575 gigahertz. Noticeable sharp notches appear on both sides of the passband, reaching below minus 25 decibels, where the simulation and measurement curves show visible differences. Plot c covers the same frequency range and shows the L5 band response, with a passband centered near 1.176 gigahertz and attenuation minima near minus 2 to minus 3 decibels within the passband. Plots d, e and f occupy the middle column and show isolation in decibels on the y-axis, ranging from approximately minus 50 decibels to 0 decibels. Plot d covers approximately 0.50 gigahertz to 4.00 gigahertz and shows isolation between the L1 and L5 bands, with deep isolation troughs reaching below minus 40 decibels near 1.2 gigahertz and 1.6 gigahertz. Plot e covers the same range and shows isolation between the L5 and BT bands, with troughs below minus 40 decibels near 1.2 gigahertz and 2.45 gigahertz. Plot f covers the same range and shows isolation between the L1 and BT bands, with isolation levels reaching below minus 40 decibels near 1.575 gigahertz and 2.45 gigahertz. In all three isolation plots, the simulation and measurement curves follow each other closely across most of the frequency range. Plots g, h and i occupy the right column and show return loss in decibels on the y-axis. Plot g covers approximately 2.2 gigahertz to 2.7 gigahertz, corresponding to the BT band, with the y-axis ranging from approximately minus 30 decibels to 0 decibels. The return loss minimum occurs near 2.45 gigahertz, reaching approximately minus 20 to minus 25 decibels. Plot h covers approximately 1.4 gigahertz to 1.8 gigahertz, corresponding to the L1 band, with the y-axis ranging from approximately minus 35 decibels to 0 decibels. The return loss minimum occurs near 1.575 gigahertz, reaching approximately minus 25 to minus 30 decibels. Plot i covers approximately 1.10 gigahertz to 1.25 gigahertz, corresponding to the L5 band, with the y-axis ranging from approximately minus 30 decibels to 0 decibels. The return loss minimum occurs near 1.176 gigahertz, reaching approximately minus 20 to minus 25 decibels. In all three return loss plots, the simulation and measurement curves show close agreement, with minor deviations visible near the minima.
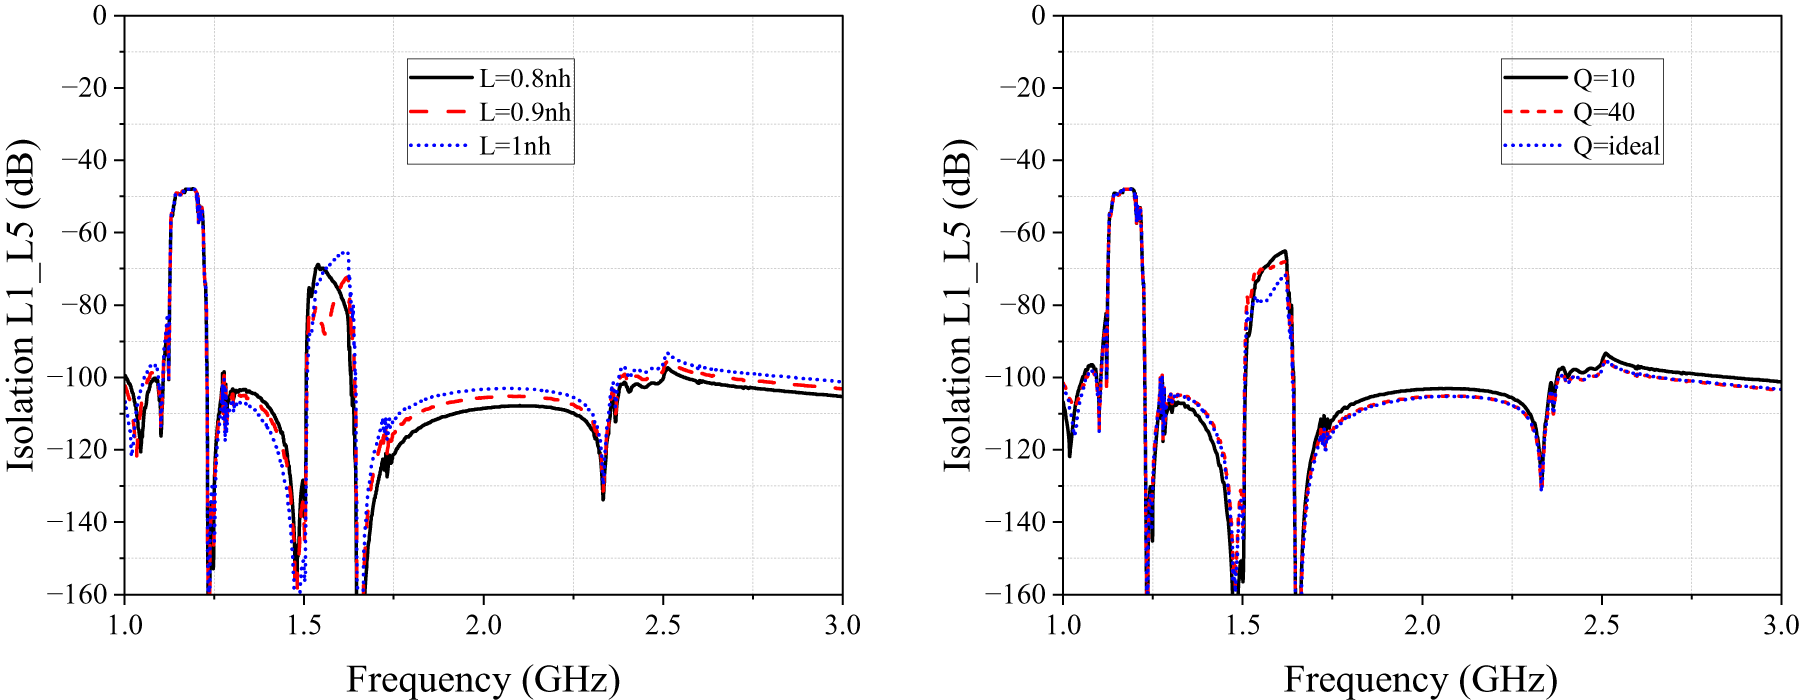
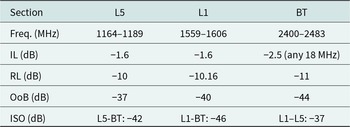
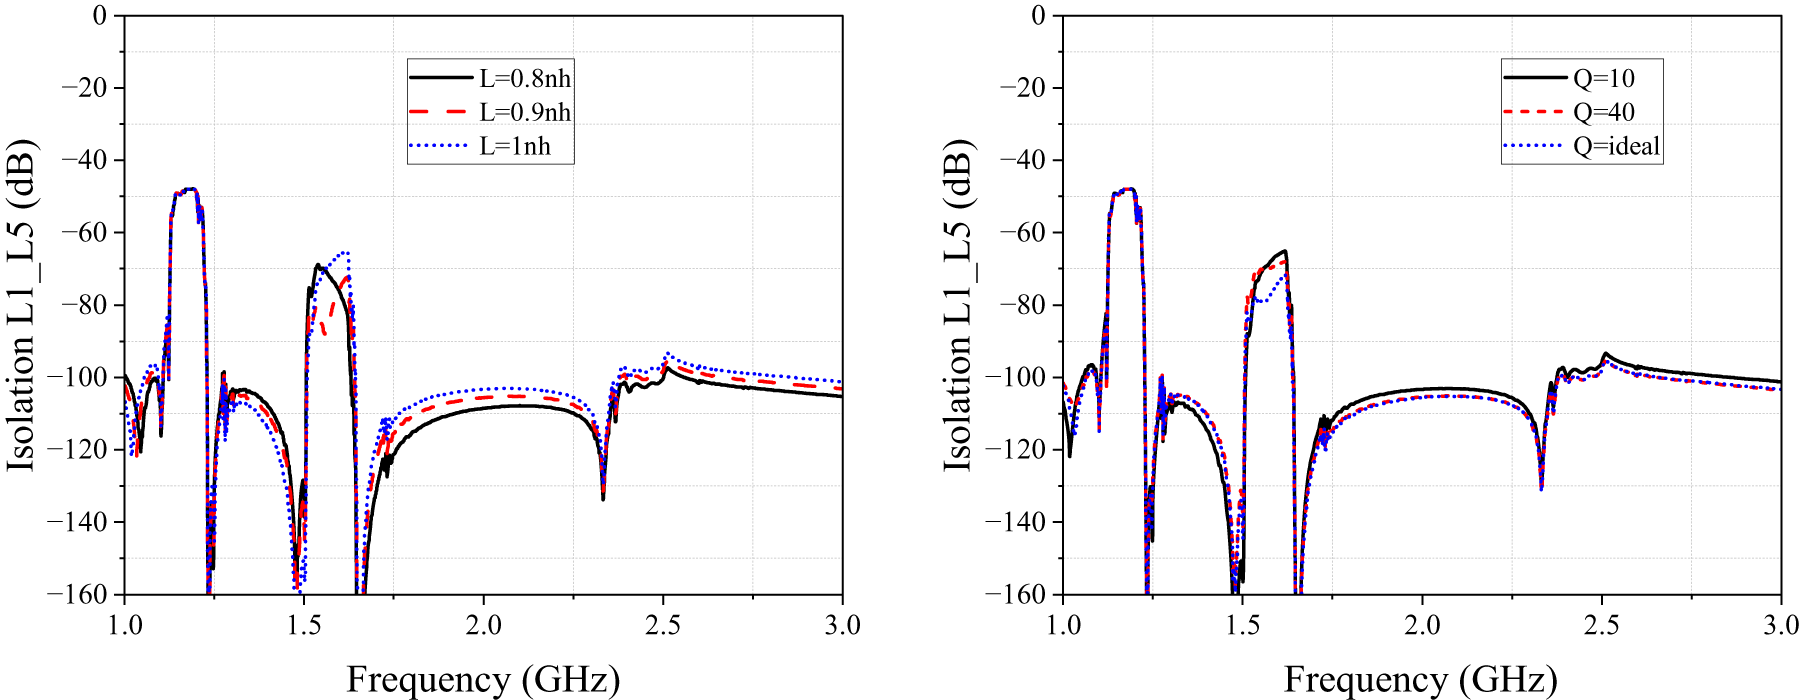
The tested triplexer exhibits the expected performance, with IL less than 1.6 dB in the L1 and L5 bands. The maximum IL in the BT band is 3.5 dB, and the average loss within any 18 MHz range of the passband is below 2.5 dB. The RL for all three channels is better than −10 dB. The isolation between the L5 and L1 bands is further improved by embedding a trap inductor within the substrate. However, the isolation does not fully reach the −40 dB target in specific narrow regions of the L1 band. This limitation is likely attributed to the limited Q-factor of the fabricated inductor or a frequency shift of the TZ. As shown in Fig. 12, the inductance Q-factor and inductance value cause a decrease in isolation between L1 and L5. Nevertheless, device performance can be further optimized by enhancing the inductance Q-factor or iteratively adjusting circuit structure parameters.
The impact of simulated inductance Q-factor and inductance value on the isolation between the L1 and L5 bands.
The detailed measured performance metrics are summarized in Table 2. Table 3 gives a performance comparison of our fabricated triplexer with some reported multiplexers, which shows that the fabricated monolithic integrated triplexer has a compact size, low IL, and high isolation.
Summary of the measurement results
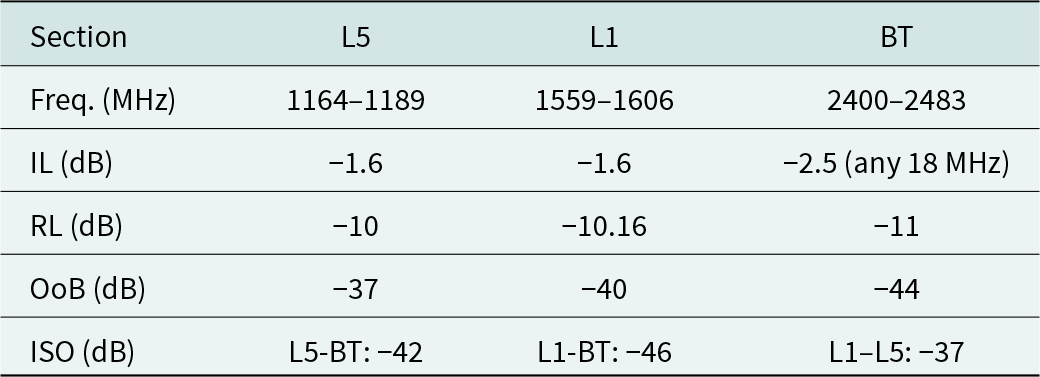
Table 2 Long description
The table reports measured frequency ranges and RF performance metrics for three sections: L5, L1, and Bluetooth. L5 covers 1164 to 1189 MHz and L1 covers 1559 to 1606 MHz, while Bluetooth spans 2400 to 2483 MHz. Insertion loss is 1.6 dB for both L5 and L1, and 2.5 dB for Bluetooth, noted as applying to any 18 MHz portion. Return loss is about 10 dB for L5, about 10.16 dB for L1, and 11 dB for Bluetooth, making Bluetooth slightly better on this metric. Out-of-band attenuation is 37 dB for L5, 40 dB for L1, and 44 dB for Bluetooth, so Bluetooth provides the strongest rejection and L5 the weakest. Isolation values are 42 dB between L5 and Bluetooth, 46 dB between L1 and Bluetooth, and 37 dB between L1 and L5, indicating the best isolation is between L1 and Bluetooth and the lowest is between L1 and L5. Comparisons should consider that the three sections operate in different frequency bands and the Bluetooth insertion-loss note limits how directly it can be compared across the full band.
Performance comparison of reported multiplexers

Table 3 Long description
The table compares reported multiplexers by filter type, operating frequency, package type and size, insertion loss, return loss, out-of-band rejection, and isolation. Two SAW quadruplexers are listed at 2150 MHz and 2350 MHz, and one SAW duplexer at 2442 MHz, all in multichip packages; the new design is a monolithic triplexer at 2442 MHz. The monolithic triplexer is 2.5 by 2 mm, with insertion loss 2.5 dB and return loss 11 dB, and it achieves 44 dB out-of-band rejection and 42 dB isolation. The SAW quadruplexer at 2150 MHz has higher insertion loss at 5 dB but similar strong rejection at 43 dB and the highest isolation at 50 dB, in a 2.65 by 2.15 mm multichip package. The SAW quadruplexer at 2350 MHz has lower insertion loss at 2.8 dB but weaker rejection at 20 dB, and its isolation is not reported. The SAW duplexer at 2442 MHz has insertion loss 3.2 dB, return loss 9 dB, rejection 20 dB, and isolation 19 dB, with size not reported. Comparisons are limited because some entries omit size or isolation, and the devices operate at different bands and functions.
Conclusion
In this work, a monolithic integrated triplexer covering the dual-frequency GPS L5/L1 and BT bands is presented. To address the challenge of impedance matching across a wide-bandgap of 1.3 GHz, an analytical synthesis method based on numerical de-embedding was proposed. This method effectively achieves wideband matching without the need for additional matching circuits. Furthermore, considering that high-frequency spurious responses can interfere with other channels in wide-bandgap triplexer designs, a notch inductor was embedded into the substrate to suppress the specific spurious modes in the upper stopband of the L5 filter. This structure significantly enhances the isolation between the L5 and L1 bands. The designed triplexer is optimized by joint simulation after considering the substrate, layout, and package. The monolithic integrated triplexer realized in this work has a size of 2.5 mm × 2.0 mm × 0.6 mm after packaging, which meets the basic performance requirements for dual-frequency GPS positioning and BT communication applications. The triplexer was successfully fabricated, and experimental characterization demonstrates that the measurement results are in good agreement with the joint simulation data. Monolithic integration offers a promising path to improve chip yield, reduce package size, and reduce parasitic effects. Future work will focus on further enhancing the isolation and overall performance by optimizing the monolithic layout and grounding design. The fabricated triplexer exhibits significant potential for application in increasingly miniaturized RF communication fields, such as wearable devices.
Competing interests
The authors report no conflict of interest.
Appendix
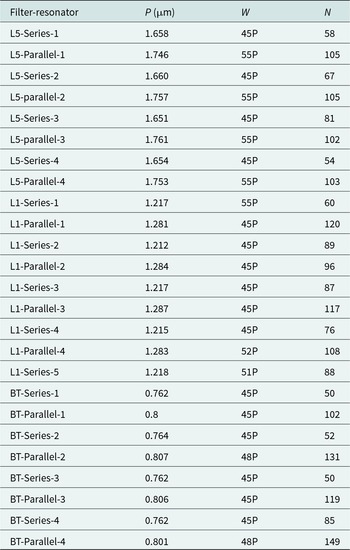
The IDT parameters of the triplexer resonator are shown in Table A1.
IDT parameters of the SAW resonators used in the triplexer
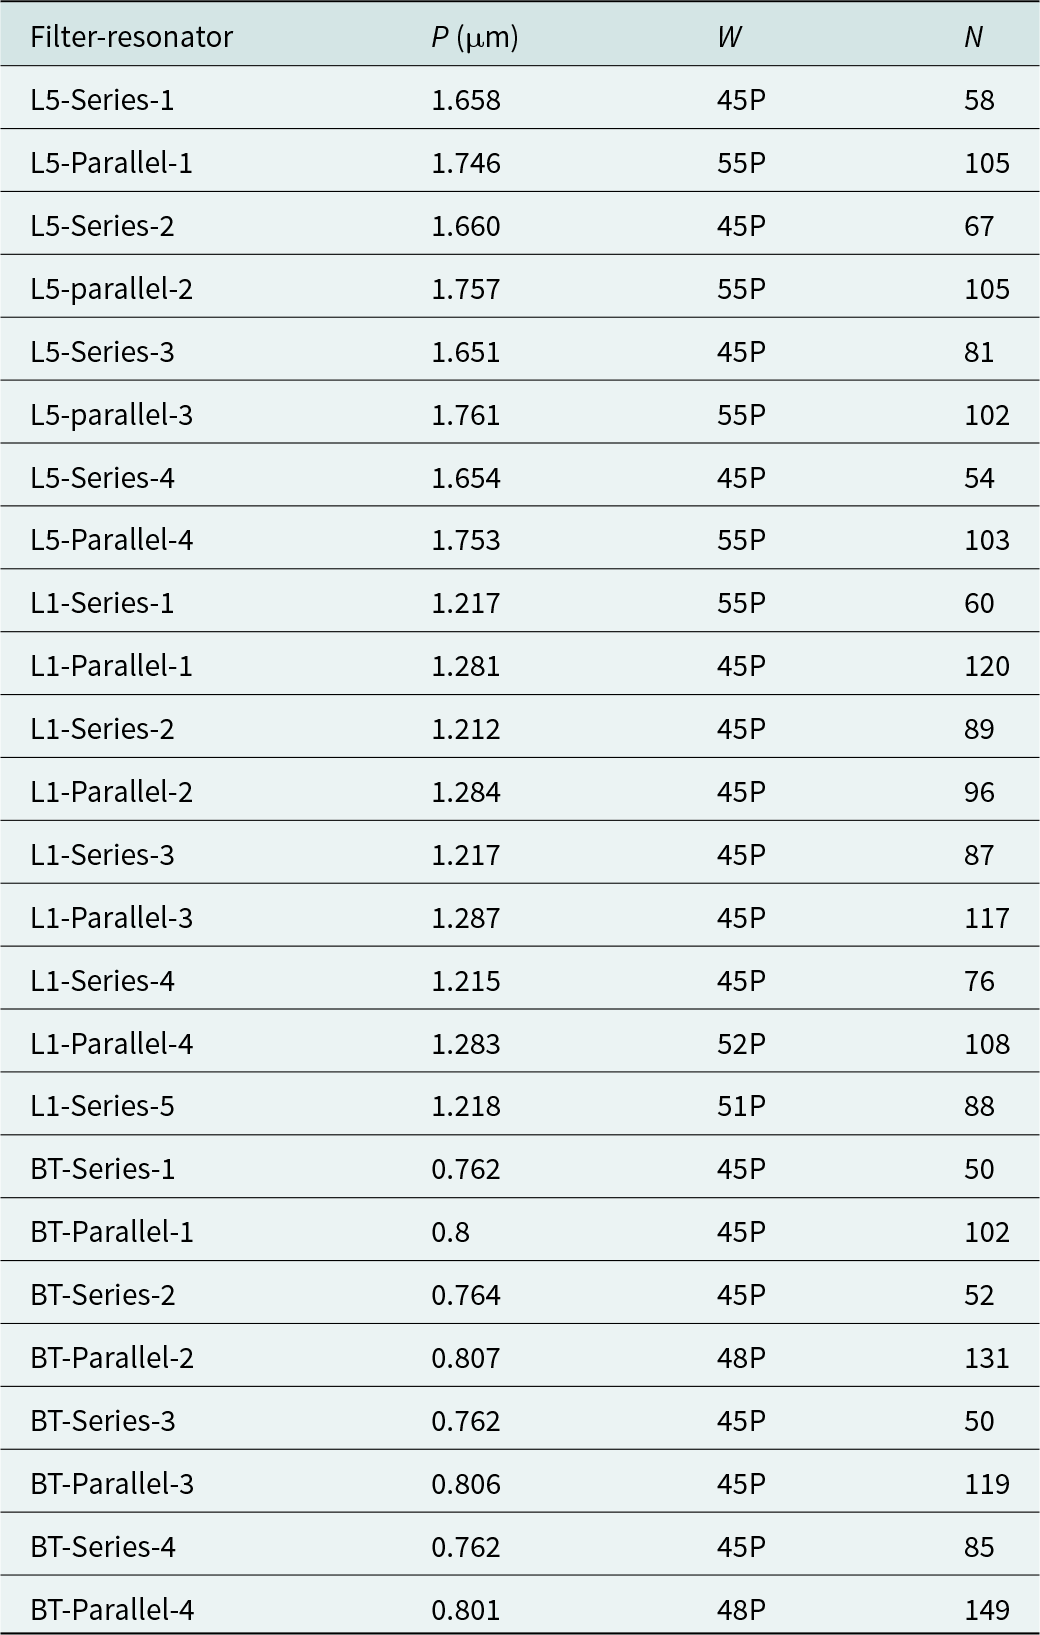
Table A1 Long description
The table lists interdigital transducer design parameters for SAW resonators used in three filter groups: L5, L1, and BT, each with series and parallel resonators. For each resonator it provides the half period P in micrometers, the aperture W expressed as a multiple of P, and the number of IDT pairs N. L5 resonators have the largest P values, about 1.651 to 1.761 micrometers, while BT resonators have the smallest, about 0.762 to 0.807 micrometers; L1 sits between them at about 1.212 to 1.287 micrometers. Parallel resonators typically use more IDT pairs than series resonators within the same group, such as L5 parallel around 102 to 105 versus L5 series around 54 to 81, and BT parallel around 102 to 149 versus BT series around 50 to 85. The highest N appears in BT parallel 4 with 149 pairs, and the lowest N is 50 in several BT series entries. Aperture W is commonly 45P for many series designs, while several parallel designs use larger apertures such as 55P, and a few entries use 48P, 51P, or 52P. Values are discrete design choices per resonator, so differences reflect intended filter behavior rather than measurement variability.
P = half period of IDT; N = number of IDT pairs, W = aperture.

Peiran Li received his M.E. degree in Electronic Communication Engineering from the University of Electronic Science and Technology of China (UESTC), Chengdu, China, in 2021. He is currently pursuing his Ph.D. degree in Integrated Circuit Science and Engineering at UESTC. His current research interests include the design and simulation of surface and bulk acoustic wave devices, research on Lamb wave modes in surface acoustic wave resonators, and the finite-element method (FEM) simulation method.

Bin Peng received the Ph.D. degree in microelectronics from the University of Electronic Science and Technology of China, Chengdu, China, in 2008. He is currently a professor with the University of Electronic Science and Technology of China, and has deep attainments in acoustics and electromagnetics. His current research mainly focuses on surface acoustic wave devices technology.

Zijie Wei received the M.Sc. degree in materials science and engineering from the University of Electronic Science and Technology of China, Chengdu, China, in 2021. He is currently pursuing the Ph.D. degree in electronic science and technology with the National Key Lab of Electronic Thin Films and Integrated Devices, University of Electronic Science and Technology of China, Chengdu, China. His current research field is the fabrication of single-crystal thin film devices.

Wei Fan was born in Changchun, China, in 1995. He received the B.S. degree in physics from Jilin University, Changchun, China, in 2018. He received the M.S. degree in electronic science and technology from the University of Electronic Science and Technology of China (UESTC), Chengdu, China, in 2023, where he is currently pursuing the Ph.D. degree in Integrated Circuit Science and Engineering at the School of Integrated Circuit Science and Engineering. His research interests include the design and simulation of high-frequency surface acoustic wave (SAW) resonators and filters, and the suppression method of transverse modes of S0 mode SAW resonators.

Yuedong Wang received the bachelor’s degree in microelectronics science and engineering from the University of Electronic Science and Technology of China, Chengdu, China, in 2017. He is currently pursuing the Ph.D. degree in electronic science and technology with the National Key Lab of Electronic Thin Films and Integrated Devices, University of Electronic Science and Technology of China, Chengdu, China. His current research field is the design and fabrication of single-crystal thin film devices.

Dahao Wu was born in Shanxi, China, in 1999. He received the B.Eng. and master’s degrees from the University of Electronic Science and Technology of China (UESTC), Chengdu, China, in 2021 and 2024, respectively. He is currently pursuing the Ph.D. degree at the School of Integrated Circuit Science and Engineering, under the supervision of Prof. Chuangui Wu and Prof. Yao Shuai. His current research interests include the simulation and design of surface and bulk acoustic wave devices, and the finite-element method (FEM) simulation method.

Lu Lv received his bachelor’s degree from Tianjin University in 2014 and his doctorate from the University of Electronic Science and Technology of China in 2023. Currently, he is working at the 29th Research Institute of China Electronics Technology Group Corporation. His current research interests are related to acoustics and RF components.

Wenbo Luo received the B.S. degree in electronic science and technology and the Ph.D. degree in material physics and chemistry from the University of Electronic Science and Technology of China, Chengdu, China, in 2004 and 2010, respectively. He is currently working as a Professor with the State Key Laboratory of Electronic Thin Films and Integrated Devices, University of Electronic Science and Technology of China. His current research fields are growth and characterization of oxide function films.

Xinqiang Pan received the B.S. degree in electronic science and technology from the University of Electronic Science and Technology of China in 2013, and the Ph.D. degree in Micro-Electronics and Solid-State Electronics from the University of Electronic Science and Technology of China in 2019. He worked as a postdoctoral researcher at the University of Electronic Science and Technology of China from 2020 to 2022. He currently works as an associate professor at the University of Electronic Science and Technology of China. His current research interests include electronic thin films and electronic device (such as filter, memristor, etc.).

Yao Shuai received the Ph.D. degree in physics from the Technical University of Dresden, Dresden, Germany, in 2013. He is a professor at the School of Integrated Circuit Science and Engineering, University of Electronic Science and Technology of China (UESTC), Chengdu, China. His current research interests include the fabrication of functional oxide thin films, surface acoustic waves, and bulk acoustic wave devices.

Chuangui Wu received the B.Sc. degree in electronic materials and devices, the M.Sc. degree, and the Ph.D. degree in material physics and chemistry from the University of Electronic Science and Technology of China (UESTC), Chengdu, China, in 2001, 2004, and 2009, respectively. He is currently a professor with the National Key Laboratory of Electronic Thin Films and Integrated Devices, UESTC. His current research interests include electronic thin films and integrated devices.