


List of Symbols, Abbreviations and Numerical Constants
-
Cm Concentration by mass of rock component
-
Cv Concentration by volume of rock component
-
m Total sample mass (g)
-
mi Mass of ice in a sample (g)
-
mr Mass of rock in a sample (g)
-
p Pressure (MPa)
-
q Porosity: (volume of voids)/(volume of sample)
-
ri Mean radius of ice grains (cm)
-
rr Mean radius of rock grains (cm)
-
Τ Temperature (K)
-
 Densification rate (s-1)
-
ρ Density (Mg m-3)
-
H2O Water ice or snow
-
gn.-lhz. Garnet-lherzolite
-
met. Stony meteorite
-
snd. Sandstone
 Densification rate (s-1)
Bulk densities, in Mg m−3, used in numerical calculations:
-
ρi = 0.918 Water ice, H2O
-
ρi = 0.9 Ammonia ice, (NH3)x(H20)1−xwhere x = 0.25−0.28
-
ρi = 1.56 Carbon dioxide, CO2
-
ρr = 3.06 Garnet-lherzolite
-
ρr = 2.54 Sandstone
-
pr = 3.41 Stony meteorite, Ym 74013
The experimental data are labeled by the run number as follows:
-
(i) Numbers refer to experiments with pressure produced by loading a piston with weights.
-
(ii) Numbers followed by M refer to experiments with hydraulic press apparatus.
1. Introduction
This experimental work originated from theoretical considerations that concern modeling of the internal structure of the icy satellites of giant planets (Reference Eluszkiewicz, and Leliwa-Kopystyński,Eluszkiewicz and Leliwa-Kopystyński, 1988, Reference Eluszkiewicz, and Leliwa-Kopystyñski,1989). Thanks to Voyager 1 and 2 space missions, the global physical parameters of these satellites (see Table 1) are quite well known at present. Astronomical, cosmochemical and spacecraft close-encounter data suggest that so-called “icy satellites” are composed mostly of water ice with some admixtures of other materials which could be rocks (silicates similar to those known on Earth(?), stony meteorite-type rocks(?)) and solidified gases such as ammonia, methane and others, commonly referred to as “ices”. The proportion of the mass of a satellite that is composed of rock can easily be deduced from the known mean density of the satellite and the densities of water ice and other materials assumed to comprise the satellite. However, the Cm values listed in Table 1 are of dubious value in view of one important question: why should an icy satellite be a non-porous, fully compacted body? If it is porous, Cm is underdetermined. The compositional data (Table 1) become lower bounds of Cm.
Selected physical data for icy satellites

Although this work is focused on applications related to the satellites, the rheological experiments on ice/rock samples may also be interesting in studying the dynamic behavior of other systems, including glaciers on Earth and the regolith and polar caps on Mars.
The experimental pressure range, up to 17.7 MPa, covers the whole interior of Mimas and Miranda, as well as the upper dozens of kilometers of other medium-sized icy satellites. Within the Martian crust and within Earth’s glaciers the maximum pressure in our experiments corresponds to a depth of about 2 km.
Temperature and pressure regimes in the interior of the icy satellites do not preclude the possibility that the constituent material was porous at the time of satellite formation and has remained porous since. As Smoluchowski and others (1984) wrote “There is no reason to suppose that ices in the solar system whether on satellites, in cometary nuclei, on interplanetary grains or on the ring particles of Saturn have no pores”. This opinion was recently proved for a cometary nucleus (Vega and Giotto missions revealed the density of the nucleus of Halley’s comet to be 0.4–0.6 Mg m−3), as well as for icy satellites (based on calculation of thickness of the regolith layer on Mimas by Reference Eluszkiewicz,Eluszkiewicz (1990)). In the initial efforts of modeling the porous structure of icy satellites, the porosity versus pressure relation was assumed ad hoc as being an exponential one and the material rheology was not considered (Reference Eluszkiewicz, and Leliwa-Kopystyński,Eluszkiewicz and Leliwa-Kopystyński, 1988, Reference Eluszkiewicz, and Leliwa-Kopystyñski,1989). In the most recent work (Reference Eluszkiewicz,Eluszkiewicz, 1990), a model including the rheology of a one-component granular material (Reference Ashby,Ashby, 1988) was developed and applied to the modeling of the structure of Mimas and its evolution. In this model, however, the rheology of ice grains but not an ice/rock grain mixture was considered.
The experiments were performed at higher temperatures than those of icy satellites (surface temperatures of Saturnian and Uranian satellites are about 80 Κ and 60 K, respectively). However, temperatures higher than the current mean were attained during the formation of the satellites from dusty/grainy nebula composed of ices and minerals (Reference Ellsworth, and Schubert,Ellsworth and Schubert, 1983; Reference Squyres,, Reynolds,, Summers, and Shung,Squyres and others, 1988). Moreover, diurnal temperature variations are considerable. For example, at the Viking landing sites on Mars, temperatures vary diurnally between about 190 and 240 Κ (Reference Lewis, and Prinn,Lewis and Prinn, 1984).
To improve modeling of the porous ice/rock structure of satellites, it is imperative to carry out rheological experiments on ice/rock mixtures at pressures and temperatures as close as possible to those expected in the interior of satellites. Extrapolation of experimental results from laboratory temperatures to the lower temperatures of real satellites and from laboratory pressures, which do not cover the whole intervals of pressures expected in the satellites, may be necessary. Such an extrapolation should be done with caution, since the laboratory time-scale (days) differs from the time-scale of evolution (about 103−109 years) by 5–11 orders of magnitude. Results from experiments, which are conducted for practical reasons at elevated pressure and temperature, must then be extrapolated to the expected natural, p,T conditions. One can introduce the newly found rheological relations to the system of equations describing the structure of a satellite and seek to answer the question: “How did the porosity and other parameters describing a satellite’s structure evolve from the satellite’s initiation through a primitive post-accretional stage (when it had already reached its present mass) to the evolved present stage?”
Let us consider a two-component perfectly mixed granular body. It could be, for example, a centimeter-size laboratory sample, or a domain of a satellite sufficiently large to be considered a continuum, but sufficiently small for the pressure and temperature to be essentially uniform throughout the domain. Let one component be an ice with density ρi and the second one a rock with density ρr; their masses are mi and mr , respectively. The volume under consideration comprises

Under pressure it decreases with time mainly due to contracting voids and, to a much smaller extent, due to compaction of ice and rock (this part will be neglected from here on). The porosity q is defined as follows:

The rock concentration by mass Cm and by volume Cv are

respectively. Therefore,

The mean density of a body is

where

is the bulk density of a non-porous body.
In the following we will assume that the densities ρi and “r are independent of pressure and temperature. The first assumption is physically reasonable for pressures applied in the experiments (up to 17.7 MPa), as well as for the pressures expected in medium-sized icy satellites (10 MPa and 150 MPa in the deep interiors of Mimas and Rhea, respectively). Neglecting thermal expansion is justifiable when comparing thermally induced changes of sample size to those expected due to void closure. For the icy satellites, the volumetric strain due to thermal expansion can be estimated to be order 0.01, reflecting the thermal expansion coefficient and the expected temperature variability (10−4K−1 × 10²Κ). This is much less than the volume changes resulting from the closure of voids for any loosely sedimented granular material whose initial porosity is as high as 0.4. The volume of a sample under pressure decreases only by means of re-arrangement, crushing and coagulation of grains. Situations where phase transition can occur are excluded.
It follows from Equation (5) with constant ρ0
that the rate at which density increases  is proportional to the rate at which porosity decreases
 :

Therefore, using Equations (5) and Equations (7), the strain rate  of a sample can be expressed as

For low porosity,  , is
 . For convenience, hereafter,
 is referred to as the compaction rate.
2. Sample Preparation
The composition of samples used in the 70 runs are listed in Table 2. Twenty-five runs were performed on water-ice samples without rock because they are relatively simple to interpret and, yet, they provide an instructive comparison with experiments using ice/rock mixtures.
List of experiments


Comments according to column numbers:
-
1. In runs #7–#9 and #15–#42 acoustic emissions from compacted samples were recorded; these runs are marked by the the letter “a”. The letter “n” denotes that the piston-displacement record is not available.
-
4. Rock content by mass Cm.
-
5. Effective radii of ice/rock grains ri/rr , or effective radius of ice grains ri only. For millimeter-size water-ice grains ri denotes the mean radius of hemispherical grains. For millimeter-size rock grains, rr denotes their mean size of equivalent spheres. Powder sizes are determined by sieving and verified by microscope.
-
6. (initial porosity)/(final porosity) = q0/qf.
-
9. Recording time.
-
10. Crushing coefficient k defined by Equation (9).
In columns 8 and 9, numerators are respectively the lowest temperature of the run and the time interval during which the temperature was stable; denominators are the temperature at the end of the run and the total duration of the run.
Cumulative recording times are

The rocky fraction of the samples was prepared at normal room temperature. The temperature at which the granular icy component was prepared varied according to its melting (or sublimation) point. Accurate measurements of the mass were critical in the experiments. However, in some cases, considerable loss of ice by sublimation occurred as the icy material was weighed or mixed with the rock fraction (e.g. when a sample contained powdered water ice or when it was prepared from solid CO2). This loss of ice cannot be distinguished from a porosity decrease of about 0.01. Although this effect is negligible for highly porous samples, it renders the measurement of compaction rate for highly compacted samples difficult and, in some cases, impossible.
We now describe the preparation method of the different components of the samples. The water-ice component of the samples was prepared in a cold room at 263 Κ or less. The millimeter-sized grains were produced from distilled water droplets formed by means of a medical-type injector on a polished aluminum sheet. Once frozen, the hemispherical icy grains were easily removed from the aluminum surface by slightly bending the sheet. The required mass of ice (about 35 g for pure ice samples and less for ice/rock samples was weighed and the grains were counted. One sample typically contained about 1000 grains. The average mass and radius of one quasi-hemispherical grain were about 0.03 g and 0.25 cm, respectively. The production of powder-sized ice grains was simpler and faster: they were made from blocks of natural snow by grating and sieving. The fraction with radii ri <0.0885 mm was used in most of the experiments with powder samples. The sample material was weighed on an electronic balance with a theoretical accuracy of 0.01 g. However, in practice the accuracy was about five times worse, especially for powder samples that lost mass by evaporation during the few minutes required for mixing the ice and rock powder.
Carbon-dioxide ice grains were produced from a commercial dry-ice block by crushing it. Only two experiments involving samples made from CO2 (without rock admixture) were conducted. For run 40, the grains were not selected by sieving and therefore all grains below about ri = 4 mm were used; for run 41 the grains were sieved and a size 2.38 mm < ri < 4.76 mm was selected. CO2-ice grains were weighed and placed immediately (to avoid considerable loss of mass by sublimation), without counting, into the pressure cylinder previously cooled with liquid nitrogen.
Ammonia-ice grains were prepared by freezing ammonia-water droplets in liquid nitrogen. Ammonia water contains more than 25% and less than 28% of the NH3. The critical moment in preparing the ammonia-ice sample was when the grains were removed from the liquid nitrogen bath and weighed: the melting point of ammonia ice is about 170 Κ (for details concerning the ammonia/ water system, see Reference Johnson,, Schwake,, Nicol, Klinger,, Benest, and Smoluchowski,Johnson and others (1985), Reference Croft,, Limine, and KargelCroft and others (1988) and Reference Kargel,, Croft,, Lunine, and Lewis,Kargel and others (1991)). After removing the grains from the bath they soon became soft and started to stick together. To minimize this, the weighed samples were placed as quickly as possible into the pressure cylinder, which had been pre-cooled in liquid nitrogen. The weighing precision was no better than about 2 g (about 4% of the mass of a sample) for runs 14 and 42, and it was even worse for run 39. In such difficult conditions, the ammonia-ice grains were not counted and their size was only roughly estimated.
The lithic component of the samples included garnet-lherzolite, used in 36 experiments, sandstone (three runs) and stony meteorite (only one run; no more material was available).
The garnet-lherzolite came from the Sowie Góry Mountains gneiss block near Bystrzyca Górna in the Polish Sudetes. Its bulk chemical composition in weight per cent is 40.6% SiO2, 36.5% MgO, 8.9% H2O, 5.0% FeO, 2.8% A12O3, 2.7% Fe2O3, 2.4% CaO, 1.1% others); recalculated on a water-free basis (44.5% SiO2, 40.0% MgO, 8.2% (FeO)total, 3.1% A12O3, 2.6% CaO, 1.6% others); this composition is similar to that of Earth’s upper mantle. The approximate mineralogical composition of garnet-lherzolite in volume per cent is: 63% olivine, 17% orthopyroxene, 11% clinopyroxene, 4% garnet, 4% clino-amphibole and 1% spinel. Its density, 3.06 Mg m−3, is close to that commonly assumed for the density of rock components of the bodies belonging to the Outer Solar System.
The sandstone material was collected from a borehole at Kompina, Poland, at a depth interval of 3648–3654 m. The sandstone has a chlorite matrix and its bulk composition by weight is 72% SiO2, 13.3% A12O3, 3.4% Na2O, 2% FeO, 1.8% Fe2O3 and 7.5% others. Its density is 2.54 Mg m−3. It is weak and easily crumbled.
The meteorite material originates from a 13.81 g fragment of an Antarctic stony meteorite, Ym 74013. This fragment had been used previously in other studies during which it was heated to 1073 K; we assume that the heating did not significantly affect its mechanical properties. The density of the meteorite is 3.41 Mg m−3; chemical and mineralogical analyses have not been conducted.
The rocky material was crushed and sieved. For the samples prepared from rock grains millimeters in size, the grains were weighed and counted. The mean radii of the rock grains (Table 2) are calculated assuming they are spherical in shape.
The rock component can play a “passive” or an “active” role in the compaction of ice/rock mixtures. We define the passive behavior as that when the rock grains do not crush and hence when the pores do not fill with the smaller rock fragments. In such a case, the volume of pores diminishes only because of crushing and creep of ice grains. The rock grains play the role of rigid inclusions affecting the re-arrangement and deformation of the ice grains. Rock grains play an active role when they crush. In the following, we define the crushing coefficient k. The counting and weighing of rock grains performed before a run were repeated after the run: after thawing, the recovered sample was dried and the same number of the largest recovered rock grains as the number of rock grains nr initially comprising the sample was weighed. We define the crushing coefficient as

When k = 0, the rock grains initially in the sample were not crushed at all. On the other hand, when k → 1 the rock grains were almost completely crushed to powder during compaction. One can expect that the crushing coefficient, for fixed rock, increases when pressure and/or rock concentration increases. For fixed pressure and concentration, k is expected to be greater for weaker rocks. The results listed in Table 2 support this speculation: k is generally around 0.02 for H2O/gn.-lhz. samples, which is distinctly lower than for H2O/snd. samples (k≅0.2).
3. Experiments
The primary output from the experiments is the change in porosity as a function of time generally under fixed stress and temperature conditions. In addition, interesting results were obtained from records of strain versus time for fixed stresses and variable temperatures.
Records of acoustic emission (number of single acoustic events above a certain threshold recorded in a time interval versus time) and the microscopic photography of thin sections of the recovered samples (for samples prepared from powdered material) provide supplementary information on the compaction processes. Two types of apparatus were used.
3.1. Apparatus in which pressure is produced by loading of a sample by mechanical weights
This is a modified version of equipment used in the experiments of Reference Ebinuma, and Maeno,Ebinuma and Maeno (1985, Reference Ebinuma,1987) and Reference Ebinuma, and Maeno,Ebinuma (1987). Three brass and stainless-steel piston cylinder systems were applied, with inner radii of 1.5 and 1.06 cm (cross-sections of 7.06 and 3.53 cm2), respectively. The cylinder height is 13 cm and the maximum initial height of a sample was ≅12 cm. However, in most of the runs (CO2 and ammonia samples being the exceptions), the initial height and volume of the samples were about 8.5 cm and 60 cm3; the initial aspect ratio (diameter/ height) was about 0.35; the final value was up to about 0.6. If the aspect ratio is too small, as it is in the thinner cylinder, the friction between a compacted sample and the wall of the cylinder influences the experimental results considerably. For that reason, the piston displacements for some runs cannot be taken into account.
The pressure was applied by placing steel weights on the piston, therefore the pressure increases incrementally during the loading phase.
The runs at 262, 248 and 228 Κ were conducted under cold-room temperature conditions, and all elements of the equipment were at the same temperature.
During the runs with temperatures of the cooling medium equal to 195 Κ (solid CO2 mixed with ethanol) and 77 Κ (liquid N2), maintenance of stable temperatures was difficult due to heat conduction. The temperature was monitored by three copper/copper-nickel thermocouples mounted 0.3 cm below the bottom of the sample, on the wall of the cylinder 3 cm above the bottom and within the piston 0.3 cm above the sample top (Fig. 1).
Schematic diagram of the apparatus in which pressure is produced by loading a sample with weights. S, sample; P, piston; L, loads; GB, guide bars for loads; SG, strain gauge; AS, acoustic-emission sensor; Th, thermocouples mounted in the bottom of cylinder (b), inside of its wall (w) and inside of the piston (p); CM, cooling medium (if any); I, thermal insulator.

The average of three temperatures was taken to be the sample temperature. The difference of temperature from the bottom to the top of the sample was about 10 Κ during stable cooling conditions, or even more during a period just after evaporation of the cooling medium. Thus, the temperature regime varied from stable and cold (while in the cooling bath) through variable to constant (while in the cold room). Measurements of piston displacements were difficult in the cooling bath. Much more accurate results could be obtained when the temperature increased above a certain threshold, at which point the piston-displacement rate and the acoustic emission activity increased considerably. This was the motivation for conducting the experiments in the variable temperature regime.
An acoustic-emission transducer was mounted on the lateral wall of the cylinder. In this work, the details of acoustic emission activity are not considered; however, it is worth mentioning that peaks in activity were correlated with rapid consolidation. This suggests that consolidation is caused by continuous deformation of material interrupted by abrupt cracking events.
3.2. Apparatus with oil press
This equipment allows us to reach higher pressures than with the previous apparatus, but it is restricted to temperatures above 248 K, since no cooling medium can be applied. Pressure was increased smoothly (not step-like) to maximum pressures of 4.4, 9.0, 13.3 and 17.7 MPa. The higher pressure requires the piston-cylinder system to have a smaller cross-section. Three different stainless-steel piston-cylinder systems were used with cross-sections of 12.56, 6.246 and 3.173 cm2. The corresponding initial volumes of the samples were about 60, 30 and 15 cm3; the initial ratio of sample diameter to sample height was about 0.84; the final ratio was up to about 1.5. The cold-room temperature was 262 and 248 K. Pressure and temperature were continuously recorded. Pressure was stable within an interval of ±1.5% or better, and temperature variability was ± 1 K. The sample-mounting system inside the oil-press apparatus does not permit recording acoustic emission from the sample.
3.3. Piston-displacement recording
The experimental accuracy of the displacement measurement in all runs was about 0.1 mm. For the low-temperature runs when the cooling medium was used, as well as for the final periods of strain monitoring for the runs performed in typical cold-room temperatures, the piston displacement is very small, just on the limit of accuracy. Therefore, for low-temperature runs, an estimate of the upper limit of compaction rate requires stable temperature conditions to be maintained at least for a few hours. The final stage of a typical cold-room run requires more than a 1 d period for reliable measurements of compaction rate.
The piston-cylinder method used in our experiments is complicated by friction between the sample and the cylinder, which inhibits sample compaction. The flatter the sample is, the smaller the friction effects are. However, flatter samples were not used because piston displacement for such samples would be so small as to render accurate measurement of porosity changes difficult. A loose fit between the piston and the cylinder’s walls is important, otherwise the piston readily freezes to the cylinder. No rings or seals were necessary. It is difficult to estimate reliably the magnitude of friction effects; they are neglected in the analysis of the results.
Another potential complication that can affect the experiments is the pressure of air trapped within the samples. A simple calculation shows that the air pressure in the pores is not important when compared with external pressure. Indeed, consider the porosity qp = 0.1 to be at the limit for air percolation and the porosity qm = 0.02 to be the lower limit of reliable porosity measurements. The pressure of air trapped in pores (when qp ≤ q ≤ qm ) is no higher than qp/qm = 5 times the atmospheric pressure, which is much less than the external pressure used in the experiments.
4. Results
4.1. General approach
Experimental records of piston displacement versus time t permit the evaluation of the compaction rate  as a function of the porosity q. For each run, we first sought simple expressions between q and log t, or log (
 ) and log t. Finally, an equation of the form

was fitted to a complex of experimental results. The numerical coefficients in Equation (10) depend on sample-specific material parameters.
In the experiments, time is measured from the moment t = 0, when the sample is first loaded. An initial period of each experiment t0 , some 50–600 s, was used for the increase of pressure until it reached a required value; q(t0) = q0 . Piston displacements and hence q tend to decrease continuously with time during the initial period (runs #1M–#28M and most of the other runs performed at a temperature not lower than 248 K; Fig. 2a). Displacements are often discontinuous for low-temperature runs (step-like; Fig. 2b). Once a stable pressure is established, the porosity decreases continuously for runs with Τ ≥ 248 Κ. For lower temperatures, the consolidation is generally but not invariably continuous.
Piston displacement versus time records. H2O/ garnet-lherzolite samples with Cm = 0.57 and thus Cv = 0.285. (a) Run #8 with Τ = 262 K; ri/rr = 0.292 cm/0.249 cm; continuous displacements, (b) Run #13 with Τ < 133 Κ; ri/rr = 0.212 cm/0.191 cm; jerky displacements. In both runs until t = 0s, the sample was initially loaded by the piston weight only. Next, at t = 0, 60,120,180 and 240 s, pressure was increased each time by 0.088 MPa, and from t = 300 s until t = 510 s it was increased by 0.223 MPa every 30 s. Piston displacements are given in arbitrary units.

Let us discuss the runs with the characteristically continuous consolidation. For the majority of experiments, large segments of the data can be approximated by:

Correlation coefficients obtained by standard linear-regression analysis are frequently as high as 0.99 or even 0.999 for porosity changes as great as ≅0.2, which is half of the whole range of porosities in the experiments. In our preliminary study of experimental results (Reference Leliwa-Kopystyński,, Murakami,, Mizuno,, Maeno, and Bakun-Czubarow,Leliwa-Kopystyński and others, 1990), the coefficient Β in Equation (11) was narrowly defined: Β
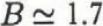 for 262 K, and it decreases to Β
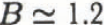 for 203 K.
In fitting the data with

the coefficient Β varied from run to run with a large range of approximately 10 to 100. At a first glance, there is no correlation between the values of Β and the parameters p and Cv. However, Β is clearly greater when (i) the temperature of a run is relatively low or, when (ii) the sample is highly compacted. This second feature prompted us to analyze our data.
To ensure that the compaction rate  vanishes as the porosity q approached zero, we fitted the following expression

This is a particular case of Equation (10), with which the rate at which porosity decreases is proportional to the porosity. This proportionality corresponds to power-law creep written in a form valid for low porosity q < 0.1 (Reference Eluszkiewicz,Eluszkiewicz, 1990; after Reference Ashby,Ashby, 1988). Ashby distinguished six main densification mechanisms for granular materials: pressure-driven volume diffusion, pressure-driven boundary diffusion, surface-tension driven boundary diffusion, Nabarro-Herring creep and power-law creep. Rates of pressure-driven volume diffusion and power-law creep are particularly dependent on porosity. In both mechanisms, the compaction rate depends on temperature, mostly through a similar exp(−Q/RT) term where Q is the activation energy for a given mechanism and R = 8.314 J mol-1K-1. Only the power-law creep depends strongly on actual pressure; for details concerning densification mechanisms of porous media see Elusuzkiewicz (1990), after Reference Ashby,Ashby (1988) (general) and after Reference Kirby,, Durham,, Beeman,, Heard, and Daley,Kirby and others (1987) (water ice). Anticipating results discussed later, we can consider power-law creep to be the main mechanism for compaction of the granular ice/rock mixtures under constant-pressure conditions. If pressure does not remain constant (as during the initial phase of laboratory experiments or during the formation epoch of the satellites when previously accreted ice/rock regolith layers are loaded by later deposits) substantial densification also occurs by crushing and re-arrangement of grains. In this case, since the rock grains are considerably stronger than the ice, they play an important role in the re-arrangement and creep of ice. Such a situation corresponds to low values of the crushing coefficient k < 0.02, Equation (9), and is certainly valid for H2O/gn.-lhz. samples with Cm ≤ 0.5 studied under pressure up to 4.5 MPa (Table 2).
Bearing in mind the power-like dependence of compaction rate on pressure and its exponential dependence on temperature, one can postulate the simplest form of the parameters A and Β in Equation (13):


Thus, Equation (13) takes the following form

For a given sample (Cv = const), under fixed pressure and temperature, A and Β can be found by linear regression applied to Equation (13) having taken the logarithm of both sides. An analysis of sufficient runs provided the values of coefficients 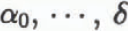 (Table 3).
Empirical coefficient in Equation (16) obtained by regression analysis on data from 28 runs with H2O/garnet-lherzolite powder samples

Parameter δ0,
Equation (14), is related to the activation energy Q for power-law creep of pure ice:  Hence,

where δ0 is in degrees Kelvin and Q is in k J mol−1. The activation energy Ε of the ice/rock mixture is

where the term Δ reflects the presence of rock grains. The term log(1 – Cv), but not Cv itself, is introduced in Equation (14) to ensure that the compressibility of the ice/rock medium vanishes as the amount of ice approaches zero (Cv → 1). In this case, according to Equation (18), the effective excess activation energy Δ should go to infinity, in accordance with the observation that the pressures applied in our experiments were insufficient to induce creep in the rock grains.
4.2 H2O/rock powder mixtures at 262–228 Κ
Twenty-eight runs were completed using powdered water ice and garnet-lherzolite with two initial grain-sizes: ri < 0.0885 mm and rr ≅ 0.01 mm. The pressure ranged from 2.28 to 17.7 MPa. The garnet-lherzolite concentrations by volume were 0, 0.0909, 0.231 and 0.434 (one run only), and the temperatures were 262, 248 and 228 Κ (two runs only). For different runs, Equation (16) was fitted within a series of porosity intervals, all being within the 0.38–0.02 porosity range. In addition, regression analyses were conducted for two particular porosity intervals: q ≅0.08–0.02 and 0.16–0.11 (Table 3). Focusing on a particular porosity interval is physically reasonable since the dominant pore-closure mechanism can vary over a broad porosity range. On the other hand, any particular choice of porosity interval diminishes the number of runs available for analysis. Including larger ranges of q in the regression analysis provides more comprehensive relations but may result in lower accuracy. Nevertheless, a “universal” equation, covering the large range of porosity and other parameters, would be very useful in modeling the internal structure and evolution of the icy satellites.
The results in Table 3 require a few remarks. (1) The error bars for coefficient values are marked for the entire range of porosity available; the number of runs is insufficient to assess errors reliably. (2) The coefficients α0 and δ0
for the entire range of porosity are very poorly constrained. However, quite reasonable estimates were obtained for the combination (α0 – δ0/Τ) for temperature ranging from 262 Κ to 248 K. This arises from the 10α0−δ0/T
term in Equation (16), which permits the (α0 – δ0/Τ) combination to be estimated more accurately than either α0
or δ0
taken independently. (3) The results from other researchers for the creep of water ice also follow the power law  . Apart from reporting results for 240–258 K, which are comparable to ours, Reference Kirby,, Durham,, Beeman,, Heard, and Daley,Kirby and others (1987) presented results from two other temprature ranges. They found that α0, β0
and Q for Τ = 195–240 Κ are 5.10 ± 0.03, 4.0 ± 0.1 and 61 ± 2 k J mol−1, respectively; for T ≤ 195 K, they are −2.8 ± 0.6, 4.7 ± 0.3 and 36 ± 5 k J mol−1, respectively.
In Fig. 3a–d representative experimental curves of compaction rate versus porosity are compared with the regression (Equation (16)) obtained from all data. Particular parameters were: α0 = 8.29, β0 = 6.1, δ0 = 4539 Κ, β = 8 and δ = 4500 Κ. For runs at 262 Κ, the coefficient α was set to 11.7. As the slopes of the compaction-rate curves increase strongly with decreasing temperature (Fig. 3d), it was useful to introduce a linear relation between α and the reduced temperature, Tmelting − T. For the samples containing water ice,

preliminary estimates of a being 0.2. Experiments over a larger interval of temperature are needed to determine a more accurately.
a-d. Compaction rate versus porosity. Solid lines: experiments; the label for each run allows reference to Table 2 for additional information. Dashed lines: curves fitted to experiments by means of Equation (16), with appropriate parameters p, T, Cv and coefficients α,...,δ, which were found for H2O\gn.-lhz_. powder/powder mixtures for the entire porosity range examined (see Table 3).

The dominant role of temperature in the rheological Equation (16) is expressed through the exponential term. The term 10aq in which α varies with temperature (Equation (19)) is less important; moreover, its role diminishes with decreasing porosity.
Experimental results for pure H2O powders and H2O/ rock powders for three different rocks are presented in Figure 4. The rock content by mass was Cm = 0.5 and, hence, the volume concentrations Cv were 0.212, 0.231 and 0.265 for an Antarctic meteorite, garnet-lherzolite and sandstone, respectively. The dashed lines represent fits, Equations (16) and Equations (19), to the experiments. The fit is adequate for the H2O and H2O/gn.-lhz. samples, as expected since these samples were used for developing the fitting formulae, and it is also adequate for the H2O/met. sample. However, the fit fails for the H2O/snd. sample, presumably because sandstone is a soft rock; its crushing coefficient k (Equation (9); Table 2) is an order of magnitude greater than that of garnet-lherzolite. Sandstone may play the role of “a lubricant” with water ice. In Equation (16), only the coefficient δ reflects a lithological influence on the rheological behaviour; thus, one can conclude that < δsnd. < δgn.−lhz. The experiment with rock of a meteoric origin (run # 26 M; Fig. 4) gives a rheological effect similar to that for the garnet-lherzolite admixture. This similarity provides yet another argument (beside the mineralogical and cosmochemical ones) that garnet-lherzolite is a more realistic material than sandstone for examining the ice-rock rheology in the Solar System.

4.3. H2O and H2O/garnet-lherzolite mm-sized mixtures at 262–140 Κ
Results from the two series of experiments are presented in Figures 5 and 6. We were not able to fit a formula of the type of Equation (16) due to the scarcity of data. However, two very important conclusions can be drawn from the results. First, garnet-lherzolite in water ice (Cv = 0.231) reduces the rate of pore closure by at least two orders of magnitude. Secondly, no influence of grain-size on compaction rate was observed.
Compaction rate versus porosity for different temperatures. Experiments with H2O samples prepared from mm-sized grains.

Compaction rate versus porosity for different temperatures. Experiments with H2O/garnet-lherzolite samples prepared form mm-sized grains.

4.4 CO2 ice and ammonia ice
Only five runs, at 2.28 MPa, were made with these materials: two with CO2 ice and three with ammonia-water ice (about 25% NH3). However, these preliminary experiments allowed the activation energy Q to be estimated. A formula fitted to the experiments was

and thus similar to Equation (16); the coefficient δ0 has the same meaning as previously (Equation (17)). It was estimated that for CO2 ice between 105 Κ and 190 Κ δ0
is about 400 K, corresponding to an activation energy Q of about 104 J mol-1. For ammonia ice under similar pressure and within the 100–120 Κ temperature interval,  and therefore
 . More experiments are required to substantiate these results and to assess the pressure-dependence of the coefficients.
5. Conclusions
The presence of rock fragments (≅25% by volume) in porous H2O ice can decrease its compaction rate by about two orders of magnitude (for pressures ≤ 17.7 MPa and temperatures 228–262 K). This inhibitory effect is likely to be even more pronounced at lower temperatures and high porosities q ≅ 0.3 but additional studies are necessary to substantiate this (Figs 5 and 6).
The rheology of the CO2 and ammonia ices was studied here apparently for the first time. Preliminary results show that these materials are more easily compacted than H2O ice. As expected, their rheological behaviour is dictated by pressure, temperature and porosity. The activation energies of H2O, CO2 and ammonia ices were measured.
Our results have direct implications for studies of the evolution of satellites and may also pertain to aspects of glaciers on Earth.
Acknowledgements
The experiments were conducted in the Institute of Low Temperature Science, Hokkaido University at Sapporo, Japan. Special thanks are expressed to Dr Y. Mizuno and Mr S. Murakami of this Institute for their kind assistance during the experiments. The rock material for the samples was provided and analyzed by Dr Ν. Bakun-Czubarow (gn.-lhz. and snd.) and Dr M. Funaki (Antarctic meteorite). The authors also wish to thank the anonymous referees, as well as Professor B. Hallet, for their helpful criticism. J. Leliwa-Kopstynski is grateful to the Japanese Society for the Promotion of Science for a research grant.
The accuracy of references in the text and in this list is the responsibility of the authors, to whom queries should be addressed.



