INTRODUCTION
Understanding the association between the distribution of resources and large herbivores provides a key link into quantifying herbivore abundance in extinct ecosystems in the near and distant past. The distribution of herbivores is closely linked to the distribution of forage resources throughout Africa, and therefore animals may be predicted to aggregate in areas that are the most profitable (Bailey et al., Reference Bailey, Gross, Laca, Rittenhouse, Coughenour, Swift and Sims1996; Grange and Duncan, Reference Grange and Duncan2006; Jones et al., Reference Jones, Pilkington and Crawley2006). The Palaeo-Agulhas Plain (PAP), now submerged off the coast of the southern Cape of South Africa but maximally exposed during the last glacial maximum in the late Pleistocene, was no exception. Understanding how these herbivores articulated with this now extinct environment is imperative to understanding the landscape. The PAP fossil assemblages depict species presence and absence, and some information on abundance (Venter et al., Reference Venter, Brooke, Marean, Fritz and Helm2020), but give little indication into the ecology of these species in the past and on the PAP and Greater Cape Floristic Region (GCFR) environments. Modeling exercises such as what we express here can help inform us on that ancient herbivore ecology.
The PAP was last fully exposed during the last glacial maximum (LGM; 26–19 ka) when low sea levels (~125 m lower than current sea levels) resulting from an increased global ice volume expanded the land surface area by 80,653 km2 along the shallow continental shelf of South Africa (van Andel, Reference van Andel1989; Fisher et al., Reference Fisher, Bar-Matthews, Jerardino and Marean2010; Marean et al., Reference Marean, Cowling and Franklin2020). The PAP stretched from Cape Hangklip in the west to Port Elizabeth in the east and was bounded inland by the Cape Fold Belt mountains (Cawthra et al., Reference Cawthra, Cowling, Andò and Marean2020). Along the current coastline, archaeological and paleontological records (Klein, Reference Klein, Deacon, Hendey and Lambrechts1983; Marean et al., Reference Marean, Cawthra, Cowling, Esler, Fisher, Milewski, Potts, Singels, De Vynck, Allsopp, Colville and Verboom2014; Venter et al., Reference Venter, Brooke, Marean, Fritz and Helm2020) depict numerous herbivores on the PAP, especially grazing herbivores (Klein, Reference Klein, Deacon, Hendey and Lambrechts1983; Rector and Reed, Reference Rector and Reed2010; Copeland et al., Reference Copeland, Cawthra, Fisher, Lee-Thorp, Cowling, Le Roux, Hodgkins and Marean2016; Helm et al., Reference Helm, McCrae, Lockley, Cawthra, Thesen and Mwankunda2018, Reference Helm, Cawthra, Cowling, De Vynck, Lockley, Marean, Thesen and Venter2020; Venter et al., Reference Venter, Brooke, Marean, Fritz and Helm2020) that would have used the readily available grassy vegetation types (grassland and floodplain woodlands) that the PAP offered (Cowling et al., Reference Cowling, Potts, Franklin and Marean2020). Now fronting the coast, these archaeological sites would have opened onto the exposed PAP and feature prominently in our understanding of modern human origins (Marean et al., Reference Marean, Cawthra, Cowling, Esler, Fisher, Milewski, Potts, Singels, De Vynck, Allsopp, Colville and Verboom2014). The PAP would have provided early humans with numerous resources, such as large biomass of large herbivores (Venter et al., Reference Venter, Brooke, Marean, Fritz and Helm2020) and grassy vegetation (Cowling et al., Reference Cowling, Potts, Franklin and Marean2020), that are now scarce in the fynbos biome. The PAP would have been crucial to the lives of the ancient people inhabiting these sites, so building a robust understanding of the paleoecology of the herbivores also serves research into human origins.
In this paper, we use modern ecological data to model the ecology of the PAP ecosystem beyond what can be attained through fossil records. The distribution of herbivores throughout Africa is strongly linked to the mean annual precipitation (Coe et al., Reference Coe, Cumming and Phillipson1976; Mills et al., Reference Mills, Biggs and Whyte1995). We use that relationship to predict herbivore distribution during the LGM on the PAP. Using metabolic large herbivore biomass (MLHB) from 39 protected areas in South Africa spanning four biomes (fynbos, thicket, savanna and grassland), we use the large herbivore biomass (LHB) for five functional groups of large herbivores (Hempson et al., Reference Hempson, Archibald and Bond2015a) to calculate and predict MLHB for the PAP.
Background
In most cases, the ability of an ecosystem to support a certain herbivore biomass is determined by abiotic factors that affect vegetative production, such as soil fertility and rainfall (Fritz and Duncan, Reference Fritz and Duncan1994; Fynn, Reference Fynn2012). In Africa, rainfall, which is widely considered to be one of the most influential driving components in ecosystems (Coe et al., Reference Coe, Cumming and Phillipson1976; Mills et al., Reference Mills, Biggs and Whyte1995), correlates positively with vegetation, and therefore forage biomass (Chase et al., Reference Chase, Leibold, Downing and Shurin2000). Rainfall directly influences vegetative production and indirectly the LHB (Coe et al., Reference Coe, Cumming and Phillipson1976; Mandujano and Naranjo, Reference Mandujano and Naranjo2010; Hempson et al., Reference Hempson, Archibald and Bond2015a). The relationship between LHB and rainfall is well known, and several studies have highlighted its importance (Coe et al., Reference Coe, Cumming and Phillipson1976; Fritz and Duncan, Reference Fritz and Duncan1994; Olff et al., Reference Olff, Ritchie and Prins2002; Mandujano and Naranjo, Reference Mandujano and Naranjo2010). In African savannas, rainfall is known to be correlated to LHB (Bell, Reference Bell, Huntley and Walker1982; McNaughton et al., Reference McNaughton, Oesterheld, Frank and Williams1989; Moen and Oksanen, Reference Moen and Oksanen1991; Fritz and Duncan, Reference Fritz and Duncan1994). However, rainfall alone cannot explain the distribution of LHB. LHB is known to increase with an increase in rainfall up to a certain threshold (~800 mm mean annual precipitation) whereby nutrients rather than rainfall limit large herbivores (Hempson et al., Reference Hempson, Archibald and Bond2015a). Importantly, this threshold is seldom reached on the PAP (Engelbrecht et al., Reference Engelbrecht, Marean, Cowling, Engelbrecht, Neumann, Scott, Nkoana and O'Neal2019). Nutrient availability, derived from underlying geology, also influences herbivore distribution (Bell, Reference Bell, Huntley and Walker1982; Fritz and Duncan, Reference Fritz and Duncan1994) because soil nutrients influence the production and quality of vegetation available to large herbivores, hence the relative contribution of dietary types (Fritz et al., Reference Fritz, Duncan, Gordon and Illius2002; Eronen et al., Reference Eronen, Puolamäki, Liu, Lintulaakso, Damuth, Janis and Fortelius2010). It is also important to note that cooler temperatures during the LGM (2–4°C; Engelbrecht et al., Reference Engelbrecht, Marean, Cowling, Engelbrecht, Neumann, Scott, Nkoana and O'Neal2019) would have resulted in increased moisture availability and decreased evaporation. More humid conditions during the Pleistocene (Chevalier and Chase, Reference Chevalier and Chase2016; Faith et al., Reference Faith, Chase and Avery2019, Reference Faith, Braun, Davies, DeSantis, Douglass, Esteban and Hare2020) that peaked during the LGM (Chevalier and Chase, Reference Chevalier and Chase2016) may have resulted in a more productive environment that what we see in South Africa today. Importantly, being more productive may not correspond to increased herbivore biomass because productivity corresponds negatively with nutrient content (Olff et al., Reference Olff, Ritchie and Prins2002).
In modern systems, herbivores reach their highest densities in areas with high soil fertility and related high primary production (Bakker et al., Reference Bakker, Gill, Johnson, Vera, Sandom, Asner and Svenning2016). In South Africa, both rainfall and soils also play important roles in the delimitation of biome boundaries (Mucina and Rutherford, Reference Mucina and Rutherford2006). In the southern Cape of South Africa, vegetation patterns and biomes are primarily driven by soils, climate (seasonality and amount of rainfall, temperature and frost), and the influence of fire (Cowling et al., Reference Cowling, Potts, Franklin and Marean2020). The GCFR (in particular the fynbos biome) is characterized by low-nutrient soils (Kerley et al., Reference Kerley, Landman and De Beer2010) and winter rainfall. These low-nutrient soils and winter rainfall carry only a low biomass of solitary herbivores and are unlikely to support resident populations of large herbivores (Radloff, Reference Radloff2008; Marean et al., Reference Marean, Cawthra, Cowling, Esler, Fisher, Milewski, Potts, Singels, De Vynck, Allsopp, Colville and Verboom2014). In contrast, areas with higher soil nutrients, such as in savannas with summer rain, are characterized by far greater numbers of large gregarious herbivores (Bell, Reference Bell, Huntley and Walker1982; Fritz and Duncan, Reference Fritz and Duncan1994). Similar trends in soil nutrients can be seen in the GCFR where low soil fertility in the west increases eastward up the coast (Cawthra et al., Reference Cawthra, Cowling, Andò and Marean2020), which relates to the higher herbivore abundance seen in the eastern PAP (Reynard and Wurz, Reference Reynard and Wurz2020).
In addition to environmental gradients, species traits also influence how herbivores distribute themselves. Body size is important to herbivore distributions in landscapes and is commonly used to explain niche separation between species along environmental gradients (Veldhuis et al., Reference Veldhuis, Kihwele, Cromsigt, Ogutu, Hopcraft, Owen-Smith and Olff2019). Smaller herbivores are more likely to be limited by the quality of forage within the environment (body size constraint hypothesis) because they have shorter gut-retention times (Shipley, Reference Shipley, Launchbaugh, Sanders and Mosley1999) and are unable to effectively digest low quality forage (Demment and Van Soest, Reference Demment and Van Soest1985; du Toit and Owen-Smith, Reference du Toit and Owen-Smith1989; Illius and Gordon, Reference Illius and Gordon1992), whereas larger herbivores have longer gut-retention times (Shipley, Reference Shipley, Launchbaugh, Sanders and Mosley1999) and are able to tolerate larger quantities of lower quality forage material (Cromsigt et al., Reference Cromsigt, Prins and Olff2009; Pretorius et al., Reference Pretorius, de Boer, Kortekaas, van Wijngaarden, Grant, Kohi, Mwakiwa, Slotow and Prins2016). However, herbivore size may also negatively affect larger species because larger species tend to be more susceptible to drought. This is especially true for grazers because grazers are generally water dependent (Hempson et al., Reference Hempson, Archibald and Bond2015a) and shallow-rooting grasses tend to dry out much faster than deep-rooted woody species (Veldhuis et al., Reference Veldhuis, Kihwele, Cromsigt, Ogutu, Hopcraft, Owen-Smith and Olff2019). Body size also affects herbivore susceptibility to predation, with larger species being susceptible to predation by fewer predators (nested effect of predation; Sinclair et al., Reference Sinclair, Mduma and Brashares2003; Hopcraft et al., Reference Hopcraft, Olff and Sinclair2010).
In addition to size, one also needs to consider digestive strategy in determining how herbivores distribute themselves. The unselective nature of non-ruminants (most of which consume varying proportions of browse and grass; Hempson et al., Reference Hempson, Archibald, Bond, Ellis, Grant, Kruger and Kruger2015b) enable them to consume larger quantities of lower quality vegetation than ruminant herbivores (Duncan et al., Reference Duncan, Foose, Gordon, Gakahu and Lloyd1990; Cromsigt et al., Reference Cromsigt, Prins and Olff2009), whereas ruminant herbivores can digest high quality forage more effectively (Duncan et al., Reference Duncan, Foose, Gordon, Gakahu and Lloyd1990; Illius et al., Reference Illius, Duncan, Richard and Mesochina2002; Cromsigt et al., Reference Cromsigt, Prins and Olff2009). Archaeological records point toward a dominance of large-bodied ruminant and non-ruminant grazing species during the LGM on the PAP (Klein, Reference Klein1972, Reference Klein, Deacon, Hendey and Lambrechts1983; Klein and Cruz-Uribe, Reference Klein and Cruz-Uribe1991; Copeland et al., Reference Copeland, Cawthra, Fisher, Lee-Thorp, Cowling, Le Roux, Hodgkins and Marean2016; Hodgkins et al., Reference Hodgkins, Marean, Venter, Richardson, Roberts, Zech and Difford2020; Venter et al., Reference Venter, Brooke, Marean, Fritz and Helm2020), providing a stark contrast to what we see in the low nutrient fynbos ecosystem found along the coastline today (Venter et al., Reference Venter, Brooke, Marean, Fritz and Helm2020).
Although it is possible to identify the areas where the highest number of large herbivores were likely to occur, it remains difficult to know their exact densities. The size and management of protected areas in current landscapes strongly constrains the distribution, populations, and diversity of large herbivores. Understanding the MLHB of mammals of the PAP is essential to our understanding of the paleoecosystem. Large herbivores were an integral part of this system and provided food for predators and early humans, who regularly hunted on the PAP (Marean, Reference Marean1997; Marean et al., Reference Marean, Cawthra, Cowling, Esler, Fisher, Milewski, Potts, Singels, De Vynck, Allsopp, Colville and Verboom2014), especially during times when other resources, such as seafoods, may have been limited (i.e., highly seasonal resources; Marean Reference Marean2016). Additionally, large herbivores would have affected vegetation structure and composition (Archibald et al., Reference Archibald, Bond, Stock and Fairbanks2005; Levick et al., Reference Levick, Asner, Kennedy-Bowdoin and Knapp2009) and decreased fire regimes by removing flammable material and breaking up continuous vegetation cover (Archibald et al., Reference Archibald, Bond, Stock and Fairbanks2005).
Here, we aimed to estimate the MLHB within five predetermined functional groups (Hempson et al., Reference Hempson, Archibald and Bond2015a) on the PAP using the MLHB in South African protected areas. Hempson et al. (Reference Hempson, Archibald and Bond2015a) determined these five functional groups based on body mass, diet, digestive system (ruminant or non-ruminant), herd size, and water dependence because these characteristics are important in determining herbivore consumption and spatial aggregation. Using a functional group approach enables us to model similar species easily (rather than every species individually) and by using functional groups we are able to incorporate the extinct species. To improve our understanding of how drivers in current landscapes influence the LHB considered here, we investigate what drives the LHB in South African protected areas using a series of predictions (P) based on current management strategies for large herbivores. In South Africa, populations of large herbivores are managed in protected areas that are fenced (Newmark, Reference Newmark2008; Pekor et al., Reference Pekor, Miller, Flyman, Kasiki, Kesch, Miller, Uiseb, van der Merve and Lindsey2019) differ greatly in size, vegetation type, and rainfall. Prediction 1 (P1) is that small non-social browsers will not be influenced by biome, protected area size, or rainfall because they are selective for high quality food, not abundance, and have small home ranges. Prediction 2 (P2) is that medium-sized social mixed feeders will increase with increased rainfall in all biomes, but are unlikely to be affected by the protected area size because their home range is still relatively small compared to protected area size. Prediction 3 (P3) is that large browsers will increase with rainfall in all biomes, but be negatively affected by protected area size because of their need for large home ranges that will be affected by fencing in small, protected areas. Prediction 4 (P4) is that water-dependent grazers will increase with rainfall up to a threshold (600–800 mm) and thereafter decrease in savanna and grasslands, but not in thicket or fynbos because in savanna and grassland grass quality decreases with an increase in rainfall. They will also be negatively affected by protected area size. And prediction 5 (P5) is that non-ruminants will increase with an increase in rainfall on the PAP and will be negatively affected by protected area size because their need for large home ranges will be affected by fences in small, protected areas.
METHODS
Palaeo-Agulhas Plain Vegetation
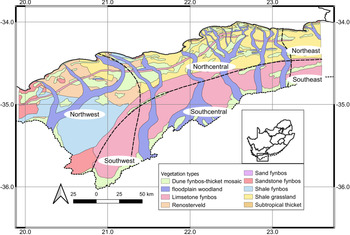
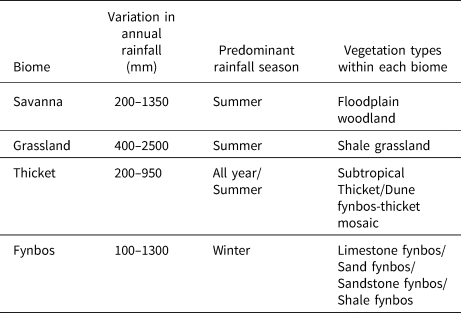
PAP vegetation types for the LGM were modeled using a ruleset validated against present day vegetation types and then hindcast to the PAP landscape using soil type (from underlying geology; Cawthra et al., Reference Cawthra, Cowling, Andò and Marean2020), mean annual precipitation, and seasonality of rainfall (Engelbrecht et al., Reference Engelbrecht, Marean, Cowling, Engelbrecht, Neumann, Scott, Nkoana and O'Neal2019). These vegetation types (Fig. 1) could be further classified into four biomes (Table 1): subtropical thicket (hereafter thicket), grassland, fynbos/renosterveld (hereafter fynbos), and azonal/savanna vegetation (hereafter savanna) (Cowling et al., Reference Cowling, Potts, Franklin and Marean2020). Detailed descriptions of individual vegetation units considered in Figure 1 can be found in Cowling et al. (Reference Cowling, Potts, Franklin and Marean2020). In this study, we only considered the biomes and not the individual vegetation types for simplicity and the ability to compare with extant environments. It is often impossible to distinguish between bioregions within biomes (i.e., fynbos bioregions and renosterveld) using rainfall (Bradshaw and Cowling, Reference Bradshaw, Cowling, Allsopp, Colville and Verboom2014). The rainfall gradient, ranging from predominantly winter rainfall in the west to all year and summer rainfall in the east, would also have resulted in predominantly C3 vegetation with sparse grass cover in the west shifting toward C4 vegetation with increased grass in the east (Faith and Behrensmeyer, Reference Faith and Behrensmeyer2013; Marean et al., Reference Marean, Cawthra, Cowling, Esler, Fisher, Milewski, Potts, Singels, De Vynck, Allsopp, Colville and Verboom2014; Copeland et al., Reference Copeland, Cawthra, Fisher, Lee-Thorp, Cowling, Le Roux, Hodgkins and Marean2016; Hodgkins et al., Reference Hodgkins, Marean, Venter, Richardson, Roberts, Zech and Difford2020).
(color online) Modeled vegetation of the offshore portion of the now submerged Palaeo-Agulhas Plain (Cowling et al., Reference Cowling, Potts, Franklin and Marean2020) showing the six distinct geographic zones (adapted from Marean et al., Reference Marean, Cowling and Franklin2020).

Variation and seasonality in rainfall for four South African biomes (Adapted from: Mucina and Rutherford, Reference Mucina and Rutherford2006) and Palaeo-Agulhas Plain vegetation types within each biome.

The models and fossil data show that the PAP presented a dramatically different habitat to the Cape Flora found in the southern Cape today. The PAP stretched from Cape Hangklip in the west to Port Elizabeth in the east on the current Agulhas Bank (Copeland et al., Reference Copeland, Cawthra, Fisher, Lee-Thorp, Cowling, Le Roux, Hodgkins and Marean2016; Cawthra et al., Reference Cawthra, Cowling, Andò and Marean2020). In this study, we did not consider the PAP west of Cape Hangklip because topographical barriers likely prevented movement of large herbivores for much of the time that the PAP was exposed (Venter et al., Reference Venter, Brooke, Marean, Fritz and Helm2020). Current fynbos ecosystems provide little suitable habitat for large mammals (Radloff et al., Reference Radloff, Mucina, Bond and le Roux2010). In contrast, the PAP environment would have been characterized by meandering rivers and associated floodplain woodlands intersecting the PAP in the form of woodland mosaics and fertile grasslands on alluvial soils (Cowling et al., Reference Cowling, Potts, Franklin and Marean2020). The floodplain woodlands (Cowling et al., Reference Cowling, Potts, Franklin and Marean2020) would have provided high quality habitat for a large number of large herbivores, many of which were grazers (Venter et al., Reference Venter, Brooke, Marean, Fritz and Helm2020) and would have had greater C4 grasses than we see in the region today (Cowling et al., Reference Cowling, Potts, Franklin and Marean2020; Hodgkins et al., Reference Hodgkins, Marean, Venter, Richardson, Roberts, Zech and Difford2020). The dominance of grazers is clearly shown through the archeological record for the PAP (Klein, Reference Klein, Deacon, Hendey and Lambrechts1983; Rector and Reed, Reference Rector and Reed2010; Sealy et al., Reference Sealy, Naidoo, Hare, Brunton and Faith2020; Venter et al., Reference Venter, Brooke, Marean, Fritz and Helm2020). Near to the current coastline, vegetation was dominated by grassland type ecosystems and, at its full extent, the seaward part of the PAP by fynbos type ecosystems (Cowling et al., Reference Cowling, Potts, Franklin and Marean2020). Cowling described nine vegetation types occurring offshore on the PAP (Fig. 1).
Palaeo-Agulhas Plain rainfall
PAP LGM rainfall has been both modeled and inferred from paleo-archive data. Variations in rainfall today on the PAP are apparent, with winter rainfall in the west of the PAP where more than 66% of the rainfall is received during the winter months (cf., Engelbrecht et al., Reference Engelbrecht, Marean, Cowling, Engelbrecht, Neumann, Scott, Nkoana and O'Neal2019), and likely showed similar trends during the LGM. In this western section, cool temperatures and a winter growing season for vegetation favor the growth of C3 species (including C3 grasses) (Vogel et al., Reference Vogel, Fuls and Ellis1978; Sealy et al., Reference Sealy, Naidoo, Hare, Brunton and Faith2020). An increase in C4 grasses toward the east becomes apparent through more positive δ13C in the grazers at Nelson Bay Cave (Sealy et al., Reference Sealy, Naidoo, Hare, Brunton and Faith2020).
Rainfall was modeled for southern Africa using eight different climate simulations. Climate simulations were limited in their application of representing climate due to the computational complexity, and were thus focused on ca. 21 ka, at the height of the LGM (Engelbrecht et al., Reference Engelbrecht, Marean, Cowling, Engelbrecht, Neumann, Scott, Nkoana and O'Neal2019). We used the average of the eight climate simulations to predict rainfall variability over the PAP (see Cowling et al., Reference Cowling, Potts, Franklin and Marean2020). The averaging of climate simulations was conducted in R (R Core Team, 2018) using the package ‘raster’ (Hijmans, Reference Hijmans2020). Rainfall for both the protected areas (Fig. 2) and the PAP sections (Fig. 1) was calculated at the reserve center (GPS coordinates in Supplementary Table 1). Seasonal rainfall was determined as the percentage winter rainfall that fell between the summer and winter rainfall models developed by (Engelbrecht et al., Reference Engelbrecht, Marean, Cowling, Engelbrecht, Neumann, Scott, Nkoana and O'Neal2019). Rainfall for protected areas was determined using the Atmospheric Model Intercomparison Project (AMIP) simulations, whereas the PAP rainfall was determined using the average of the eight LGM climate models (Engelbrecht et al., Reference Engelbrecht, Marean, Cowling, Engelbrecht, Neumann, Scott, Nkoana and O'Neal2019). Since the LGM, there has been relatively little change in rainfall (Luyt et al., Reference Luyt, Hare and Sealy2019; Sealy et al., Reference Sealy, Naidoo, Hare, Brunton and Faith2020), suggesting that the MLHB may be well represented by the MLHB found in extant ecosystems today. However, lower temperatures and reduced evaporation likely increased moisture availability across the PAP (Chevalier and Chase, Reference Chevalier and Chase2016).
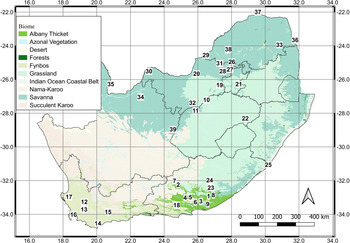
(color online) Locations of public and private protected areas used for the calculations of large herbivore biomass in South Africa. Protected areas are (1) Kwandwe Private Game Reserve, (2) Samara Private Game Reserve, (3) Shamwari Private Game Reserve, (4) Addo Elephant National Park (Darlington section), (5) Addo Elephant National Park (Kuzuko section), (6) Addo Elephant National Park (Main camp), (7) Camdeboo National Park, (8) Great Fish River Nature Reserve, (9) Thomas Baines Nature Reserve, (10) Wolwespruit Nature Reserve, (11) Bloemhofdam Nature Reserve, (12) Elandsberg Private Nature Reserve, (13) Krantzkop ammunition factory Nature Reserve, (14) Agulhas National Park, (15) Bontebok National Park, (16) Table Mountain National Park, (17) West Coast National Park, (18) Baviaanskloof World Heritage Site, (19) Boskopdam Nature Reserve, (20) Mafikeng nature Reserve, (21) Suikerbosrand Nature Reserve, (22) Golden Gate National Park, (23) Mpofu Nature Reserve, (24) Tsolwana Nature Reserve, (25) Mkambati Nature Reserve, (26) Borakalalo Nature Reserve, (27) Botsalano Nature Reserve, (28) Kgaswane Mountain Reserve, (29) Madikwe Nature Reserve, (30) Molopo Nature Reserve, (31) Pilansberg Nature Reserve, (32) SA Lombard Nature Reserve, (33) Greater Makalali Private Nature Reserve, (34) Tswalu Private Nature Reserve, (35) Kgalagadi National Park, (36) Kruger National Park, (37) Mapungubwe National Park, Marakele National Park, and (39) Mokala National Park.

Modern large mammal biomass
We compiled data on LHB from 39 public and private protected areas (Fig. 2) containing large mammal assemblages across four biomes and varying climatic conditions. There are 39 species of large herbivores that were used in our calculation of LHB (Table 2). These data are from nine protected areas in thicket vegetation, seven in fynbos vegetation, six in grassland vegetation, and 17 in savanna vegetation (Supplementary Table 1). From large mammal census counts in these protected areas, we averaged animal counts per species over the total number of census counts conducted (Supplementary Table 2) and then calculated the MLHB (cf., Coe et al., Reference Coe, Cumming and Phillipson1976; Fritz et al., Reference Fritz, Duncan, Gordon and Illius2002). MLHB is measured as the abundance of herbivores measured as W 0.75 kg/km2 where W is the actual large herbivore biomass. MLHB was then classified into five large mammal functional groups based on body size, diet, digestive system, herd size, and water dependency (Hempson et al., Reference Hempson, Archibald and Bond2015a), and MLHB/km2 was calculated by dividing MLHB by the size of the protected area. For each protected area, the predominant biome was determined by intersecting the reserve with the South African national vegetation map (Mucina and Rutherford, Reference Mucina and Rutherford2006) using QGIS v3.10.0v (QGIS Development Team, 2018). Different biomes were not considered within the same reserve due to the difficulty in differentiating large-mammal numbers for different biomes without spatially referenced census data. Additionally, in most protected areas, counts were conducted annually, which does not account for seasonal movement of large herbivores.
Species recorded from South African protected areas (private and public), species body mass (in kg), and associated functional group (Hempson et al., Reference Hempson, Archibald and Bond2015a).

Statistical analysis
To explore the MLHB for the PAP we intersected linear trend lines from general linear models (GLM) for each functional group per biome by rainfall of each for the six PAP sections (Fig. 1, Supplementary Table 3). For the functional groups medium-sized social mixed feeders and large browsers, we also included protected area size in the model, which was a significant driver (AICc weight = 1) in predicting MLHB in modern landscapes. Protected area size was multiplied by 10,000 (km2) to account for the small, protected areas in our sample size. At each point of intersection, we calculated the 95% confidence interval to determine the minimum and maximum MLHB that an area would be able to sustain at any given time. To determine what drives these relationships in a modern context, we fitted general linear models to our data for both the entire MLHB (per km2) and the MLHB for each functional group within a reserve. Then we explored the relationships between size of the protected area (km2), rainfall, percentage winter rainfall, and biome. Although soil quality is influential in predicting large mammal biomass, it was not included in this study because soil and underlying geology are also important in determining the delimitation of biomes in South Africa, and thus by considering biome we built-in the effect of soil. MLHB, rainfall, and protected area size were log transformed to account for the large amount of variation within the data, whereas the percentage winter rainfall was arcsine transformed. Model selection of the best-fitting model was carried out in R (R Core Team, 2018) using the ‘MuMIn’ package (Bartoń, Reference Bartoń2020), whereby an automated model selection was used across all combinations of explanatory variables and the best-fitting models (those with an AICc < 2) were averaged.
RESULTS
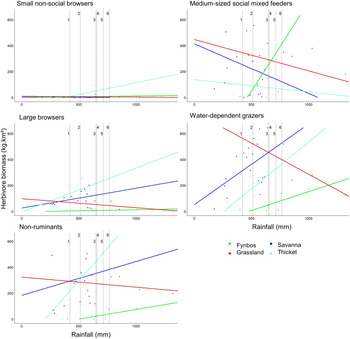
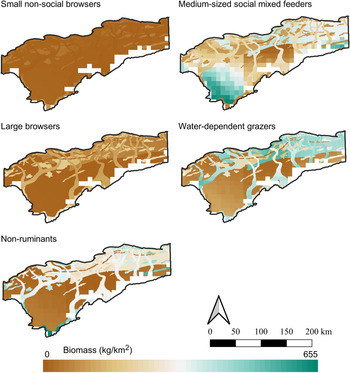
Mean annual rainfall for the centroids of the PAP sections varied from 766 mm in the southwest to 421 mm in the northcentral region (Engelbrecht et al., Reference Engelbrecht, Marean, Cowling, Engelbrecht, Neumann, Scott, Nkoana and O'Neal2019). In the fynbos biome on the PAP, herbivore biomass increased with an increase in rainfall irrespective of the functional group (Fig. 3). For savanna and thicket, herbivore biomass increased with an increase in rainfall in all functional groups, except medium-sized social mixed feeders. In grasslands, MLHB decreased with an increase in rainfall across all functional groups (Fig. 4, Supplementary Table 3). Changes in rainfall lead to a shift in herbivore densities, with the highest densities occurring in a small area on the southwest PAP for only the non-ruminants functional group along the LGM coastline. The overall highest densities occurred in the northcentral PAP for the water-dependent grazers functional group. The lowest densities occurred in the northcentral region where medium-sized social mixed feeders, large browsers, and non-ruminants are unlikely to occur in fynbos (Fig. 4, Supplementary Table 3).
(color online) Metabolic biomass of large mammals across a rainfall gradient for four prominent South African biomes. Vertical dashed lines represent average annual rainfall for the six sections of the Palaeo-Agulhas Plain. (1) Northcentral, (2) Southcentral, (3) Northeast, (4) Northwest, (5) Southeast, and (6) Southwest (functional groups adapted from Hempson et al., Reference Hempson, Archibald and Bond2015a).

(color online) The spatial distribution of the metabolic biomass of large herbivores within functional groups on the Palaeo-Agulhas Plain (PAP), South Africa during the last glacial maximum. Blank cells are areas where the climate model did not overlay the PAP.

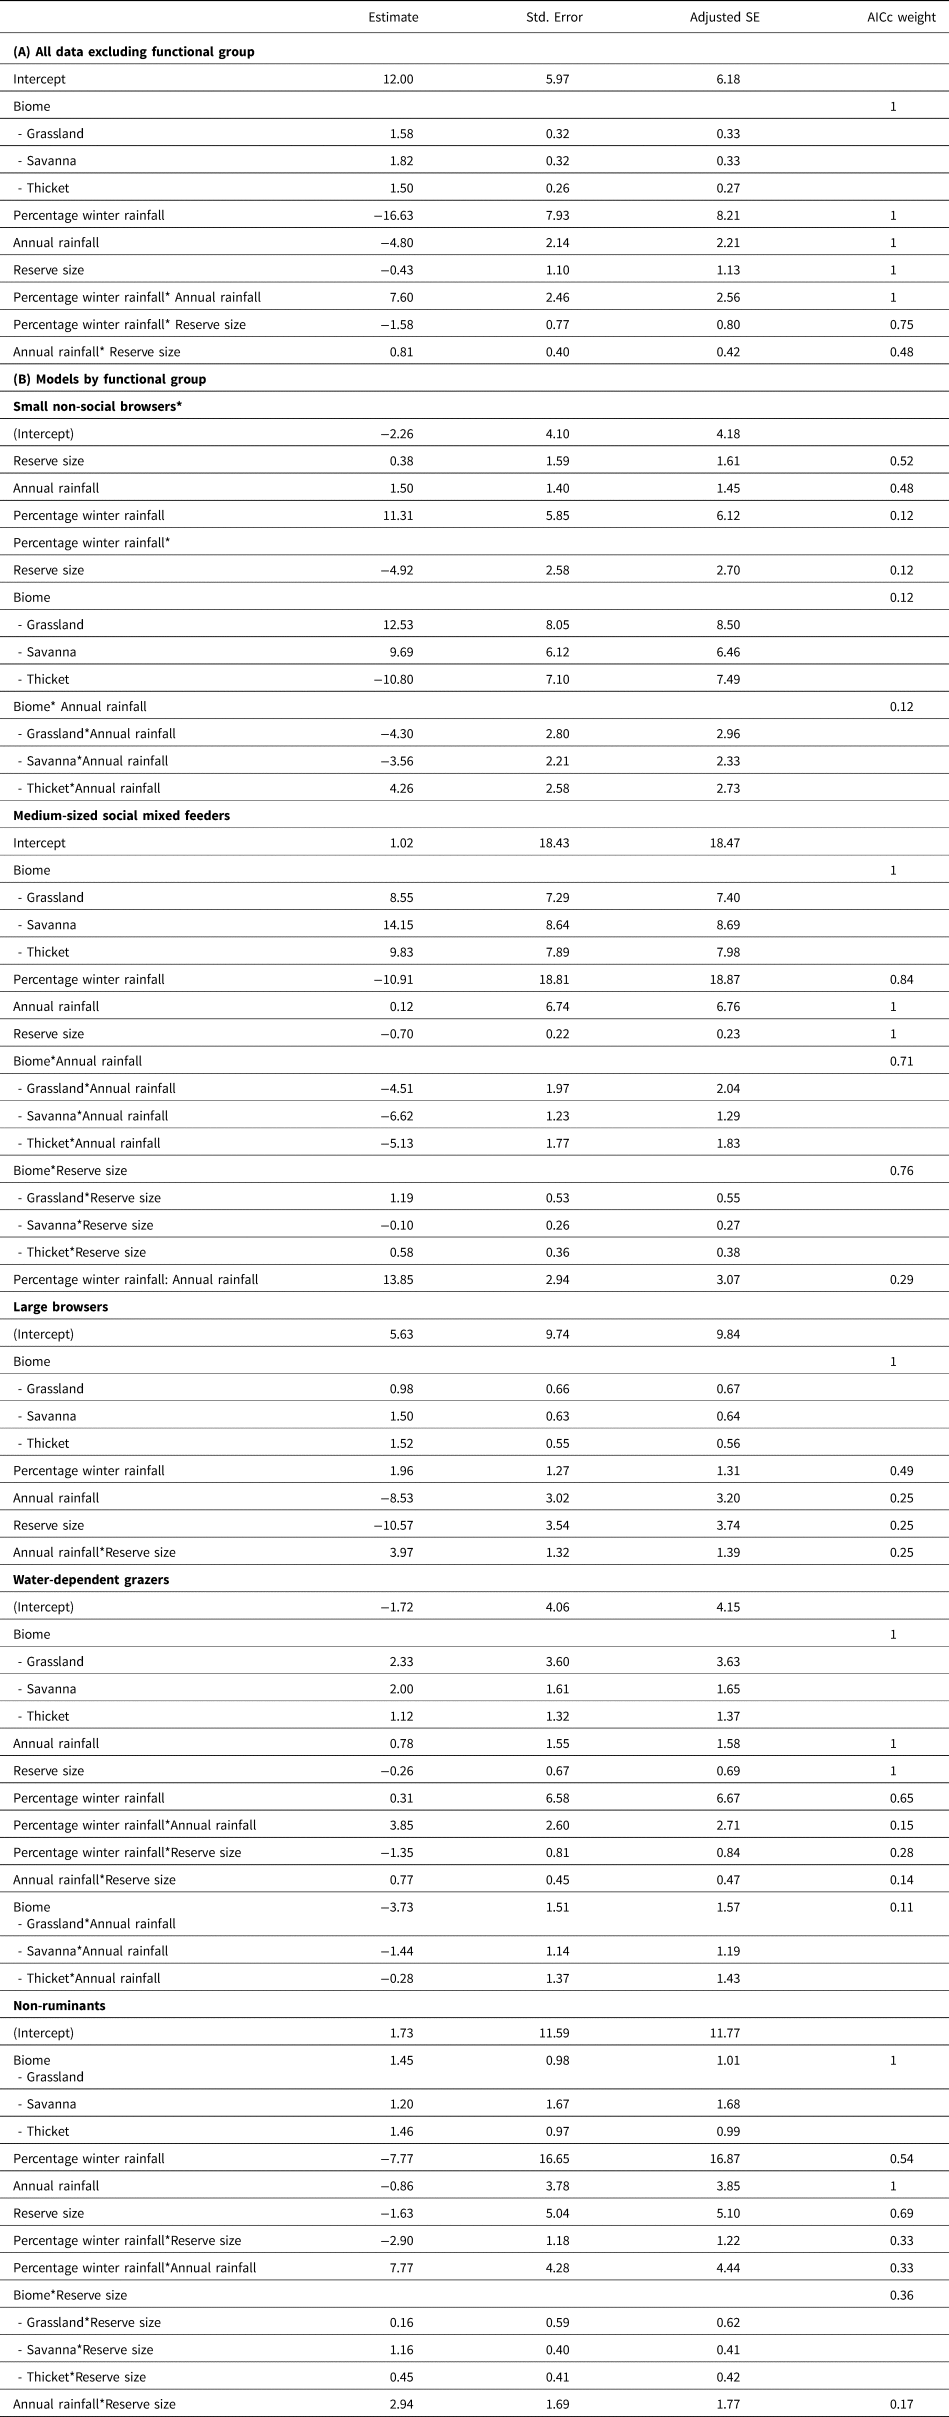
Model averaging resulted in the averaging of three models for the complete dataset (all data excluding the functional groups), six models for small non-social browsers, four models for medium-sized social mixed feeders, three models for large browsers, seven models for water-dependent grazers, and six models for non-ruminants (see Table 3 for a complete list of variables included in each model). In modern landscapes for the complete dataset, General Linear Models indicated that MLHB (independent of functional group) was significantly influenced by the biome where the protected area was situated (mostly grassland, thicket, and savanna differed from fynbos) and a complex relationship between the annual rainfall and the percentage winter rainfall (AICc weight = 1). The effect of reserve size also influenced the relationship between MLHB and rainfall (annual and winter), as indicated by the significant interactions (Table 3). Examining the predicted output from the model shows that MLHB generally increased with annual rainfall, except in grasslands, and decreased with percentage annual rainfall. Increased protected area size decreased MLHB/km2, except in savannas, and created more variability around the relationship between MLHB and annual rainfall (Supplementary Fig. 1). Therefore, controlling for reserve size is crucial when building these models.
Conditional averages of the General Linear Models (averaged from models with an AICc < 2), their associated coefficients, and AICc weighting within the averaged models. Models were run for (A) all herbivores (all data excluding functional group) and (B) herbivores within five different functional groups. In all cases, protected area size (reserve size), rainfall, and herbivore MLHB were log10 transformed, percentage winter rainfall was arcsine transformed, and biome was included in the model as a factor, and where the fynbos biome was included as a reference value. *Indicates the functional group where the NULL model was included in the model average.

For all functional groups, the percentage winter rainfall, annual rainfall, biome, and protected area size were important in predicting the MLHB (Table 3). The interaction between biome and annual rainfall was strongest for medium-sized social mixed feeders (AICc weight = 0.71), but also apparent in models for water-dependent grazers and small non-social browsers (AICc weights of 0.11 and 0.12, respectively). The differences in AICc weights suggest that the strength of the effects may be different, but mostly the results show that what differs the most are the slopes between biomes within each of the functional groups, as illustrated by the coefficients and regression lines (Table 3, Fig. 3), with savanna showing the strongest increase in MLHB with increased rainfall (Supplementary Fig. 1). The interaction between biome and protected area size was strongest for medium-sized social mixed feeders (AICc weight = 0.76), with fynbos having the most variation (Supplementary Fig. 1), and was apparent in non-ruminants (AICc weight = 0.36). The relationship between percentage winter rainfall and annual rainfall was apparent in the models for medium-sized social mixed feeders, water-dependent grazers, and non-ruminants (AICc weight = 0.29, 0.15, 0.33, respectively), however none was considered to have significant influence because their AICc weight was below 0.5. Similarly, the interaction between percentage winter rainfall and reserve size was retained in the models for small non-social browsers, water-dependent grazers, and non-ruminants, but were not considered to have a significant influence (AICc weight = 0.12, 0.28, 0.33, respectively). Another weak interaction, between annual rainfall and protected area size, was retained for large browsers, water-dependent grazers, and non-ruminants, also without significant influence (AICc weight = 0.25, 0.14, 0.17, respectively). Importantly, small non-social browsers were not significantly affected by any of the explanatory variables included in the model averages, as the Null model was also included for this functional group as the fourth model (AICc = 70.6), hence none of the variables could be said to exert a strong influence.
DISCUSSION
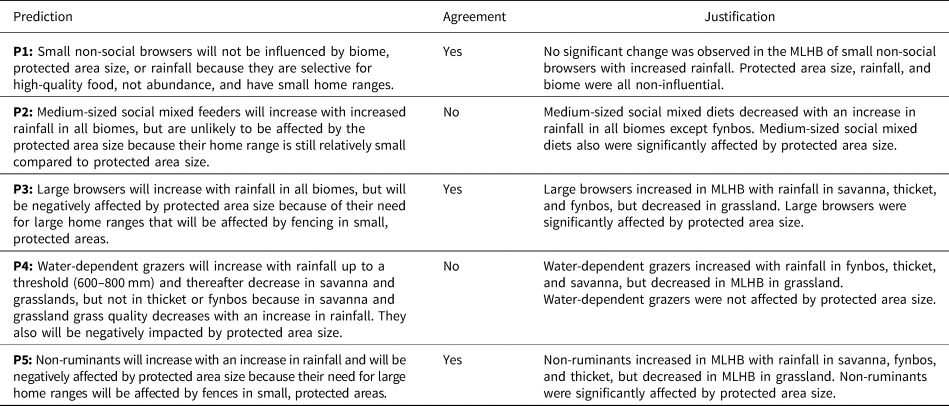
Most predictions indicate scenarios where MLHB increases with rainfall, except in grasslands where MLHB decreases with rainfall. This may be because the nutritional quality of grasses is lowest in high rainfall areas with infertile soils (Hopcraft et al., Reference Hopcraft, Olff and Sinclair2010). Low measured rainfall associated with thicket and savanna and the high measured rainfall for grassland resulted in the extensions of linear trends (positive for thicket and savanna and negative for grassland) farther than the natural variation of the protected areas considered in this study. In southern Africa, MLHB is most productive at intermediate biomass and rainfall (peak wildlife densities 750–1000 mm mean annual precipitation), with herbivore biomass decreasing with increased rainfall above this threshold (Prins and Olff, Reference Prins, Olff, Newbery, Prins and Brown1998; Hempson et al., Reference Hempson, Archibald and Bond2015a). It is conceivable that the lack of grassland samples below 612 mm excludes this lower threshold of grassland productivity, giving rise to the decreasing biomass with increased annual rainfall (contradicting P4, Table 4). It is also worth noting that the MLHB presented here is accurate for current climates and associated rainfall. The modeled rainfall used to predict MLHB for the PAP does not take into consideration the lower temperature and the possible higher water availability. We have presented MLHB accurate by today's standards and provide a good indication of PAP MLHB, but conservatively these may be better considered as ordinal scales, as we have described in the results.
Agreement and justification for the predictions of each of the five functional groups.

Drivers of functional group biomass
Small non-social browsers showed little change in MLHB (supporting P1). Small non-social browsers are limited by the quality rather than quantity of vegetation (Demment and Van Soest, Reference Demment and Van Soest1985; Hopcraft et al., Reference Hopcraft, Anderson, Pérez-Vila, Mayemba and Olff2012; Venter et al., Reference Venter, Vermeulen, Brooke, Gordon and Prins2019). The body size constraint hypothesis shows that because of their small size, small browsers have relatively high energy requirements (Demment and Van Soest, Reference Demment and Van Soest1985). These species are also generally territorial (Owen-Smith, Reference Owen-Smith1977; Estes, Reference Estes2012), and the number of small browsers is often regulated by the number of territories (limited to individuals or pairs and their offspring) within a habitat (Estes, Reference Estes2012). Our results support this, in that MLHB for small non-social browsers was always low and varied little with rainfall (Figs. 3, 4). Water requirements are met by the intake of forage (Hempson et al., Reference Hempson, Archibald and Bond2015a) and are not limited by the distribution of water within the landscape. Interestingly, small non-social browsers were not counted during the game censuses in a number of large (ranging from 30–19,483 km2, mean = 3606 km2) protected areas in savanna (n = 6); however, based on the above-mentioned regulatory factors for the biomass of small browsers, it is unlikely this would have affected the results significantly.
Medium-sized social mixed feeders showed the most variation in MLHB across biomes. These species are often associated with drier habitats (e.g., springbok; Antidorcas marsupialis) and shift between new grass growth during the growing season and browse during the dry season (Hempson et al., Reference Hempson, Archibald and Bond2015a). They are not restricted by the need to drink daily (Estes, Reference Estes2012) and are thus less limited by rainfall and the availability of water in the landscape. Medium-sized social mixed feeders are the only functional group of herbivores strongly associated with the southwest of the African sub-region (Hempson et al., Reference Hempson, Archibald and Bond2015a) and the associated PAP.
Large browsers, water-dependent grazers, and non-ruminants all showed similar trends increasing in fynbos, savanna, and thicket. These groups are characterized by species that are water dependent and gregarious to a certain extent (Hempson et al., Reference Hempson, Archibald and Bond2015a). However, Hempson et al. (Reference Hempson, Archibald and Bond2015a) predicted many species of water-dependent grazers would be associated with floodplain vegetation, but species strictly associated with floodplain woodland (e.g., Kobus sp.) were mostly absent from the PAP, with the exception of common reedbuck (Redunca arundinum), even though floodplain woodlands were abundant (Cowling et al., Reference Cowling, Potts, Franklin and Marean2020). Other water-dependent grazers were common on the PAP, but not limited by these habitats. All three functional groups were influenced by the relationship between rainfall and protected area size (supporting P3, P5, and Table 4). There was greater MLHB in large reserves with high rainfall. The biomass of non-ruminants was dominated by elephant, accounting for 50% of the MLHB in protected areas where elephants occurred (n = 10 protected areas). Of the sites examined here, elephants were only found in the thicket and savanna biomes (and represented 42% and 58% of the non-ruminant MLHB, respectively). The tendency for elephants to dominate MLHB is true throughout Africa (Hempson et al., Reference Hempson, Archibald and Bond2015a). Importantly, there is overwhelming evidence that although elephant and other megaherbivores are seldom found in grassland and fynbos biomes today, they may have been common in these biomes of the PAP during the LGM (Klein, Reference Klein, Deacon, Hendey and Lambrechts1983; Boshoff et al., Reference Boshoff, Kerley and Cowling2002; Kerley et al., Reference Kerley, Pressey, Cowling, Boshoff and Sims-Castley2003; Rector and Verrelli, Reference Rector and Verrelli2010; Helm et al., Reference Helm, Cawthra, Cowling, De Vynck, Lockley, Marean, Thesen and Venter2020; Venter et al., Reference Venter, Brooke, Marean, Fritz and Helm2020).
Effects of rainfall, biome, and protected area size
The effect of rainfall on MLHB is well known, but here we produce one of the first indications of how seasonality of rainfall affects large herbivores across biomes. Overall, the percentage winter rainfall affected the MLHB, resulting in a low MLHB in areas dominated by winter rainfall, but this had little effect at a biome level. In this study, biome absorbed much of the variation created by winter rainfall because winter rainfall areas fell within the fynbos biome (Bradshaw and Cowling, Reference Bradshaw, Cowling, Allsopp, Colville and Verboom2014). Thicket has year-round rainfall, whereas savanna and grassland are predominantly summer rainfall (Mucina and Rutherford, Reference Mucina and Rutherford2006). Biome was also a strong driver of MLHB because soil nutrient status mirrored biome. Biomes or areas within biomes with unpalatable vegetation are unable to sustain a high MLHB (Stalmans et al., Reference Stalmans, Witkowski and Balkwill2002; Radloff, Reference Radloff2008). This is particularly true for fynbos, where the habitat has been described as marginal at best for large herbivores (Radloff, Reference Radloff2008). Large rivers intersecting the PAP consisting of floodplain woodlands (Cowling et al., Reference Cowling, Potts, Franklin and Marean2020) on deep, neutral highly fertile loam soils (Cawthra et al., Reference Cawthra, Cowling, Andò and Marean2020) also may have partially negated the influence of rainfall and percentage winter rainfall on MLHB. These areas are thought to have been highly productive (productive vegetation dominated by grasses and sedges; Cowling et al., Reference Cowling, Potts, Franklin and Marean2020), and with water available year-round they may have acted as a refuge for species during times of resource limitation elsewhere (Hodgkins et al., Reference Hodgkins, Marean, Venter, Richardson, Roberts, Zech and Difford2020). The high water tables of floodplains provide deep rooted grasses with moisture, allowing them to produce nutrient rich green shoots throughout the dry season (Fryxell and Sinclair, Reference Fryxell and Sinclair1988; Fynn, Reference Fynn2012).
The size of protected areas in South Africa also varied with biome, with the smallest protected areas found in grasslands (mean = 181.5 km2) and fynbos (mean = 285 km2; excluding the Baviaanskloof world heritage site, which is unfenced), whereas the protected areas in savanna were far larger. Given that most protected areas in South Africa are fenced, herbivores are often intensely managed for specific outputs, such as ecotourism, hunting, and species breeding (Carruthers, Reference Carruthers2008). This intensive management may result in either abnormally high or low MLHB for some functional groups, although the tendency is to generate higher MLHB, as illustrated by the effect of protected area size in our analysis. Additionally, managing protected areas for ecotourism often results in larger numbers of water sources than would naturally be expected. Excess water points may benefit grazing and water-dependent species, but reduce the diversity of other species (Veldhuis et al., Reference Veldhuis, Kihwele, Cromsigt, Ogutu, Hopcraft, Owen-Smith and Olff2019).
In addition to protected area size, there were other factors affecting large herbivores that were not included in this study. These were predation, vegetation density, fire, and human interference (i.e., how intensively were populations managed). Using simple abundance data from game censuses, we were limited in our knowledge of the underlying mechanisms that vary across protected areas in South Africa. For instance, in small herbivore populations and protected areas without predators, the management of herbivores can be more intensive with regular offtake of animals or input from other populations (Bothma, Reference Bothma, Bothma and du Toit2010). Fire is also regularly used (and is essential to fynbos, savanna, and grassland systems) to manipulate vegetation and provide new high-quality forage for herbivores (Levick et al., Reference Levick, Asner, Kennedy-Bowdoin and Knapp2009; Kraaij and Novellie, Reference Kraaij and Novellie2010). Indeed, the PAP was also subject to frequent fire (Kraaij et al., Reference Kraaij, Engelbrecht, Franklin and Cowling2020) that may have occasionally shifted some areas into a more palatable state. The density of vegetation can affect herbivores through both interactions with predators and availability of suitable forage (Hopcraft et al., Reference Hopcraft, Olff and Sinclair2010). By looking at numerous protected areas we hoped to overcome many of these caveats by averaging the LHB across numerous reserves varying in size, predator abundance, and management style across the selected biomes.
CONCLUSION
The MLHB is influenced by rainfall, increasing in savanna, thicket, and fynbos but decreasing in grasslands. The MLHB decrease in grasslands is expected because our samples are all derived from areas with high rainfall (annual mean of 758 mm), and modern studies indicate that MHLB increases up to a rainfall threshold and declines thereafter. The use of modern data as analogies for the PAP brings in complexities that also need to be considered as factors (e.g., climate differed during the LGM). Aside from rainfall, we have also shown that biome is essential in predicting MLHB because it incorporates factors such as percentage winter rainfall, soil type, and protected area size. The management of protected areas in South Africa also influences the species in an area.
This research gives us the first insight into the MLBH that the PAP could sustain across the different regions and biomes with high MLHB of water-dependent grazers in the north and on the floodplain woodlands. Non-ruminants were at their highest MLHB in the high rainfall thicket of the southwest PAP and the highest MLHB of medium-sized social mixed feeders occurring in the southwest of the PAP. Small non-social browsers and large browsers maintained relatively low MLHB throughout the PAP when compared to the other functional groups. Understanding the MLHB is an essential first step in understanding how early humans used large mammals as a food resource on the PAP. Additionally, and useful to current studies of MLHB, our prediction of MLHB across four major biomes in South Africa can be used to understand distribution of herbivores within different functional groups.
Supplementary Material
The supplementary material for this article can be found at https://doi.org/10.1017/qua.2021.23
Acknowledgments
We thank Alastair Potts and Claudine Gravel-Miguel for supplying vegetation and rainfall data for the Palaeo-Agulhas Plain during the LGM. The Eastern Cape Parks and Tourism Agency, North West Parksboard, South African National Parks, and Tswalu Kalahari Reserve for supplied game census data. The African Centre for Coastal Palaeoscience and Nelson Mandela University funded this study. Anonymous reviewers are thanked for their valuable comments that enabled improvement of this manuscript.