

1. Introduction
The protectionist agricultural policies in industrial countries are often criticized for depriving citizens and farmers in the world's poorer countries from benefiting from world trade. International agencies, NGOs, and the media vehemently advocate the embracing of free trade policies by developed countries (Panagariya, Reference Panagariya2005). This is because most studies to evaluate the impact of trade liberalization in agriculture have focused on advanced countries and agricultural products like wheat, sugar, bovine meat, and milk products. These products are produced in both developed and developing countries (hereafter DCs); they face high protection in developed countries because of the interests of their domestic producers. No doubt, this has a direct effect on farm incomes in DCs in terms of lost agricultural and agro-industrial income.
However, the high protectionism in agriculture in developed countries should not distract attention from protectionism in agriculture in DCs. This is particularly important for agricultural products that are essentially produced in DCs and play a significant role in their exports, sometimes classified as tropical agricultural products. These products, or at least most of them, are neither threatened by competition from advanced countries nor do they face trade barriers in those countries. On the other hand, they are most frequently subject to high trade barriers in DCs.
This paper examines how DCs trade barriers in agriculture hurts DCs. The paper is organized as follows. Sections 2 and 3 review the distortions in world trade in agriculture and the potential welfare gains from their removal. Section 4 looks at trade restrictions faced by DCs on their exports of selected tropical agricultural products, while Section 5 analyzes the consequences for DCs from their removal. Section 6 concludes and raises specific policy issues.
2. Trade distortions in agriculture
The volume of world agricultural exports has expanded over recent decades, but the rate of growth has been lower relative to that of other traded products. This has resulted in a steady decline in agriculture's share in world merchandise trade from 28% in 1960 to 8.8% in 2004. Not only has world trade in agricultural products grown slower than general trade, DCs have not been able to capture as large a share of the growth. Their share in total world agricultural exports has been decreasing steadily over time, from around 40% in 1960 to around 30% in 2004 (Binswanger and Lutz, Reference Binswanger and Lutz1999; WITS, 2006).
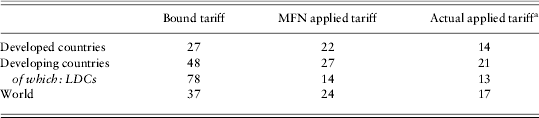
Why have DCs failed to keep or increase their share in world agricultural exports? The reasons for this can be many, but the main blame for DCs poor performance in agricultural exports is apportioned to high protectionism in agriculture. There has been a proliferation of impediments to agricultural trade in both developed and developing economies. Over the past half-century tariffs on manufactured goods have dropped from an average of 40% to 4%, while agriculture tariffs remain high, evident from the MFN applied tariffs in Table 1. Agriculture also suffers from tariff escalation, which is systematically practiced in many countries and for many agricultural products.Footnote 1
Agricultural weighted average (weights based on imports) import tariffs, by region, 2001, per cent
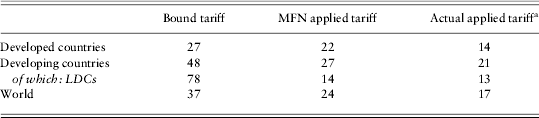
Note: a Includes preferences and in-quota TRQ rates where relevant, as well as the ad valorem equivalent of specific tariffs.
Source: Jean et al. (Reference Jean, Laborde, Martin, Anderson and Martin2005: table 4.2) in Anderson and Martin (Reference Anderson and Martin2005: table 2). Developed countries include Europe's transition economies that joined the EU in April 2004. The developing countries definition used here is that adopted by the WTO and includes East Asia's four newly industrialized tiger economies. Developed countries include Europe's transition economies that joined the EU in April 2004. The developing countries definition used here is that adopted by the WTO and includes East Asia's four newly industrialized tiger economies.
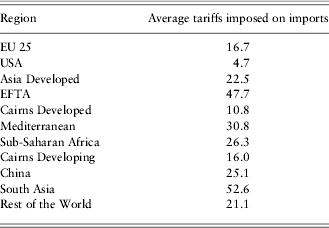
Bouet et al. (Reference Bouet, Bureau, Decreux and Jean2005) rely on original work to measure average tariffs at a bilateral level, for closely related regions, for an aggregate of all agricultural products taking into account applied tariffs, tariff quotas (based on the in or out of quota tariff, depending on which one is binding), free trade areas and preferential regimes for each product. They do not consider tariffs on intra-regional trade; they feel this will not bias the figures because most regions include countries linked by Regional Trade Agreements.Footnote 2
Table 2 shows the average tariff imposed by each region. In terms of average tariff rates, the developing regions protect more than the developed ones, exception being the Cairns Group of DCs, which have a strong comparative advantage in agriculture, and the developed EFTA countries because of their special location–climatic conditions.Footnote 3
Bilateral tariff, all agricultural products aggregate, 2001, per cent
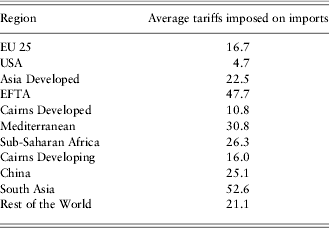
Source: Summarized from Bouet et al. (Reference Bouet, Bureau, Decreux and Jean2005: table 1).
According to Aksoy and Beghin (Reference Aksoy and Beghin2004), the low average tariffs in developed countries compared to DCs can be misleading when it comes to estimating the real degree of protection given to local producers. This is because average tariffs measure protection on all agricultural commodities, including products that are not produced domestically. Rich countries import a variety of differentiated products, many of those that do not compete with domestic production have low or nil tariff rates, but tariff rates peaks on key domestically produced products, implying a higher level of real protection for domestic producers than that stated by the average tariff. The reverse appears to be true for most DCs, they seem to protect commodities that are not produced locally more than commodities that are (Aksoy and Beghin, Reference Aksoy and Beghin2004).
Furthermore, the farming sector in the developed world is able to wring remarkably generous levels of financial support, by way of export subsidies and domestic support measures, out of their governments. Within OECD countries, producer support in agriculture was about $230 billion in 2000–2002, or almost 46% of production value (evaluated at world prices). The bulk of the support went to products such as milk, meats, grains, and sugar (OECD, 2005a).
OECD (2006) calculates Producer Support Estimate (PSE) as a measure of overall protection provided to agriculture.Footnote 4 Figures in parentheses show the percentage PSE, average 2000–2003, of selected countries: EU (34), US (20), Japan (58), China (6), Australia (4), and Brazil (4). The high PSE values show the level of protection afforded to agriculture in developed countries; that for Australia is low because its producers do not require protecting, being a competitive exporter of most agricultural products. China and Brazil also have a low PSE, though their average tariffs are higher because of tariffs imposed on agricultural products that are not produced locally.
Finally, agriculture has also been plagued by the use of non-tariff restrictions such as import bans and licenses. Looking at the non-tariff barriers that remain in developed countries, it is evident that the objective is to protect not domestic producers but to honor the various non-reciprocal preferential agreements linked to level of economic development or location criteria; for example the EU's Lome/Cotonou and the Everything But Arms agreements, and the US's Africa Growth Opportunity Act and the Caribbean Basin Economic Recovery Act (OECD, Reference Panagariya2005b).
3. Agricultural trade liberalization: welfare effects
Several recent studies, based on simulations with Computable General Equilibrium and GTAP models of the global economy, analyze the potential welfare effects of agricultural trade liberalization on different sectors, countries and regions.Footnote 5 The models have several limitations. They assume perfect competition; do not incorporate existence of high level of unemployment and absence of risk markets. The model results are highly sensitive to assumptions about elasticities of supply and demand. The underlying assumptions of the model do not provide a good description of the economies of DCs (Stiglitz and Charlton, Reference Stiglitz and Charlton2004). The model results are presented not because they provide accurate assessments of the costs and benefits of trade liberalization, but because they call attention to key points.
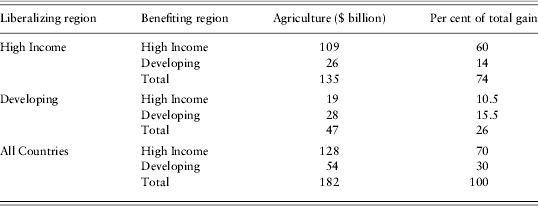
According to Anderson et al. (Reference Anderson, Martin, van der Mensbrugghe, Anderson and Martin2005), freeing all merchandise trade and agricultural subsidies is estimated to boost global welfare by nearly $287 billion per year by 2015, plus whatever productivity effect that reform would generate.Footnote 6 It is in agriculture that the gains are by far the greatest, 63% ($182 billion) of the global gains (Table 3).Footnote 7 This is remarkable, because agriculture accounts for only about 9% of the global merchandise trade and 4% of global GDP, though consistent with the high levels of trade distortions in agriculture compared to other sectors. Most of the gains accrue to the liberalizing regions themselves: for high income countries 85% of the gains come from reforms of their own policies, while for developing regions this figure is 52%.
Regional and sectoral gains to real income from full liberalization of global merchandise trade, 2015 (relative to 2001 baseline scenario)
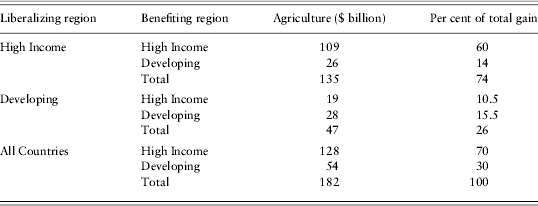
Source: Summarized from Anderson et al. (Reference Anderson, Martin, van der Mensbrugghe, Anderson and Martin2005). No account is taken in these calculations of the welfare effects of environmental changes associated with trade liberalization, which could be positive or negative depending in part on how environmental policies are adjusted following trade reforms.
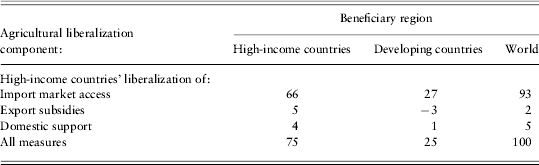
Hertel and Keeney (Reference Hertel, Keeney, Anderson and Martin2005) also find that the main beneficiaries of high-income countries' agricultural liberalization are the high-income countries themselves (Table 4). Furthermore, most of the benefits are from improved import market access, mainly from removal of agricultural tariffs. This implies that the welfare gains for DCs from those negotiating areas (subsidies and domestic support in developed countries) that consume considerable attention of many developing trade negotiators and the media are estimated to be very much smaller than what is commonly perceived. Nonetheless, for some products, most notably sugar and cotton, reducing subsidies by certain developed economies is crucial for many DCs (Anderson et al., Reference Anderson, Martin, van der Mensbrugghe, Anderson and Martin2005).
Distribution of global welfare impacts of fully removing agricultural tariffs and subsidies, 2001, per cent
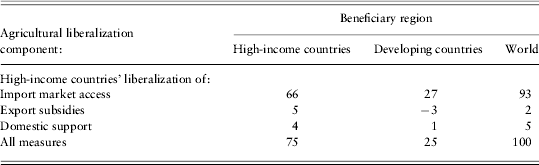
Source: Summarized from Hertel and Keeney (Reference Hertel, Keeney, Anderson and Martin2005, table 2.7). High-income countries include the newly industrialized East Asian customs territories of Hong-Kong, Korea, Singapore and Taiwan as well as Europe's transition economies that joined the EU in April 2004.
Bouet et al. (Reference Bouet, Bureau, Decreux and Jean2005) believe that many assessments of trade liberalization using these models have led to questionable conclusions about the impact of agricultural trade liberalization for DCs. The models do not make a distinction between net agricultural importing and net agricultural exporting countries. Valdes and McCalla (Reference Valdes, McCalla, Ingco and Winters2004) study of agricultural imports and exports of DCs over the period 1995–1997 concludes that only 43% of DCs were net agricultural exporters, the remaining 57% being net importers. Not all net importers have the capacity to significantly increase their production and exports, should unfair competition or subsidies be eliminated. In such cases, liberalization will mainly increase their agricultural import bill. Additionally, the models do not fully account for the implications of erosion of preferential arrangements in the agricultural sector; some DCs might lose some of their markets to the benefit of developed or other DCs.
Bouet et al. (Reference Bouet, Bureau, Decreux and Jean2005) take these factors into consideration; their simulations of the impact of liberalization suggest smaller welfare gains for DCs. The main driving force of an increase in exports is the decrease in tariffs. In terms of welfare, the main winners are developed countries that reduce their own distorting support. The effects on DCs will be contrasted, depending on the composition and the price sensitivity of their exports and imports to liberalization. Some groups of countries are more likely to suffer than to benefit from multilateral trade liberalization.
However, the existence of net losses for DCs in some areas of reform should not imply that no reform is required, rather it highlights the need for a more selective approach. DCs should focus their attention on the elimination of tariffs and quotas on goods produced primarily by DCs (wherever they may be consumed). The most important subsidies to eliminate would be on commodities that compete with DCs and which are not consumed extensively by DCs, or where the effect of liberalization on prices paid by consumers in DCs is likely to be small. For example, elimination of cotton subsidies would raise producer prices for cotton, but have a small effect on standards of living in DCs as a result of the small increase in the price of cloth.
Bouet et al. (Reference Bouet, Bureau, Decreux and Jean2005) do not consider trade between countries within each region, and tariffs on intra-regional trade are assumed to be zero. The assumption is not valid across all regions. Many developing regions have largely remained outside the phenomenon of intra-regional liberalization: neither African nor Asian regional integration has been very convincing (Bureau et al., Reference Bureau, Jean and Matthews2006). This reduces the assessed impact of liberalization, because the benefits reaped to a region from lowering intra-region trade distortions are not taken into account.
A common message that emerges from the highly restrictive studies is that agricultural trade reform by DCs is just as important economically to those countries as is reform by developed countries. Also, there is need for agricultural trade reform negotiations to differentiate more between countries and products.
4. Trade in tropical agricultural products
Although the studies in Section 3 highlight the benefits for DCs from their own agricultural reform, the aggregate nature of analyses do not provide convincing policy guidance for developing policy makers. We, therefore, examine the consequences for DCs of agricultural trade liberalization at the disaggregated product level; we choose products that are predominantly produced in DCs and constitute a very large share of their exports. This means that the benefits from increases in their trade would largely accrue to DCs.
Agricultural products are sometimes divided into two groups: tropical and temperate zone products. Tropical products are predominantly produced in DCs, while temperate products are produced in developed countries as well. Tropical products include tropical beverages (tea, coffee, cocoa); plant based fibers (cotton, jute, sisal); certain oilseeds, vegetable oils (castor, palm, coconut, some minor seeds, oils, and oil cakes), and soybeans; tropical fruits (bananas, pineapples, mangoes, guavas), and roots (manioc), certain vegetables, nuts, and flowers; natural rubber, gums, and raw sugar (cane); and tropical wood, spices, and essential oils. Temperate products comprise of commodities such as paddy rice, wheat, cereal grains, oilseeds, and raw sugar (beet); and livestock, wool, animal products, meat, and dairy. The lists are neither comprehensive nor established, for example, cotton and raw sugar are not exclusively produced in DCs.
Dimaranan et al. (Reference Dimaranan, Hertel and Keeney2003) work out the average trade specialization indices for several countries and regions over the course of three decades (1965–1975, 1976–1985, and 1986–1998).Footnote 8 Their results show a division between temperate products where DCs are largely net importers and developed countries that are largely net exporters, and tropical products for which DCs are largely net exporters.
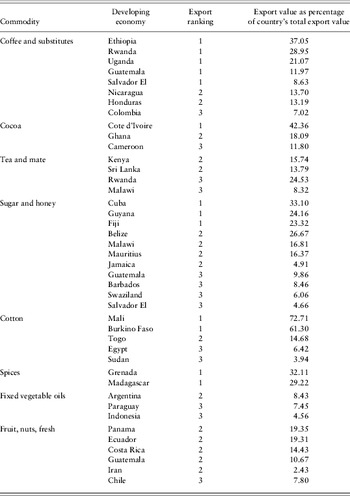
Table 5 presents information on selected tropical products or product groups that enjoy first to third highest export shares in the country's total exports. The products are vital foreign exchange earners for many DCs, at times, constituting more than 30% of their total export earnings. Coffee, for example, is the developing world's second biggest trading commodity after petroleum.Footnote 9 In that sense, it is of immediate relevance to them in the WTO negotiations.
Export structure of selected commodities (at the SITC Revision Group, 3 digit, level), average 2002–2003 values
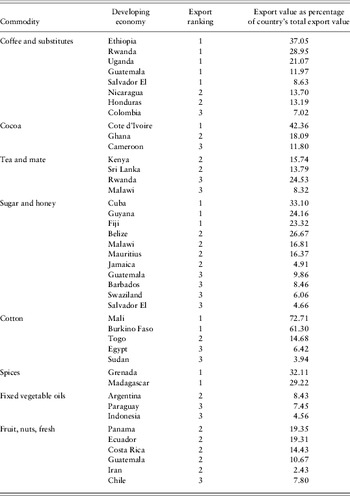
Source: Summarized from UNCTAD (2005, table 4.2D).
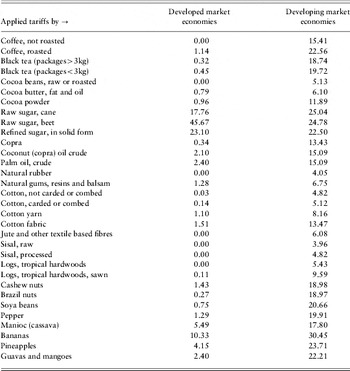
The barriers that exist on trade in tropical products are important to understand, because they can influence the weight of effort trade negotiators put into liberalizing trade. Table 6 reports the applied tariff rates faced by selected tropical products; the list does not exactly match that of Table 5, as the data source is different and the products are reported at different levels of aggregation.
Applied import tariffs on developing export of selected tropical products, per cent
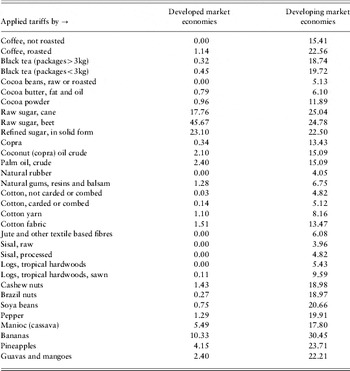
Source: MacMap (June 2006), includes ad valorem equivalent of specific tariffs and preferences where relevant. The figures indicate the weighted average percentage tariff using weights based on imports (corrected for the well known ‘endogeneity bias’).
The products face low tariff and tariff escalation in developed economies, exceptions being sugar and bananas. The high rate for sugar is in order to protect domestic raw sugar (beet) production and refined sugar processing capacity, while that for bananas is to honor non-reciprocal preferential commitments. The rates for primary tropical products such as cocoa, coffee, tea, rubber, jute, cotton, and soybeans are nearly 0%. In addition to low tariffs, these products generally do not attract high subsidies and financial support. The products that do enjoy support in certain developed economies are sugar and cotton.
In contrast, DCs impose substantial tariffs and tariff escalation on these products. The motive for this is not only to protect domestic producers and the domestic processing industry, but to also earn revenue for the government and restrict imports to save valuable foreign exchange. In addition to tariffs, countries also regulate entry by imposing non-transparent import taxes and a multiplicity of bureaucratic obstacles, such as import licensing or canalizing through state agencies (Bureau et al., Reference Bureau, Jean and Matthews2006).
Table 6 tariff averages obscure large variations across countries within a region. Developed economies with high tariffs (in per cent) include Japan (roast coffee 9.83, tea 9.72, packed tea 17.08, cane sugar outside-quota tariff 116, bananas and pineapples 17 to 23 on a seasonal basis); UK (cane sugar 32.92); Russia (tea 20, sugar all kinds 87.96); USA (cotton 11.44 to 13.73). Those in developing economies include China (sugar 52, cotton 40, rubber 20); India (coffee and tea 99.44, cocoa 29.83, rubber 69.34, palm and coconut oil 98, sugar 98.36); Pakistan (coconut oil 29.96, palm oil 33.39); Iran (tea 35, sugar 70, refined sugar 110, cotton 20); Bangladesh (tea, coffee and cocoa 32.5), Vietnam (tea and coffee 47.8), Sri Lanka (coffee, tea and cocoa 27.97) (MaCMap, 2006).
5. Liberalization: consequences for developing export
A movement towards freer trade in tropical products is expected to raise their international imports and consumption, with knock-on effects on production, exports and prices. A perspective of the impact can be visualized from individual commodity studies.
An FAO (1995a) study on tea concludes that import demand is unlikely to change in developed countries because no, or only slight, restrictions are imposed on trade in tea. As such only demographic and cultural factors can influence consumption in any major way. A feature of the world tea economy since the 1990s has been that increase in the volume of export has mainly been to DCs, to a large extent because of the growing population; growth in income has also contributed. A cut in tariffs, other levies and restrictions on tea imports are likely to stimulate consumption and imports in DCs because price elasticity of demand is high in many of these countries. A 20% reduction in duties can be anticipated to increase consumption by an average of 5% on these grounds alone (FAO, 1995b).
These also hold for some tea producing countries. For example, domestic tea prices in India could fall because of imports of cheaper teas, at low or nil duty, from other origins such as Indonesia, Mauritius, Nepal, and Africa. The current consumption per head of tea in India is only 0.7 kg per annum (over 3 kg for the UK). The availability of low-price teas can be expected to induce higher consumption at the lower end of the market. Similarly, liberalization of tea imports by China would increase its black tea imports (FAO, 1999).
Therefore, faster liberalization of the tea trade by developing economies would better serve the interests of their low-cost tea producers. We can expect, more or less, similar implications of liberalization in trade for other tropical products. The high tariffs on them in DCs hold back their exports in DCs. Different developing economies enjoy a comparative advantage in one or other products, so reform as a group would confer mutual gains from trade in them to all trading partners, and should be in their overall interest. This means each country can better exploit its comparative advantage to the benefit of their producers and consumers.
Scope clearly exists for developing exporting and importing countries to negotiate for trade barriers to be lowered; this way most will become larger exporters and importers of selected agricultural products. For example, if India or China benefit from reform in other DCs, their own reform represents a large market as well for the reforming countries. DCs have, therefore, a strong vested interest in working together to push simultaneously for the freeing up of their trade in tropical products.
Among tropical products, sugar, cotton, and bananas deserve special treatment, as they also face high rates of protection in developed economies, and developing low-cost producers are potential gainers from its lowering. In sugar, OECD support for domestic producers amounted to about $5.2 billion in 2002, roughly the value of developing sugar exports. The worst offenders were the EU, the US, and Japan, providing annual support of $2.45 billion, $1.18 billion, and $0.30 billion, respectively (OECD, 2005a). Such high protection has converted the EU, a natural importer of sugar, to a net exporter and has reduced sugar imports to the US and Japan to a fraction of free trade levels. It is estimated that a move to free trade in sugar would raise its world prices by something close to 40% and increase its world trade by 20%. Protectionist OECD countries would experience a significant contraction in production and import expansion or export reduction, while competitive producers in both OECD countries (Australia) and non-OECD countries (such as Brazil, Cuba, Argentina, Colombia, Thailand, and South Africa) would expand production and net exports (Elobeid and Beghin, Reference Elobeid and J.2005).
In cotton, subsidies to growers in the US and the EU (Greece and Spain) during the 2001–2002 season totaled $3.7 billion and over $0.7 billion, respectively. They are extremely high subsidies in a market in which production in the season was valued at $20 billion. If support was removed completely, the US and the EU would reduce production by 7–10% and world prices could go up by 10% (Aksoy and Beghin, Reference Aksoy and Beghin2004). A later study by Anderson et al. (Reference Anderson, Martin and Valenzula2006) concludes that under full trade and subsidy liberalization by developed economies, the value of their exports would fall by $3.6 billion (mostly in the US).Footnote 10 DCs output and exports of cotton would expand by about the same amounts, with Sub-Saharan Africa and Latin America enjoying most of that gain. The share of developing economies in global cotton export would be 85% instead of 56% in 2015.
In bananas, the EU imposes strict quotas and high outside-quota tariffs (around 64%), while allowing free access to a handful of small African, Caribbean, and Pacific countries. There is also domestic support (around 42%) for EU producers.Footnote 11 This policy has stalled growth in consumption and imports in the EU. Japan also protects its domestic producers by imposing tariff on a seasonal basis. A move towards free trade would benefit efficient producers in Latin America and other DCs (Borrell and Bauer, Reference Borrell and Bauer2004).
The impact of developed country trade liberalization in sugar, cotton, and bananas will vary across DCs. Clearly, developing low-cost producers will benefit from the opening up of new markets. It also eases the pressure in developing economies to provide ‘reactive’ protection (support) to their competing producers. Some DCs are net importers of these products; they might face higher import bills because of increase in their world prices. This applies mainly to sugar importers, as the increases in the prices for cotton (cloth) and bananas are relatively small. The impact on consumers depends on changes in consumer prices, which may not rise significantly if import and domestic controls on sugar sales are reduced. Aksoy and Beghin (Reference Aksoy and Beghin2004) feel that consumer prices for sugar are not likely to rise, since even competitive producers in almost all DCs cover their export losses with higher-price domestic sales. Some DCs enjoy preferential access to developed markets (in sugar and bananas); they might be worse off because of loss in quota rents, though the loss to their quota holders, many of them high-cost producers, would be much smaller because of the world price increases.
It is therefore quite likely that DCs will benefit unevenly from their liberalization in trade in tropical products and that of developed countries in sugar, cotton, and bananas. A minority of them may possibly experience a higher import bill because of the widening of gap between their imports and exports, or they may lose part of their export market because of erosion of preferences. This need not necessarily imply a loss, because the welfare consequences of trade and the efficiency gains from liberalization depend on several inter-related factors. Nevertheless, the fact that some countries may lose is not a justification for DCs continuing to impose high trade barriers among themselves, and that too on products in which they do not face competition from the developed world. It is also not a justification for certain developed countries to extend high rates of protection in sugar, cotton, and bananas at the cost of competitive developing low-cost producers. What may be desirable is to explore for ways to compensate the minority of countries for the negative consequences (losses) from liberalization.
6. Conclusions and policy implications
The developing community would do well in accepting that it is wrong to think that agricultural protection is primarily a developed country problem, and that opening just the developed country markets will be enough to solve their problems of development. If DCs want to maximize their benefits, they need also to free up their own agricultural markets, so their producers are better able to take advantage of new market-opening opportunities in the developing world.
This is particularly true for tropical products, which are predominantly produced in DCs and constitute a large share of their exports. The barriers on trade in tropical products suggest that growth in their consumption and imports is constrained largely because of trade barriers in DCs. The benefits to be had from their lowering appear to be large, as it is seen to add considerably to the export potential of DCs. This highlights the importance of ensuring that their free trade is high on the agenda of developing trade negotiators.
The developing world would do well in treating tropical products trade liberalization as distinct from trade liberalization of other agricultural products, because this is an area where the South must fend for themselves, through expansion of their mutual trade, rather than depend on the North. Therefore, it is in their interest to lower tariffs on these products, and if their trade also suffers from non-tariff import restrictions, it requires also stronger disciplines on that front. Sugar, cotton, and bananas are products of significant interest for DCs that face protectionism in certain developed countries. As far as they are concerned, the optimal approach would be to hold specific negotiations with the North to reduce barriers on their trade as part of the Doha Round.
It should be stressed that none of the analysis suggests disciplining developed countries agricultural trade barriers and reducing agricultural subsidies is unimportant. To the contrary, that discipline and reform is essential. The objective of this paper is to emphasize a neglected but important dimension of agricultural trade liberalization: tropical products offer an opportunity for the world's poorer countries to set their own house in order; not only will they benefit from South–South trade and improvement of their bargaining position in the world market, but they will set an example for the advanced West to emulate.