


1. INTRODUCTION
The physics of the ultraintense laser-matter interaction involves an extensive range of nonlinear phenomena which occur on very short time scales (Hora et al., Reference Hora2012). A general result is the generation of hot electrons with relativistic velocities. Moreover, the interactions of an ultraintense laser pulse with a solid target can generate ion beams (Bari et al., Reference Bari, Sheng, Wang, Li, Salahuddin, Nasim, Shabbir, Gondal and Zhang2010; Grismayer et al., Reference Grismayer, Mora, Adam and Heron2008; Chen & Pukhov, Reference Chen and Pukhov2009) which have unique properties such as high luminosity (Cowan et al., Reference Cowan, Fuchs, Ruhl, Kemp, Audebert, Roth, Stephens, Barton, Blazevic, Brambrink, Cobble, Fernandez, Gauthier, Geissel, Hegelich, Kaae, Karsch, Le Sage, Letzring, Manclossi, Meyroneince, Newkirk, Pepin and Renard-Legalloudec2004), short duration (Clark et al., Reference Clark, Krushelnick, Davies, Zepf, Tatarakis, Beg, Machacek, Norreys, Santala, Watts and Dangor2000), and a high energy spectrum (Yang et al., Reference Yanga, Maa, Shaoa, Xua, Yu, Gua, Yua, Yina, Tiana and Kawatta2010; Jablonski et al., Reference Jablonski, Badziak and Raczka2014). So, they are applied in various physical important fields, e.g., fast ignition (Hora, Reference Hora2007; Tabak et al., Reference Tabak, Hammer, Glinsky, Kruer, Wilks, Woodworth, Campbell, Perry and Mason1994; Mulser & Bauer, Reference Mulser and Bauer2004; Eliezer, Reference Eliezer2012), proton therapy (Khoroshkov & Minakova, Reference Khoroshkov and Minakova1998), and radiology (Santala et al., Reference Santala, Zepf, Beg, Clark, Dangor, Krushelnick, Tatarakis, Watts, Ledingham, Mcanny, Spencer, Machacek, Allott, Clarke and Norreys2001).
Several schemes have been proposed to generate the energetic ion beams. The ions can be accelerated by the charge separation created at the front side of the target (Sagisaka et al., Reference Sagisaka, Nagatomo, Daido, Pirozhkov, Ogura, Orimo, Mori, Nishiuchi, Yogo and Kado2009), by a shock propagating across the plasma inside the target (Eliezer et al., Reference Eliezer, Nissim, Raicher and Martinez-Val2014; Liu et al., Reference Liu, Xie, Huang, Liu and Yu2009; Mora & Grismayer, Reference Mora and Grismayer2009), or at the back of the target (Liu et al., Reference Liu, Zhang, Fu, Gu, Zhang, Liu, Xie, Liu and He2010). In the last case, ions are emitted from the rear surface of thin foils irradiated with sub-picosecond and ultra-intensity lasers (I > 1018 ω/cm−2). The detailed mechanism is the following: the accelerated hot electrons by the laser pulse at the front surface, propagates through the target and an electron sheath forms on the rear surface which accelerates ions (Eliezer et al., Reference Eliezer, Nissim, Raicher, Martinez-Val, Mimaand and Hora2014). In fact, the associated charge separation causes a strong electrostatic field which is oriented normally to the target rear surface. This field can ionize the atoms in the vacuum-target surface layer and accelerates them up to energies in the range of MeV (Hora, Reference Hora1988; Snavely et al., Reference Snavely, Key, Hatchett, Cowan, Roth, Phillips, Stoyer, Henry, Sangster, Singh, Wilks, Mackinnon, Offenberger, Pennington, Yasuike and Langdon2000). This mechanism is the dominant mechanism in most of the laser-driven ion acceleration experiments performed so far and is called target normal sheath acceleration (TNSA) (Nia et al., Reference Nia, Logana, Lunda, Alexanderal, Bienioseka, Cohena, Rotha and Schaumanna2013; Yu et al., Reference Yu, Jin, Zhou, Zhang, Zhao, Cao, Li, Gu, Zhan and Najmudin2013).
The ion expansion process can be commonly described by the model of free isothermal expansion of plasma occupying initially a half space (Huang et al., Reference Huang, Duan, Lan, Tan, Wang, Tang and He2008). The expansion of Gaussian plasma in the quasineutral limit based on the kinetic analytical solutions has been investigated by Mora (Reference Mora2003). It has been shown that, in the semi-infinite plasma model, after a characteristic time of the order of the inverse ion plasma frequency, the major part of the expansion is described by a quasineutral self-similar solution. On the other hand, noting that a main subject of numerous studies in plasma expansion is the electron cooling and the energy transfer, a finite-size plasma model is needed to fully study the plasma expansion (Mora, Reference Mora2005). The electron cooling has been studied in the expansion of a finite-size plasma with a hybrid model assuming a Maxwell Boltzmann distribution.
Up to now, most investigation of the plasma expansion has been limited to the initially Maxwellian distribution for the plasma particles. While the laboratory and space plasmas are not often in thermodynamic equilibrium and a non-Maxwellian electron distribution is required for investigation of these plasmas. Evidence for non-Maxwellian plasma expansion exists in some active space experiments (Ergun et al., Reference Ergun, Carlson, Mcfadden, Mozer, Muschietti, Roth and Strangeway1998). Moreover, the recent measurements show that the electron distribution function in the laser-pellet experiments is a non-Maxwellian with an energetic tail. The energetic electrons could effectively have a significant effect on the plasma behavior such as ionization and expansion processes. Nevertheless, the non-Maxwellian plasma expansion has not been fully investigated yet as a more complicated and interesting case. Moreover, the theoretical and numerical works on the plasma expansion have been done using the hydrodynamic models. The exact particle-in-cell (PIC) simulations are required for studying the kinetic details, e.g., effects associated with the particle distribution function.
The purpose of this paper is the investigation of the expansion of finite size plasma with Kappa distribution using the relativistic 1D3V PIC simulation. Emphasizing on the effects associated with initial energetic electrons, we study the electron cooling, ion spectrum, and the spatiotemporal evolution of electric field. Eventually, the obtained results for initially kappa distribution have been compared with Maxwellian distribution. This paper is organized as follows; in Section 2, the model and simulation box is presented. Section 3 is devoted to the results of simulation. The important conclusions are given in Section 4.
2. MODEL
As mentioned in the introduction, there are many situations in which the plasma is in non-equilibrium state; therefore the distribution function must be modified. In the natural space environment (e.g., astrophysical plasma, planetary magnetospheres, and the solar wind) and laser-target experiments, plasmas are generally observed to have a non-Maxwellian high-energy tail. A useful distribution function to model these plasmas is the generalized Lorentzian (kappa) distribution, including the high energy particle populations (Summers & Thorne, Reference Summers and Thorne1991). The normalized one-dimension kappa distribution is defined by
 $${\,f_k} = \lpar N/{{\rm \pi} ^{1/2}}\rpar \displaystyle{1 \over {{v_{th}}}}\displaystyle{{\Gamma \lpar k + 1\rpar } \over {\Gamma k ^{3/2}\lpar k - 1/2\rpar }}{\lpar 1 + \displaystyle{{{v^2}} \over {k{v_{th}}^2 }}\rpar ^{ - k}}.$$
Where, k is the spectral index, Γ is the gamma function, N is the particle number density, and thermal velocity is related to the particle mass m and temperature T as  ${v_{th}} \hskip -1pt= \hskip -1pt{\lsqb\hskip -1pt \displaystyle{{\lpar 2k - 3\rpar } \over k}\hskip -1pt\rsqb ^{1/2}}{\lpar T/m\rpar ^{1/2}}$. The Maxwellian and Kappa distributions are substantially different in the high-energy tail (| v/v th | > >1), but their differences become less important when the k increases. Equation (1) shows, for all velocities, in the limit of spectral index k → ∞ the distribution leads to the Maxwellian distribution. A comparison of Kappa distribution function with the corresponding Maxwellian distribution has been shown in Figure 1.
Comparison of Kappa function distribution (with spectral indexes k = 2, 4, 6, 10) with the corresponding Maxwellian distribution. For smaller k, the high energy tail of the electron distribution function becomes more significant.

Assuming the above non-Maxwellian (Kappa) distribution for electrons and initially cold ions, we have performed a relativistic 1D3V PIC simulation code to simulate the dynamics of the electrons and ions emitted from a thin finite-size plasma foil heated by laser. The PIC is a precious method for investigation of highly nonlinear phenomena in all aspects of plasma physics. The general aspects of PIC algorithms are well described (Birdsall & Langdon, Reference Birdsall and Langdon1985; Hockney & Estwood, Reference Hockney and Estwood1992). For our purpose, we consider a plasma with initial length located in the range −L/2 ≤ x ≤ L/2. Due to the symmetry around x = 0 and choosing L/2 = 80λD with λD = (ε0k BT e/n 0e2)1/2 being the Debye length, we only need to investigate the expansion over the range of 0 ≤ x ≤ 80λD. To insure the very high degree of energy conservation, space and time steps have been set dx = 0.05λD and dt = 0.02ωpi−1, respectively, where ωpi−1 = (ε0m i/n 0e 2)1/2 is ion plasma frequency. Number of super-particles per each cell is 48. It is considered the initial plasma density n 0 = 1025m −3 and the initial electron temperature T e = 100 eV, so λD = 2.2 × 10⁻⁸m and ωpi−1 = 240.3 × 10⁻¹⁵s. For this value of the initial temperature, collisions are not included in our simulations. The ratio of ion mass to electron mass is m i/m e = 1835. It is noted that all selected parameters which are used in this paper have been normalized. We have used the normalizations as follows;  $\eqalign{\rm \varphi} \equiv \displaystyle{{e{\rm \phi} } \over {{k_B}{T_e}}}{\rm\comma \; }{V_i} \equiv \displaystyle{{{v_i}} \over {{c_s}}}\comma \; \; {N_e} \equiv \displaystyle{{{n_e}} \over {{n_{e0}}}} \comma \;\, {N_i} \equiv \displaystyle{{{n_i}} \over {{n_{i0}}}}\comma \; \, {\rm \chi} \equiv \displaystyle{x \over {{{\rm \lambda} _D}}}\comma \; {\rm \tau} \equiv {{\rm \omega} _{pi}}t.$ Here, φ is the electric potential, c s = λDωpi is defined as the acoustic velocity, v i is the ion velocity, and n e and n i are the electron and ion density, respectively.
3. SIMULATION RESULTS
The simulation results show the deviation from Maxwellian distribution plays a significant role on the spatiotemporal evolution of the plasma parameters. A comparison of longitudinal electron phase-space at time τ = 30 (t = 30 ω pi−1) for Kappa distribution (with k = 4) and Maxwellian has been shown in Figures 2a and 2b, respectively. It is seen that a larger population of hot electrons is expanded to the vacuum for Kappa distribution than Maxwellian distribution, up to this time. Therefore by increasing the population of initially energetic electrons (smaller k), the expansion takes place faster which causes electrons to move further forward for a fixed time. The observations reported by Maksimovic et al. (Reference Maksimovic, Pierrard and Riley1997) on the solar wind with Kappa distribution showed k is definitively smaller for the fast solar wind population, whose velocity distribution functions contain more important tails (see Fig. 2 in Maksimovic et al. (Reference Maksimovic, Pierrard and Riley1997)).
Phase- Space of electrons (a) the initial electron distribution function is Kappa (with k = 4) (b) the initial electron distribution function is Maxwellian, at time τ = 30.
This process can lead to the production of stronger electric field for Kappa distribution than Maxwellian. An expression for the electric field assuming the Boltzmann distribution for the electron density (n e = n 0 exp (e φ /k BT e)) is obtained by integration of the Poisson equation as follow:
 $${E_{\,front}}\lpar x\rpar = {E_0}\displaystyle{{2{{\rm \lambda} _D}} \over {x + \sqrt {2{e_N}} {{\rm \lambda} _D}}}\comma \;$$
where E 0= (n e0k BT e/ε 0)1/2 and e N ≈ 2.71828 are Nepper's numbers. From the continuity equation the value of electric field at x = 0 (on the surface) is (Mora, Reference Mora2003):
 $${E_{\,front}}\lpar x = 0\rpar = \sqrt {2/{e_N}} \, {E_0}.$$
A comparison of evolution of normalized electric field (normalized to E 0 = (n e0k BT e/ε 0)1/2) for Maxwellian and Kappa distributions has been illustrated at τ = 60 (t = 60 ωpi−1) for different values of k, in Figure 3. When the population of initially energetic electrons increases, the electron number contributed to charge separation process is more and consequently, the larger electric field would be resulted by a smaller k. So, the largest observed peak in electric field profile related to the ion front (Diaw & Mora, Reference Diaw and Mora2012) is higher for smaller k, in a characteristic time shown in Figure 3. As can be seen, the largest peak (for electric field) for smaller k occurs farther from the expansion surface due to the higher energetic electron producing the electric field. The inset of this figure represents the early produced electric field due to the electron Maxwellian distribution. In this inset plot, the normalized value of electric field (normalized to E 0 = (n e0k BT e/ε0)1/2) at plasma-vacuum interface with a good approximation is equal to  $\sqrt {2/{e_N}} \, $. This result is in agreement with theoretical equations mentioned in Eq. (2) and Eq. (3). It is noted that the small fluctuations seen in curves come from the numerical noises and decrease by increasing of the super-particles.
Space-evolution of electric field for different k. The inset of this figure represents the initial electric field with an electron Maxwellian distribution at time τ = 60.
The time-space evolution of electric field for k = 4 has been depicted in Figure 4. Investigation of each curve in the phase-space shows that the electric field peak occurs after the homologues electric field region (plateau region). Passing time, the plateau region is broadened due to penetration of ions in this region, and so the electric field peak shift to farther distance from the interface. Moreover, the amplitude of the electric field (electric field peak) at the ion front decreases with time. It shifts logarithmically toward large values of x with amplitude going to zero.
The time-space evolution of electric field for Kappa distribution with k = 4.
By increasing the population of super-thermal electrons on the right side of the target (vacuum), the produced larger electric field (mentioned above) accelerates the ions. So, one could expect the ions accelerate to the higher energy for initial Kappa distribution of electrons than the Maxwellian distribution and the population of energetic ions increases. The ion density variations versus position at different times have been depicted in Figure 5 with k = 6.
The ion density versus position at different times τ = 10, 25, 45, 65, for k = 6.
By increasing time, more ions emit from the plasma foil and penetrate the broader vacuum region. A comparison of ion front velocity (V f) and ion front position (X f) versus time for different initial electron distribution functions have been shown in Figures 6 and 7, respectively, where the ion front is related to the ions set at the farthest point of the plasma-vacuum interface, V f is normalized to c s and X f is normalized to λ D. We can see for smaller k (e.g., k = 4), the ion front obtains more velocity and places farther from the interface than the others values of k (k = 6, k = 10, and k = ∞). These results are according to our expectation and justified with the preceding considerations.
A comparison of ion front velocity (V f) versus time for different k; k = 4, k = 6, k = 10, and k = ∞.
A comparison of ion front position (X f) versus time for different k; k = 4, k = 6, k = 10, and k = ∞.
To complete the investigation of the ions behavior, the ion energy spectrum has been exhibited in Figure 8, for Maxwellian distribution and Kappa distribution with spectral indexes k = 4, and k = 10 at time τ = 60 (t = 60 ω pi−1). The vertical coordinate of this figure is logarithmic. As can clearly be seen in this figure, for smaller k (e.g., k = 4), where the high energy tail of the electron distribution function becomes more significant (see Fig. 1), the population of energetic ions will be increased. Moreover, this figure shows the sheath electrostatic field can accelerate ions to energies in the range of several tens of MeV. According to this range of energy for ions, Mckenna et al. (Reference Mckenna, Carroll, Lundh, Nu Rnberg, Markey, Bandyopadhyay, Batani, Evans, Jafer, Kar, Neely, Pepler, Quinn, Redaelli, Roth, Wahlstrom, Yuan and Zepf2008) reported a maximum energy about 36 MeV for proton acceleration at the rear of thin metallic foils in the ultraintense picosecond laser pulse regime.
The ion energy spectrum for Maxwellian distribution (k = ∞ ) and Kappa distribution with spectral indexes k = 4, and k = 10 at time τ = 60.
The phase-space of electrons with k = 4 has been shown for different times in Figure 9. In this figure, the inset of every plot represents the schematic of corresponding distribution function. The investigation of this figure gives a general picture of electron evolutions; a group of the electrons with much lower energy eventually gain energy from the produced electric field. On the other hand, high energy electrons feed the ion expansion and become generally cooled. Therefore, the electron distribution function becomes depopulated at very low and high energies and becomes populated at moderate energies.
The phase- space of electrons for k = 4 at different times (a) τ = 10 (b) τ = 25, (c) τ = 45 and (d) τ = 65. The inset of every plot represents the schematic of corresponding distribution function.
Formisano et al. (Reference Formisano, Moreno, Palmiotto and Hedgecock1973) have introduced a plasma temperature related to the mean kinetic energy per particle 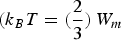 $\lpar{k_B}T=\lpar \displaystyle{2 \over 3}\rpar \, {W_m}$ where
 ${W_m}=\displaystyle{{\sum\limits_{{\rm \alpha}=1}^N {\lpar \lpar {{\rm \gamma} _{\rm \alpha} } - 1\rpar m{c^2}\rpar } } \over N} {\rm with}\;{\rm \gamma} _{\rm \alpha}=1/ \sqrt {1 - v_{\rm \alpha}^2/{c^2}}$ and N are relativistic factor and the total number of particles, respectively).
Such a temperature definition although appropriate for an equilibrium Maxwellian distribution, is not strictly valid for a Kappa distribution, but there are practical advantages to using such definition, which can be a useful concept already accepted in practice for non-Maxwellian distributions (see Hellberg et al., Reference Hellberg, Mace, Baluka, Kourakis and Saini2009 and references therein). After expansion, the plasma electrons start to lose their energy and then the (defined) temperature decreases. In fact, passing time a significant part of electron energy has been transformed to ions. This decline of electron temperature is called electron cooling. The cooling rate is expected to increase with increment the electron energy. To investigate the accuracy of this prediction, the time evolution of electron temperature for different k, has been depicted in Figure 10. By increasing time, the hot electrons start to cool down. The characteristic cooling time for hot electrons is shorter than cold electrons (Diaw & Mora, Reference Diaw and Mora2012). Since the population of super-thermal electrons is more for smaller k, as can be seen from the curves gradient in Figure 10, the cooling rate for k = 4 is larger in comparison to other values (k = ∞ , k = 10, and k = 6). In confirmation to our view, cooling of solar wind electrons has been determined from Helios observations (Marsch et al., Reference Marsch, Pilipp, Thieme and Rosenbauer1989). Moreover, the experimental results obtained by Beutelspacher (Reference Beutelspacher, Grieser, Schwalm and Wolf2000) showed that increasing of expansion causes the cooling rate to increase (see Fig. 6 in Beutelspacher et al. (Reference Beutelspacher, Grieser, Schwalm and Wolf2000)).
Electron temperature versus time for different k; k = 4, k = 10, and k = ∞.
Figure 11 exhibits the kinetic energy 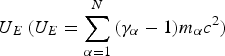 ${U_E}\, \lpar {U_E} = \sum\limits_{{\rm \alpha} = 1}^N {\lpar {{\rm \gamma} _{\rm \alpha} } -1\rpar} {m_{\rm \alpha}} {c^2}\rpar$ and electrostatic energy of the system versus time for different k. In this figure, τ = 0 has been set at the time which the maximum electric field appears. As also shown in Figure 4, decreasing the electric field with time, the electrostatic energy causes to re-heat the particles. So the kinetic energy of particles starts to increase. Moreover, consideration of this figure for different values of k shows the electrostatic energy for smaller k (e.g., k = 4) is more than other values, at a fixed time, and decreases with steeper slope by increasing time.
The kinetic and electrostatic energies of the system versus time for different k; k= 4, k = 6, k = 10, and k = ∞.
4. CONCLUSION
In this paper, using a relativistic 1D3V PIC simulation code, we studied the expansion of non-equilibrium finite size plasma. The main scope of this work is the investigation of the effects of initially energetic electrons on spatiotemporal behaviors of electrons and ions. For this purpose, the Kappa function has been employed to describe the initial distribution function with a high-energy tail. In this distribution, decreasing the spectral index k the initial super-thermal electrons population increases and the tail of electron distribution becomes more significant. The simulation results for Kappa distribution show the expansion takes place faster than the Maxwellian distribution and the energetic ions will be more populated due to the produced stronger electric field. Moreover, the results show the cooling rate of electron temperature for Kappa distribution (for smaller k) is more than the Maxwellian distribution. Toward a physical interpretation of the above simulation results, the effect of the initial energetic electrons on the spatiotemporal evolution of electric field has been completely investigated. A comparison of the radial distribution of the background density, temperature, electric potential and bulk velocity for Maxwellian distribution function for the electrons in the low-speed solar wind with Kappa distribution for the high-speed solar wind was performed by Pierrard et al. (Reference Pierrard, Maksimovic and Lemaire1999, see Fig. 1). The results reported by these authors are comparable with our results. In conclusion, we emphasize that the results of the present investigation will greatly contribute to the understanding of the expansion plasma, as well as ion energization and electron cooling in natural space and laboratory experiments in which the plasma environments are non-Maxwellian.



