



1. Introduction
Trachoma is one of the most common infectious sources of blindness worldwide [Reference Solomon36] and is caused by Chlamydia trachomatis, an obligate intracellular spirochete bacterium [Reference Becker4]. Worldwide, 232 million people in 51 countries are at risk of blindness due to the complications of trachoma infection [39]. The infection begins in childhood with recurrent episodes of chronic follicular conjunctivitis due to C. trachomatis infection. Chronic inflammation promotes irreversible conjunctival scarring, leading to corneal opacity (blindness) [Reference Burton5]. The clinical history of trachoma and its management can be classified into two groups:
-
• active trachoma, which requires antibiotics;
-
• irreversible trachoma, which requires surgery.
The Global Elimination of Trachoma by 2020 (GET2020), a goal set by the World Health Organization (WHO), aimed to reduce the prevalence in endemic regions to less than 5% by 2020. Unfortunately, this target is yet to be achieved in 11 districts in Burundi [Reference Ndayishimiye24]. It is proposed that the reason for failure of the control efforts might be a lack of attention to the environmental improvement component of the SAFE strategy (comprising surgery for trichiasis, antibiotics for active infection, facial cleanliness and environmental improvement), which was recommended as a means to achieve GET2020 targets [Reference Emerson, Burton, Solomon, Bailey and Mabey9]. The antibiotics component of the SAFE strategy comprises the annual mass administration of a single 20 mg/kg dose of the macrolide antibiotic azithromycin, until a prevalence of less than 5% is reached [Reference Jimenez, Gelderblom, Flueckiger, Emerson and Haddad16, Reference Shattock, Gambhir, Taylor, Cowling, Kaldor and Wilson35]. The International Trachoma Initiative (ITI) recommended then that at least a coverage of 90% of a community should be reached during mass antibiotic administration to reduce the prevalence of endemic infection [15, Reference Kolaczinski, Robinson and Finn18, Reference Ngondi, Ole-Sempele, Onsarigo, Matende, Baba, Reacher, Matthews, Brayne and Emerson28].
Whilst administration of antibiotics reduces the number of infected people, in endemic areas environmental measures targeting sanitation and vector-borne transmission might be just as, or even more, important for long-term elimination of trachoma [Reference Nery27]. Provision of sanitary toilets appears to be associated with a lower rate of active trachoma. Since flies act as mechanical vectors of a disease by picking up pathogens from infectious material and transferring them to an uninfected host, elimination of fly habitat by restricting open defaecation and latrines reduces transmission [Reference Emerson, Bailey, Mahdi, Walraven and Lindsay8]. In Egypt, fewer trachoma infections were found in households with private pit latrines and this was related to the reduction of the fly population by restricting its breeding habitat [Reference Emerson10]. Nonetheless, focusing only on its effects on vector-borne transmission may underestimate the contributions of improved sanitation to trachoma control; sanitation may reduce other modes of transmission such as self inoculation (analogous to faecal–oral transmission) or transmission via fomites [Reference Lietman, Pinsent, Liu, Deiner, Hollingsworth and Porco22].
Although the mechanisms of environmentally mediated trachoma transmission are well explained, to the best of our knowledge no mathematical modelling has been done to investigate their contributions to trachoma endemicity. In this paper, we use mathematical modelling, calibrated to field data, to investigate whether environmental transmission can explain the high rate of trachoma in some health districts in Burundi.
2. Model description
The susceptible-infected-susceptible (SIS) scheme, where infected hosts become susceptible once again after recovering from infection [Reference Gambhir11], forms the basis of the model used to evaluate the implementation of the SAFE strategy in Gashoho Health District. The SIS scheme is suitable for trachoma, because it is apparent that the symptomatic (and infectious) state can reoccur in the same individual [Reference Lietman, Porco, Dawson and Blower21, Reference Wilson, Timms and McElwain38]. In addition to person-to-person transmission, our model also includes a compartment representing viable pathogen subsisting in the environment, for example in insanitary latrines that provide an environment for pathogens to proliferate and interact with human hosts and other transmitting vectors. Thus, in this model, susceptible people (S) may become infected through contact with either infected individuals (I) at a rate
 $\beta $
, or via contact with viable pathogen in environmental reservoirs, E, at a rate
 $\theta $
. The rate parameter
 $\theta $
operationalizes multiple possible modes of transmission, for example: physical contact with contaminated waste by individuals then touching their eyes or face, and vector-driven transmission where flies carry pathogen on their bodies to the eyes of an infected individual. These modes of transmission are combined into one parameter for simplicity of the model. For similar reasons, the rate parameter
 $ \eta $
operationalizes the multiple means by which infected individuals shed pathogen into the environment, and the rate parameter
 $\mu $
operationalizes the multiple ways by which the environmental pathogen load might be reduced, including by improved sanitation;
 $\gamma $
is the recovery rate. For this paper, the unit of time is assumed to be one day, the shortest increment of time that would be useful in most practical applications of this model.
The model presented in Figure 1 corresponds to the system of ordinary differential equations (ODEs)
 $$ \begin{align} \frac{dS}{dt}&= - \beta S\,I + \gamma I- \theta S\,E, \notag{}\\ \frac{dI}{dt} &= \beta S\,I + \theta S\,E - \gamma I , \\ \frac{dE}{dt} &= \eta I - \mu E.\notag{} \end{align} $$
Assuming a constant human population size of
 $N=S+I$
, the system (2.1) reduces to
 $$ \begin{align} \begin{split}\frac{dI}{dt}&=\beta N\,I - \beta I^2 + \theta N\,E -\theta E\,I- \gamma I, \\ \frac{dE}{dt}&= \eta I - \mu E. \end{split} \end{align} $$
The system of equations (2.2) has two equilibrium solutions: a disease-free equilibrium
 $(0,0)$
and an endemic equilibrium
 $$ \begin{align} \begin{pmatrix}\hat{I} \\[6pt] \hat{E}\end{pmatrix}= \begin{pmatrix} \dfrac{\beta N \mu +\theta \eta N -\gamma \mu}{\beta\mu + \theta \eta}\\[12pt] \dfrac{\eta}{\mu}\bigg(\dfrac{\beta N \mu +\theta \eta N -\gamma \mu}{\beta\mu + \theta \eta}\bigg) \end{pmatrix}\text{,} \end{align} $$
where
 $\hat {I}$
and
 $\hat {E}$
represent the variation over time of the infected individuals and pathogens, respectively. The stability of the disease-free equilibrium (DFE) is studied first. Evaluated at the DFE, the Jacobian of (2.2) is
 $$ \begin{align} J(0,0)&=\begin{bmatrix} \beta N - \gamma & &\theta N\\ \eta & & - \mu \end {bmatrix} \text{.} \end{align} $$
For stability, the trace (tr) of the matrix in (2.4),
 $$ \begin{align*} \text{tr}(0,0)&= \beta N - \gamma - \mu\text{,} \end{align*} $$
must be negative. This condition is satisfied subject to
 $$ \begin{align} \frac{\beta N}{\gamma}< 1+\frac{\mu}{\gamma}\text{.} \end{align} $$
The stability of the DFE also requires that the determinant of (2.4),
 $$ \begin{align*} \det(0,0)&= -\beta N \mu + \gamma \mu - \theta \eta N, \end{align*} $$
is positive. This condition is satisfied subject to
 $$ \begin{align} \frac{\beta N }{\gamma} &< 1- \frac{\theta \eta N}{\gamma \mu}\text{.} \end{align} $$
Trachoma transmission scheme which includes human and environmental transmission.

Considering the two conditions (2.5) and (2.6), and given that only positive parameter values are meaningful, it is apparent that the condition (2.5) is satisfied whenever (2.6) is true. Therefore, for the DFE to be stable, it is sufficient to consider only the inequality (2.6). It is useful to reorganize (2.6) as
 $$ \begin{align} \frac{\beta N}{\gamma}+ \frac{\theta \eta N}{\gamma\mu} &<1\text{.} \end{align} $$
The left-hand side of (2.7) may be interpreted as representing the summation of the basic reproduction numbers of the model. The basic reproductive number,
 $R_0$
, is usually defined as the expected number of secondary infections arising from a single individual during his or her entire infectious period in a wholly susceptible population [Reference Li, Blakeley and Smith20]. The quantity
 $R_0$
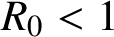
is often used as a bifurcation parameter in many mathematical models. If
 $R_0<1$
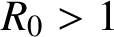
, then the infection cannot be transmitted effectively and will not become endemic or cause an epidemic, whereas when
 $R_0> 1$
, endemic or epidemic transmission is possible [Reference Heffernan, Smith and Wahl14]. Equation (2.7), on the other hand, can be expressed in terms of two quantities that behave similarly to the traditional definition of
 $R_0$
and hence can be viewed as basic reproduction numbers. Let
 $R_{0H} $
denote the expected number of secondary infections caused by one infectious individual in a wholly susceptible population, as per the normal definition of
 $R_0$
. Further, let
 $R_{0E} $
denote the expected number of infections caused by one unit of pathogen in the environment, in a wholly susceptible population. Further, let
 $$ \begin{align*} \frac{\beta N}{\gamma}+ \frac{\theta \eta N}{\gamma\mu} &=R_{0H}+R_{0E} \text{,} \end{align*} $$
such that the inequality (2.7) can be reduced to
 $$ \begin{align} R_{0H}+R_{0E}& <1\text{.} \end{align} $$
The inequality (2.8) shows that not only both
 $ R_{0H} $
and
 $ R_{0E} $
must be reduced to be less than 1, but their sum must also be greater than 1 for the eradication of trachoma, with the condition on
 $ R_{0E} $
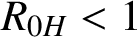
showing the vital role of environmental improvement in the SAFE strategy. While
 $ R_{0H}<1$
may be attained using antibiotics,
 $ R_{0E}$
can only be reduced using environmental improvement.
For completeness, the stability of the endemic equilibrium (EE) is now considered. The Jacobian of (2.2), evaluated at
 $(\hat {I},\hat {E})$
, is
 $$ \begin{align} J(\hat{I},\hat{E}) &= \begin{pmatrix} -\dfrac{\beta^2 N \mu^2 +2\beta N \mu \theta \eta - \beta \mu^2 \gamma + \theta^2 \eta^2 N }{(\beta \mu + \theta \eta)\mu} & \dfrac{\theta \gamma \mu}{\beta \mu + \theta \eta} \\ \eta & -\mu \end{pmatrix}. \end{align} $$
Stability requires that the trace of the matrix in (2.9),
 $$ \begin{align} \text{tr}(\hat{I},\hat{E}) &= -\frac{\beta^2 N \mu^2 + 2\beta N \mu \theta \eta -\beta \mu^2 \gamma + \theta^2\eta^2 N + \theta \eta \mu^2 + \beta\mu^3}{(\beta\mu + \theta \eta )\mu} , \\ \nonumber \end{align} $$
is less than zero. The denominator of (2.10) being positive by definition for realistic parameter values, the trace will be negative when the numerator in (2.10) is also positive, which occurs subject to
 $$ \begin{align} \beta N \mu + \theta \eta N - \gamma \mu>0\text{.} \end{align} $$
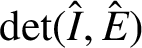
The stability of the endemic equilibrium further requires that the determinant of (2.2), evaluated at the endemic equilibrium,
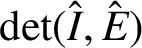 $\det (\hat {I},\hat {E})$
, be positive. Since
 $\det (\hat {I},\hat {E})$
can be simplified to
 $$ \begin{align*} \det(\hat{I},\hat{E})&= \beta N \mu + \theta \eta N - \gamma \mu, \end{align*} $$
satisfying the inequality (2.11) is sufficient for stability. Nonetheless, it is convenient to rearrange the inequality as
 $$ \begin{align} \frac{\beta N}{\gamma}+ \frac{\theta \eta N}{\gamma \mu}&>1\text{,} \end{align} $$
which is the reciprocal condition to (2.8) and thus clearly shows the dynamics. If
 $R_{0H}$
and
 $R_{0E}$
are, respectively, the numbers of new infections produced in a wholly susceptible population by an infected individual and a unit of pathogen in the environment, as defined previously, inequality (2.12) can be expressed as
 $$ \begin{align} R_{0H}+R_{0E}&>1\text{.} \end{align} $$
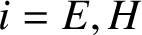
It is important to note the additive action of
 $ R_{0i}$
where
 $ i = E,H $
from (2.13) on the existence of an endemic equilibrium; the sum of
 $R_{0i} $
needs to be greater than 1, regardless of whether any or both of them is less than 1. Hence, even in the absence of a productive person-to-person transmission, a contaminated environment can drive endemic disease. These results reinforce the importance of environmental improvement in ensuring that the SAFE strategy is effective.
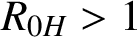
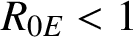
When
 $R_{0H}> 1 $
and
 $R_{0E} < 1$
, the system tends towards the second equilibrium point due to person-to-person transmission only; if
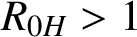 $R_{0H}> 1 $
but
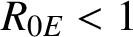 $ R_{0E} < 1$
, residual pathogen in the environment is sufficient to cause endemic disease in the human population. In the first case, antibiotic administration constitutes a successful control measure, but, in the second case, environmental improvement needs to be implemented to control the disease. If all
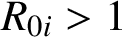 $R_{0i}>1$
, the endemic equilibrium is stable and both antibiotics and environmental improvement will be required to eliminate the disease.
3. Application of the model to Gashoho Health District
3.1. Epidemiological context
Gashoho Health District is one of the areas of Burundi where trachoma persists at endemic levels. In Gashoho, as in other parts of the country, pockets of endemic trachoma occur in rural locations [Reference Ndayishimiye24]. The main reason for the clustering of trachoma in rural areas is believed to be a lack of sanitation [Reference Hägi, Schémann, Mauny, Momo, Sacko, Traoré, Malvy and Viel13, Reference Sahlu and Larson33]. The prevalence of trachoma and its associated risk factors were recently studied in four villages (117 households, 468 individuals) in Gashoho Health District by Ndisabiye et al. [Reference Ndisabiye, Gahungu, Kayugi and Waters26]. Briefly, the prevalence of active trachoma was found to be 7.9% (95% CI 5.0–9.6) overall and 19.5% (95% CI 13.7–26.4) in children aged 1–9 years. Individuals in households with access to improved sanitation were found to have almost half the odds of trachoma infection; the corresponding odds ratio (OR) and confidence interval (CI) were recorded (OR
 $=$
0.437, 95% CI 0.256–0.743). These results are in line with those from several other epidemiological studies from the region. One study in Tanzania found a similar protective association between sanitary toilets and trachoma infection (OR
 $=$
0.49, 95% CI 0.26–0.93) [Reference Montgomery, Desai and Elimelech23]. Another study in Guinea-Bissau revealed that the presence of flies around a latrine was independently associated with trachoma infection with an odds ratio of 2.1 (95% CI 1.1–3.8) [Reference Last, Burr, Weiss, Harding-Esch, Cassama, Nabicassa, Mabey, Holland and Bailey19]. All of these findings suggest that aside from person-to-person transmission, the persistence of trachoma in Gashoho Health District is maintained at least in part by environmentally mediated transmission. The mathematical model described above was therefore fitted to the field prevalence data [Reference Ndisabiye, Gahungu, Kayugi and Waters26], and the possible impact of sanitation programmes on trachoma endemicity in Gashoho was studied using an effect size, based on ratios of the odds identified in the aforementioned studies.
3.2. Mathematical relationships used in model fitting
To fit the model to prevalence arising from the field work as described by Ndisabiye et al. [Reference Ndisabiye, Gahungu, Kayugi and Waters26], we rely on the well-established relationship between prevalence (proportion infected) and basic reproduction number
 $R_0$
at the endemic equilibrium,
 $$ \begin{align} \frac{\hat{I}}{N}&=1-\frac{1}{R_0}\text{,} \end{align} $$
in which
 $R_0$
is a generic basic reproduction number [Reference Anderson, Chaplain and Rejniak1–Reference Banasiak and Lachowicz3, Reference Gause12, Reference Keeling and Rohani17, Reference Pinsent, Burton and Gambhir30, Reference Segel and Edelstein-Keshet34]. If this relation holds for our model, then we have the generic reproduction number
 $R_0=R_{0H}+R_{0E}$
, such that
 $$ \begin{align*} \frac{I}{N}&=1-\frac{1}{R_{0H}+R_{0E}}. \end{align*} $$
This relation can be proved specifically for the system (2.2) at the endemic equilibrium, using equation (3.14). Dividing the value of
 $\hat {I}$
at the endemic equilibrium solution of (2.2) and (2.3) by N yields
 $$ \begin{align} \begin{split} \frac{\hat{I}}{N}&=\frac{1}{N}\bigg(\frac{\beta N \mu +\theta \eta N -\gamma \mu}{\beta\mu + \theta \eta}\bigg) \\ &=1-\frac{\gamma \mu}{N(\beta\mu + \theta \eta)}\text{.} \end{split} \end{align} $$
Substituting (3.15) into (3.14) gives
 $$ \begin{align} \begin{split} \frac{1}{R_0}&= 1-\bigg(1-\frac{\gamma \mu}{N(\beta\mu + \theta \eta)} \bigg) \\ &=\frac{\gamma \mu}{N(\beta\mu + \theta \eta)}\text{.} \end{split} \end{align} $$
From (3.16),
 $$ \begin{align} R_{0}&=\bigg(\frac{\gamma \mu}{N(\beta\mu + \theta \eta)}\bigg)^{-1}\notag{}\\[6pt] &=\frac{\beta N}{\gamma}+\frac{\theta \eta N}{\gamma \mu}\notag{}\\ &=R_{0H}+R_{0E}\text{.} \end{align} $$
Thus, for this model, the value of the generic reproduction number
 $R_{0}$
, which determines the prevalence of infection amongst humans at endemic equilibrium, is the sum of
 $R_{0H}$
and
 $R_{0E}$
.
A notable deduction from (3.17) is that where both
 $R_{0E}$
and
 $R_{0H}$
exceed 1, this would give
 $R_{0H}+R_{0E}> 2$
, resulting in a prevalence exceeding
 $50$
%, which is unrealistic for trachoma in Gashoho Health District. Therefore, the relation (3.17) establishes that only scenarios where only one of
 $R_{0E}$
or
 $R_{0H}$
exceeds 1 can realistically explain the dynamics of persistent trachoma in Gashoho.
3.3. Model fitting and sensitivity analysis
The model (2.3) was fitted to the endemic equilibrium by setting
 $\gamma $
and N constant, whilst varying the values of other parameters. The recovery rate
 $\gamma $
was fixed at 0.017, based on clinical data [Reference Ray32], and the population size was fixed at
 $N=1000$
. Other parameters, represented by the vector
 $\hat {p}=(\beta ,\theta ,\eta ,\mu )$
, were varied. Latin hypercube sampling was used to generate random values of each parameter, and then the system (2.2) was solved numerically for all possible combinations of these parameter values to identify all parameter combinations yielding solutions within the 95% confidence interval for field prevalence in Gashoho from [Reference Ndisabiye, Gahungu, Kayugi and Waters26]. All simulations used initial conditions of one infected person and zero pathogen in the environment, and were conducted using the library (deSolve) in R (version 10.14.6) on Mac OSX Mojave, with a time step of one day. Results of these simulations are shown in Figure 2, which showed that for scenarios where
 $1.107\,646\,637> R_{0H}+R_{0E} > 1.051\,710\,284$
, the prevalence at endemic equilibrium fell and was not significantly different to the field prevalence in Gashoho of 7.9% (95% CI 5–9.6) [Reference Ndisabiye, Gahungu, Kayugi and Waters26].
The prevalence (infected fraction) at endemic equilibrium using different values of
 $R_{0E}$
and
 $R_{0H}$
. The red horizontal lines represent the upper and lower limits of the 95% CI for the prevalence of infection in Gashoho Health District as reported in [Reference Ndisabiye, Gahungu, Kayugi and Waters26]. Likewise, the blue lines represent threshold greater than 10% or less than 5% and green lines represent threshold between 5% and 10%. Values of
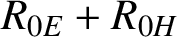 $R_{0E} + R_{0H}$
between 1.051 710 284 and 1.107 646 637 were found to result in endemic prevalences within the desired 95% CI. The code for this plot can be found in [Reference Ndisabiye25].

Multiple regression was used for sensitivity analysis of the results presented in Figure 2, with prevalence at endemic equilibrium as the dependent variable and
 $R_{0H}$
and
 $R_{0E}$
as independent variables. The interaction between the two dependent variables was modelled as an additive effect. This regression-based sensitivity analysis showed that only the sum
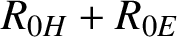 $R_{0H}+R_{0E}$
, and not the individual reproduction numbers
 $R_{0H}$
and
 $R_{0E}$
, was a significant predictor of prevalence at endemic equilibrium. Standardized regression coefficients from the sensitivity analysis are shown in Table 1.
Standardized regression coefficients from sensitivity analysis, showing the effects of varying values of
 $R_{0H}$
and
 $R_{0E}$
on model output.

3.4. Simulating the effect of environmental interventions
3.4.1. Computational methods To demonstrate the possible effect of improvements in sanitation on trachoma control, we used three representative parameter sets yielding solutions falling within the appropriate confidence interval in Figure 2 and thus satisfying the constraint
 $1.107\,646\,637> R_{0H}+R_{0E} > 1.051\,710\,284$
:
-
(i)
 $R_{0H}+R_{0E}= 1.0931$
,
$R_{0E}=1.0924$
,
$R_{0H}=0.0007$
;
-
(ii)
$R_{0H}+R_{0E}= 1.0986$
,
$R_{0E}=0.3398$
,
$R_{0H}=0.7588$
; -
(iii)
$R_{0H}+R_{0E}= 1.0935$
,
$R_{0E}=0.0764$
,
$R_{0H}=1.0170$
.









As noted in Section 3.2 above, field prevalences at endemic equilibrium will exceed 50% if
 $R_{0H}+R_{0E}> 2$
. Therefore, we did not study a scenario where both
 $R_{0E}$
and
 $R_{0H}$
exceed 1, since it would be impossible to fit such a scenario to the most recent field data [Reference Ndisabiye, Gahungu, Kayugi and Waters26].
Recalling that provision of improved sanitation at least halves the odds of household infection [Reference Montgomery, Desai and Elimelech23, Reference Ndisabiye, Gahungu, Kayugi and Waters26], we inferred that improved sanitation must at least double the environmental clearance rate
 $\mu $
to have this effect. Therefore, for the three representative scenarios listed above, we allowed simulations to attain endemic equilibrium. After endemic equilibrium had been reached, we used the endemic equilibrium values of
 $\hat {I}$
and
 $\hat {E}$
as initial conditions for additional simulations in which the value of
 $\mu $
was doubled. Again, all simulations were conducted using the library (deSolve) in R (version 10.14.6) on Mac OSX Mojave, with a time step of one day.
Results for these simulations are presented in Figure 3, with plots (a)–(c) corresponding to the three scenarios satisfying the endemic equilibrium as listed above. Parameter values used for each scenario are given in Table 2.
Time (days) to elimination for when environmental improvement is implemented in endemic populations where infection dynamics are described by scenarios (a), (b) and (c) in Section 3.4. For each scenario, environmental improvement is implemented by doubling the value of
 $\mu $
whilst holding other parameters constant. The code for simulation can be found online [Reference Ndisabiye25].

Parameters used to simulate the effect of environmental interventions in three scenarios regarding the dynamics governing endemic disease in Gashoho. Scenario (a) corresponds to dynamics where
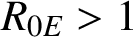 $ R_{0E}> 1$
and
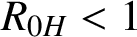 $ R_{0H} < 1$
; (b) corresponds to dynamics where the individual
 $ R_{0i}$
are both
 $ <1$
, but their sum exceeds 1; and (c) corresponds to a scenario where
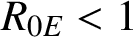 $ R_{0E} < 1$
and
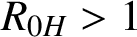 $ R_{0H}>1$
.

3.4.2. Results As shown in Figure 3, for scenarios (a) and (b), increases in the rate of
 $\mu $
corresponding to field estimates of the effect size attributable to improved sanitation resulted in eventual eradication of trachoma. More importantly, elimination defined by the WHO as less than
 $5$
% prevalence and no active transmission (zero incidence) was attained in approximately 1 year in scenario (a), but took much longer for scenario (b). This is explained by the fact that in scenario (a), environmental transmission is a dominant form of transmission; it is only contributory in scenario (b) (see Table 2).
Conversely, in scenario (c) where the human-to-human transmission is dominant, the improvement of the environment did not result in the disease-free equilibrium. However, the simulated environmental intervention still had an important impact, with the endemic prevalence reduced below the 5% target of GET2020 over 3 years (see Figure 3(c)). Thus, even if environmental transmission is only a minor factor in maintaining trachoma in Gashoho, environmental interventions are still needed to attain GET2020 targets. These numerical results are in agreement with both our stability analysis and the clinical consensus that eradication or further reduction in the prevalence of trachoma in Gashoho depends upon improvements in sanitation [Reference Ndisabiye, Gahungu, Kayugi and Waters26].
4. Discussion
This study presents algebraic and numerical results showing support for the clinical consensus that eradication or further reduction in the prevalence of trachoma in Gashoho, including attaining GET2020 targets, depends upon improvements in sanitation [Reference Dolin, Faal, Johnson, Minassian, Sowa, Day, Ajewole, Mohamed and Foster7, Reference Ndisabiye, Gahungu, Kayugi and Waters26, Reference Stocks, Ogden, Haddad, Addiss, McGuire and Freeman37]. The results are obtained through formulation and analysis of the first mathematical model of trachoma transmission to explicitly include an environmental component. As such, the study makes an important contribution to trachoma-modelling literature in the literature.
The work in this paper sought to include multiple modes of transmission to fully capture the potential benefits of improved sanitation on the transmission of trachoma. Furthermore, environmental improvements will not only reduce trachoma transmission, but will also provide some other health benefits to households and communities, for example a reduction in the incidence of diarrhoea.
Nonetheless, our model has a number of limitations that can be improved in further research. The use of the SIS framework, though employed by other authors [Reference Pinsent, Liu, Deiner, Emerson, Bhaktiari, Porco, Lietman and Gambhir31], is an oversimplification, since it omits the clinical consequences of repeated infection (corneal opacity and trichiasis), as well as the reduction in the risk of infection with age. Future work should improve the model by incorporating temporary or partial immunity, births and deaths, and age structure [Reference Gambhir11]. Additionally, we did not simulate the effect of interventions targeting the pick-up rate
 $ \theta $
or the deposit rate
 $\eta $
, but only those that removed pathogen load from the environment. Furthermore, we did not distinguish between the different modes of pathogen acquisition (fomites, physical contact, vector borne etc) operationalized by the parameter
 $ \theta $
. Future research should develop our model by including public health interventions targeting either the pick-up rate
 $ \theta $
or the deposit rate
 $\eta $
, and the different modes of transmission operationalized using these parameters. Future studies should also explore the persistence of the causative agent of trachoma in the environment and the exact magnitude in reduction that can be achieved by improving environmental conditions to reduce transmission [Reference Pinsent, Blake, Basáñez and Gambhir29].
Future research should also apply the model developed in this paper to other infectious diseases where environmentally mediated transmission is important and SIS dynamics are appropriate. Even though many other models incorporating environmentally mediated transmission have been developed for cholera, these are significantly different from our model because cholera is a vaccine-preventable disease, whereas trachoma is not. Cholera infection confers immunity, and thus cholera models use a susceptible-infected-recovered (SIR) framework [Reference Chao, Longini and Morris6], whereas our model accommodates repeated infection by using an SIS framework. There are many SIS-type infections that exhibit environmental transmission that remain neglected in the infectious disease modelling literature, including Ascaris lumbricoides, Onchocerca volvulus and Tenia coli. The model presented in this paper thus differs in key aspects from those previously described in the literature and has many applications in trachoma research and more broadly.
5. Conclusion
The environmental improvement component of the SAFE strategy has been neglected in parts of Africa where the disease remains endemic, such as Burundi. Our study developed a new model for trachoma transmission incorporating environmental transmission and calibrated it to recently obtained field data from Gashoho Health District, Burundi. We demonstrated that in areas where environmentally mediated transmission contributes to more than one infection on average in a susceptible population (
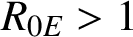 $R_{0E}>1$
), improvement of the environment should be considered as the major component of the SAFE strategy upon which elimination of trachoma depends. Even where environmentally mediated transmission makes only a minor contribution to trachoma endemicity, interventions targeting environmental transmission can result in reductions in prevalence, which might be important for reaching overdue GET2020 targets. Overall, our study reinforces the fact that only by full application of the SAFE strategy emphasizing environmental improvement, the targets for trachoma elimination can be achieved in Burundi.



