





Long-term adequate intakes of fruit and vegetables (FV) are part of healthy diets and reduce non-communicable disease risk(Reference Bhandari, Liu and Lin1,Reference Mente, Dehghan and Rangarajan2) . Since population FV intake is insufficient, interventions to increase intake are necessary(3–Reference Samdal, Eide and Barth5). Furthermore, longitudinal assessments should identify whether interventions are contributing to long-term adequate FV intake(3–Reference Samdal, Eide and Barth5).
Immediate intervention effects have ranged from 0·13 to 0·40 fruit servings and from 0·01 to 0·28 vegetable servings(Reference Nitschke, Gottesman and Hamlett6,Reference Patnode, Redmond and Iacocca7) . However, the few existing longitudinal studies demonstrate that these effects are not usually maintained(Reference Fjeldsoe, Goode and Phongsavan4,Reference Samdal, Eide and Barth5,Reference Kwasnicka, Dombrowski and White8) .
Most interventions do not include follow-up assessments beyond 24 months after baseline(Reference Fjeldsoe, Neuhaus and Winkler9) with the exception of two older trials(Reference Tinker, Bonds and Margolis10,Reference Pierce, Newman and Natarajan11) . Tinker et al. (2008) identified that a low–fat, high-FV diet intervention was effective in increasing FV intake at one and six years(Reference Tinker, Bonds and Margolis10). Pierce et al. (2007) have also identified an increased FV intake at 12 and 48 months(Reference Pierce, Newman and Natarajan11). However, these trials were atypical in duration and were either not focused on FV intake(Reference Tinker, Bonds and Margolis10) or promoted an intake of 10 servings a day(Reference Pierce, Newman and Natarajan11). This lack of long-term assessments denotes the need for longitudinal studies to assess the maintenance of increased FV intake, especially within health promotion programmes(Reference Faria, Brenner and Deckert12).
Person-centred theoretical approaches, goal-setting, graded tasks, environment modifications and self-monitoring were associated with the maintenance of intervention effects over time(Reference Samdal, Eide and Barth5). The transtheoretical model (TTM) allows for the modification of psychosocial mediators of behaviour change such as stages of change, self-efficacy, decisional balance and processes of change(Reference Menezes, Bedeschi and Santos13). Using the four TTM pillars and the autonomy-promoting pedagogy of Paulo Freire, we developed a nutrition intervention to increase FV intake among health promotion service participants(Reference Menezes, Mendonça and Ferreira14). Previous studies have shown short-term intervention effects; however, long-term effects have not been assessed(Reference Mendonça R de, Mingoti and Gazzinelli Bethony15). Evidence from recent meta-analyses has demonstrated that an adequate FV intake, i.e. at or above 400 g/d, should be sustained over time in order to provide health benefits such as reducing the risk of non-communicable diseases(Reference Bhandari, Liu and Lin1,Reference Mente, Dehghan and Rangarajan2) . Therefore, it is necessary to extend post-intervention assessments to understand whether intervention participants with initial gains are able to sustain these outcomes over time. Thus, we aim to assess whether participants from a group-based intervention using behaviour change elements maintained positive changes in FV intake after 36 and 48 months.
Methods
Study design and setting
This was a 48-month follow-up analysis of a randomised controlled community trial in which we analysed the long-term maintenance of increased FV intake after a nutrition intervention(Reference Menezes, Mendonça and Ferreira14). Our study analysed data from baseline (time 0) and three post-intervention assessments: 12 months after baseline (immediately post-intervention), 36 and 48 months after baseline. The randomised controlled community trial was included in the Brazilian Clinical Trials Registry on August 12, 2015, under protocol RBR-9h7ckx, and this report follows the Consolidated Standards of Reporting Trials (CONSORT 2025) Statement(Reference Hopewell, Chan and Collins16).
The nutrition intervention was carried out in the Health Academy Program (Programa Academia da Saúde – PAS), a public national health promotion service, in Belo Horizonte, Brazil. PAS units are implemented in the communities and staffed with qualified professionals that offer health promotion and health education for participants(Reference Faria, Brenner and Deckert12). PAS is present in more than half of Brazilian cities, with high participant retention, and is a potential setting for longitudinal assessments of nutrition interventions(Reference Faria, Brenner and Deckert12). As a primary health care service, PAS provides health promotion interventions for participants and also participates in preventive and longitudinal care, in a partnership with primary health care centres. PAS is managed by the Brazilian Ministry of Health, but local governments also provide resources for programme implementation and maintenance. In Belo Horizonte, PAS units are generally located near PHC centres, and implementation of new units is done following local vulnerability analyses, prioritising vulnerable communities with worse health indicators and thus contributing to tackle social inequities in health(Reference da Silva, Teixeira and Prates17–Reference Crochemore-Silva, Knuth and Mielke19).
Sampling
From fifty existing PAS units, forty-two were eligible as they were located in vulnerable areas and had not participated in previous nutrition intervention studies. For each of the city’s nine administrative districts, two units were drawn and randomised to the control group (CG) or the intervention group (IG), totalling eighteen units. Our sample is representative of participants from units located in medium, high or very high vulnerability neighbourhoods, with a 95% level of confidence, and error ≤1·4 %(Reference Menezes, Mendonça and Ferreira14).
Participants aged 20 years or older who had attended the service in the previous month were invited to the trial. From 3763 eligible participants, 3414 (90·7 %) agreed to participate, 237 (6·3 %) refused, and 112 (3·0 %) were excluded due to pregnancy or cognitive impairments(Reference de Menezes, de Lima Costa and Ferreira20). This study analysed data from 2232 participants with positive changes in FV intake from baseline to 12 months: a) baseline intake <400 g/d with any increase at 12 months; b) baseline intake ≥400 g/d, remained ≥400 g/d at 12 months. Baseline participants who were lost to follow-up at 12 months had their FV intake data imputed using multiple imputation procedures, which are detailed in the Data analysis section. This approach allowed us to preserve statistical power and to identify individuals whose imputed FV intake at 12 months met inclusion criteria for this study(Reference Carvalho, Lopes and Freitas21).
Measures
Baseline data were collected face-to-face in 2013-2014, and three post-intervention assessments were performed: at 12 months after baseline (face-to-face), and at 36 and 48 months after baseline (computer-assisted telephone interviews)(Reference Freitas, Mingoti and Lopes22). Validated data collection instruments were based on national health surveys and were previously tested with our population, as reported in the study protocol and validation studies(Reference Menezes, Mendonça and Ferreira14,Reference de Menezes, de Lima Costa and Ferreira20,Reference Freitas, Mingoti and Lopes22,Reference Lopes, dos Santos and Lopes23) .
Trained registered dietitians and nutrition undergraduate and graduate students collected data(Reference de Menezes, de Lima Costa and Ferreira20). At follow-up, neither interviewers nor participants had access to previous data, and a reduced team was employed for computer-assisted telephone data collection to minimise error(Reference Freitas, Mingoti and Lopes22).
The following baseline data were used: sex (female/male), age (adult if under 60/elderly if 60 and older), schooling (under eight years/eight or more years), per capita income (calculated as self-reported monthly family income divided by the number of household residents and categorised as: below minimum wage/ at or above minimum wage at the time of data collection), self-reported hypertension and diabetes mellitus, recent receipt of dietary counselling, recent weight loss attempts. Time since joining PAS was calculated as the difference between the date of baseline data collection and the date of joining the service and categorised as: 0 to 11 months/12–23 months/24–35 months/36 months or more(Reference Menezes, Mendonça and Ferreira14). We measured participants’ weight and height, calculated Body Mass Index (BMI), and classified BMI as underweight (BMI < 18·5 kg/m2), adequate weight (BMI between 18·5 and 24·9 kg/m2;), overweight (BMI between 25·0 and 29·9 kg/m2;) or obesity (BMI ≥ 30·0 kg/m2;)(24).
Baseline eating behaviour was assessed using the TTM stages of change(Reference Menezes, Mendonça and Ferreira14). An adapted algorithm was used to assess stages of change for increasing FV intake as separate groups, based on whether participants perceived their FV intake as adequate(Reference Kristal, Glanz and Curry25,Reference Toral, Slater and Cintra26) . Those who perceived their FV intake as adequate were asked about how long they had maintained the current intake. Those who did not perceive their intake as adequate were asked about their motivation to increase it within six months and their confidence to start within 30 days(Reference Kristal, Glanz and Curry25,Reference Toral, Slater and Cintra26) . Participants were classified in one of five stages: precontemplation (does not consider intake as adequate; no intention to increase it); contemplation (does not consider intake as adequate; intends to increase it; not confident to start within 30 d); preparation (does not consider intake as adequate; intends to increase it; confident to start within 30 d); action (considers intake as adequate; has maintained it for under six months); or maintenance (considers intake as adequate; has maintained it for six months or more)(Reference Kristal, Glanz and Curry25,Reference Toral, Slater and Cintra26) .
FV intake was estimated using brief questions on frequency and servings, adapted from a national survey, validated for our population, excluding juices, smoothies, roots or tubers(Reference Lopes, dos Santos and Lopes23). Frequency was classified as: never or less than once a month; 1–3 times/month; 1–2 times/week; 3–4 times/week; 5–6 times/week; daily(Reference Lopes, dos Santos and Lopes23). Participants reported FV servings consumed in a typical day in usual measurements, which we converted to standard servings, and also reported the most frequent method for cooking vegetables(3). We estimated average daily servings of FV at each time point using the following equations(Reference Lopes, dos Santos and Lopes23):
Self-reported frequency of intake – at least once a week:
Daily intake = (number of servings in a usual day × frequency of intake)/7
Self-reported frequency of intake – at least once a month but less than once a week:
Daily intake = (number of servings in a usual day × frequency of intake)/30
Servings were multiplied by 80 to estimate intake in grams. FV intake was estimated by adding fruit intake to vegetable intake and classified as adequate (≥400 g/d) or inadequate (<400 g/d)(3).
Changes in intakes at each follow-up (deltas, ∆) were calculated by subtracting the average daily intake in the previous assessment from the average daily intake at follow-up, i.e. ∆12m–36m = intake at 36 months – intake at 12 months.
Nutrition intervention
For seven months, we delivered a group-based intervention aimed at increasing FV intake for IG participants. PAS teams in the CG delivered usual care without discussing FV intake with participants. Usual care included exercise and health education, which was also available for the IG(Reference Menezes, Mendonça and Ferreira14).
TTM constructs and the pedagogy of Paulo Freire were the theoretical underpinnings of our intervention(Reference Menezes, Mendonça and Ferreira14). Subgroups were created for individuals in different stages of change: precontemplation and contemplation were grouped into a pre-action group; the preparation stage had a specific group called preparation; and action and maintenance were grouped into an action group(Reference Menezes, Mendonça and Ferreira14). Participants in different stages for fruit and vegetable intake were enrolled in the subgroup according to their lowest stage of change, i.e. a participant in contemplation for fruit intake and preparation for vegetable intake was placed in pre-action(Reference Menezes, Mendonça and Ferreira14).
Registered dietitians, a psychologist and a health education researcher developed eight theory-based scripts for each subgroup’s sessions, addressing topics identified through a qualitative study and a literature review, such as health benefits of FV intake, barriers and strategies to increase FV intake(Reference Menezes, Mendonça and Ferreira14). Pre-action sessions emphasised cognitive processes of change. The preparation group used a mix of cognitive and behavioural processes. In the action group, emphasis was given to behavioural processes(Reference Menezes, Mendonça and Ferreira14).
In-person 1-hour monthly sessions included conversation circles, cooking demonstrations, movie discussion and environment modifications. Three stage-tailored motivational postcards and one informative pamphlet were sent between sessions(Reference Menezes, Mendonça and Ferreira14). Registered dietitians, nutrition majors and a psychologist not involved with data collection delivered sessions in PAS units. If any subgroup had over twenty participants, participants were split into smaller groups so that each session included a maximum of twenty participants at a time; sessions were repeated as needed until all participants were reached(Reference Menezes, Mendonça and Ferreira14).
Data analysis
Microsoft Access was used for tabulation and Stata 14 for analysis. Statistical significance was set at 5 %. Multiple imputation of outcome measures (estimated FV intake) was performed to address losses to follow-up at 12, 36 and 48 months. Assuming a ‘missing at random’ mechanism, we used sex, age and schooling as predictors in thirty-three imputed datasets, due to their associations with FV intake at baseline and/or missingness at follow-up, and also due to the absence of missing baseline data for these variables, using a chained equations procedure (MICE). Other potential predictors of FV intake and/or loss to follow-up, such as self-reported health conditions, income and employment, were strongly associated with sex, age and/or schooling and had higher amounts of missing data at baseline. Relative increases in variance, fractions of missing information and relative efficiency were tabulated as imputation diagnostics (Supplementary materials 1 and 2), and trace plots were drawn to assess the convergence for imputed variables (Supplementary material 3). Frequency of FV intake was imputed using ordinal logistic regressions, while linear regressions were used to impute data on FV servings(Reference Carvalho, Lopes and Freitas21).
Proportions and 95% confidence intervals (CI) were employed to describe participants’ characteristics and FV intake, stratified by randomisation. Between-group differences were assessed using chi-square tests, t tests and logistic regressions.
Associations of randomisation and participants’ characteristics with follow-up FV intakes were tested in bivariate models, and participants’ characteristics were used as adjustment variables. Adjusted mean intakes of FV at 12, 36 and 48 months were estimated using linear regression models using randomisation as the exposure, and adjusted by sex, age, schooling, baseline intake, time since joining PAS and baseline BMI.
Unadjusted and adjusted generalised estimating equations models were estimated to investigate the effects of time, and the interaction between time and randomisation on FV intakes. FV intakes at each follow-up were treated as outcomes and tested for normality. Due to their normal distribution, we employed the following model specifications: a normal family for data distribution, an identity link function, an unstructured correlation structure, and bootstrap standard errors. Covariates potentially associated with outcomes were included for adjustment in a backward order and removed in case of multicollinearity.
Results
We assessed 2241 participants at 12 months after baseline (936 from the IG and 1305 from the CG) and identified positive changes in FV intake among 1461 of them (638 IG participants and 823 CG participants). After multiple imputation of missing outcome data for the 1173 participants who were lost to follow-up at 12 months, we identified an additional 771 participants (349 from the IG and 422 from the CG) whose imputed data for FV intake at 12 months fulfilled the criteria for positive changes in intake. Therefore, these participants were included in the final sample, totalling 987 IG and 1245 CG participants in our analyses. Our sample of 2232 study participants represented 66·6 % of the initial IG sample and 64·5 % of the initial CG sample. Participant flow is shown in Figure 1.
CONSORT flowchart.

Among these 2232 participants with positive changes in FV intake at 12 months, mean fruit intake went from 158·8 g/d at baseline to 202·2 g/d at 12 months, and mean vegetable intake went from 187·6 g/d to 217·3 g/d (data not shown).
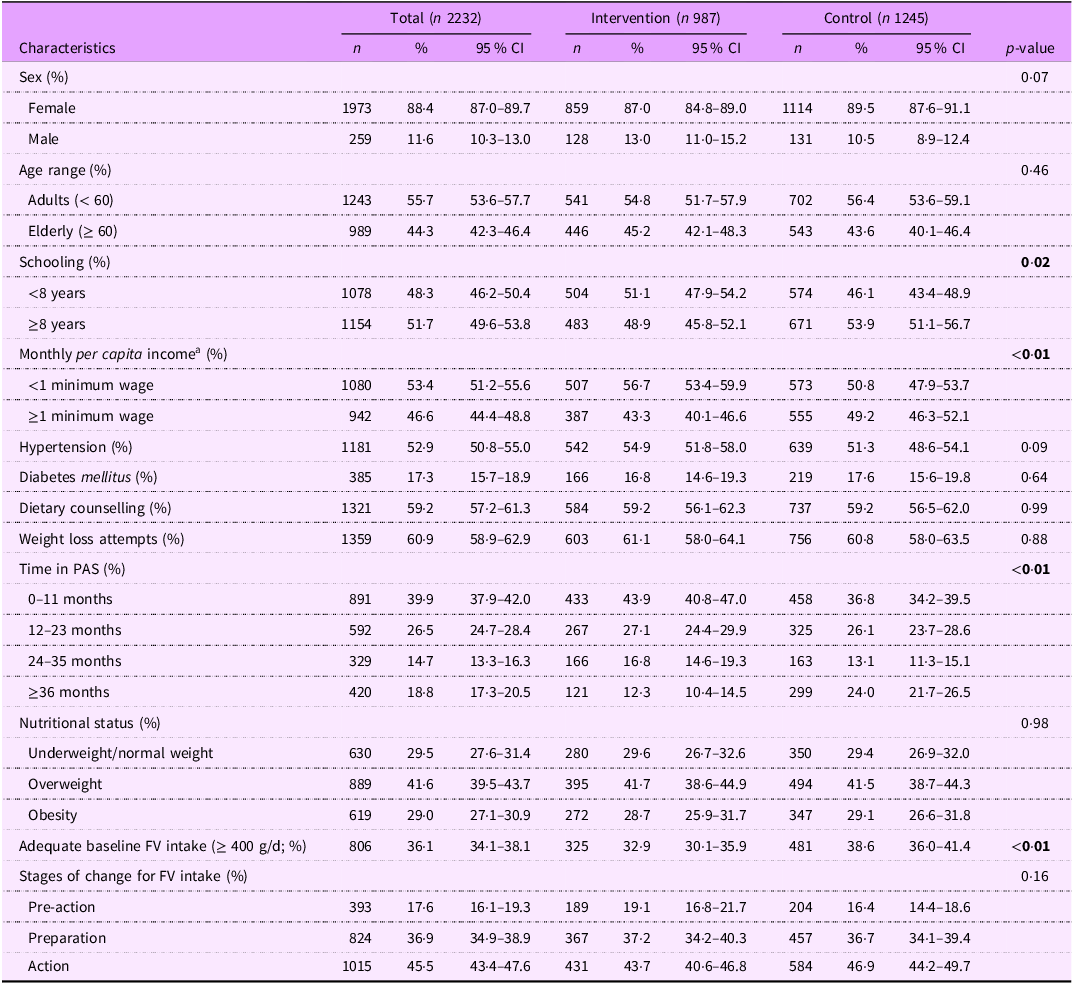
Most participants were adult women with income below minimum wage, and around half had under eight years of schooling. The CG had higher prevalences of participants with eight or more years of schooling (53·9% v. 48·9%, P = 0·02), with per capita income at or above one minimum wage (49·2% v.43·3 %, P < 0·01), who had been in PAS for 36 months or more (24·0% v. 12·3%, P < 0·01), and with adequate FV intake at baseline (38·6% v. 32·9%, P < 0·01) (Table 1).
Baseline characteristics of study participants who had positive changes in FV intake at 12 months. Belo Horizonte, Brazil, 2013–2018

Table 1. Long description
A table comparing characteristics of study participants who had positive changes in fruit and vegetable (FV) intake at 12 months. The table has 14 rows and 12 columns, including headers and statistical data. Columns are labeled with characteristics such as sex, age range, schooling, monthly per capita income, hypertension, diabetes mellitus, dietary counseling, weight loss attempts, time in PAS, nutritional status, adequate baseline FV intake, and stages of change for FV intake. Each characteristic is divided into subcategories with corresponding values for total participants, intervention group, and control group, including percentages and 95% confidence intervals. Notable trends include higher percentages of females, adults under 60, participants with less than 8 years of schooling, and those with income below the minimum wage. The control group shows higher prevalences in several categories, such as schooling, income, time in PAS, and adequate FV intake at baseline.
Note: PAS = Programa Academia da Saúde (Health Academy Program), FV = fruit and vegetables, 95% CI = 95% Confidence Intervals. Bold denotes a statistically significant difference between groups, P < 0.05.
a Average exchange rates from Brazilian Real to USD at baseline: 0.4651 in 2013; 0.4263 in 2014; Brazilian minimum wage at the time of data collection: R$ 678.00 (2013), R$ 724.00 (2014).
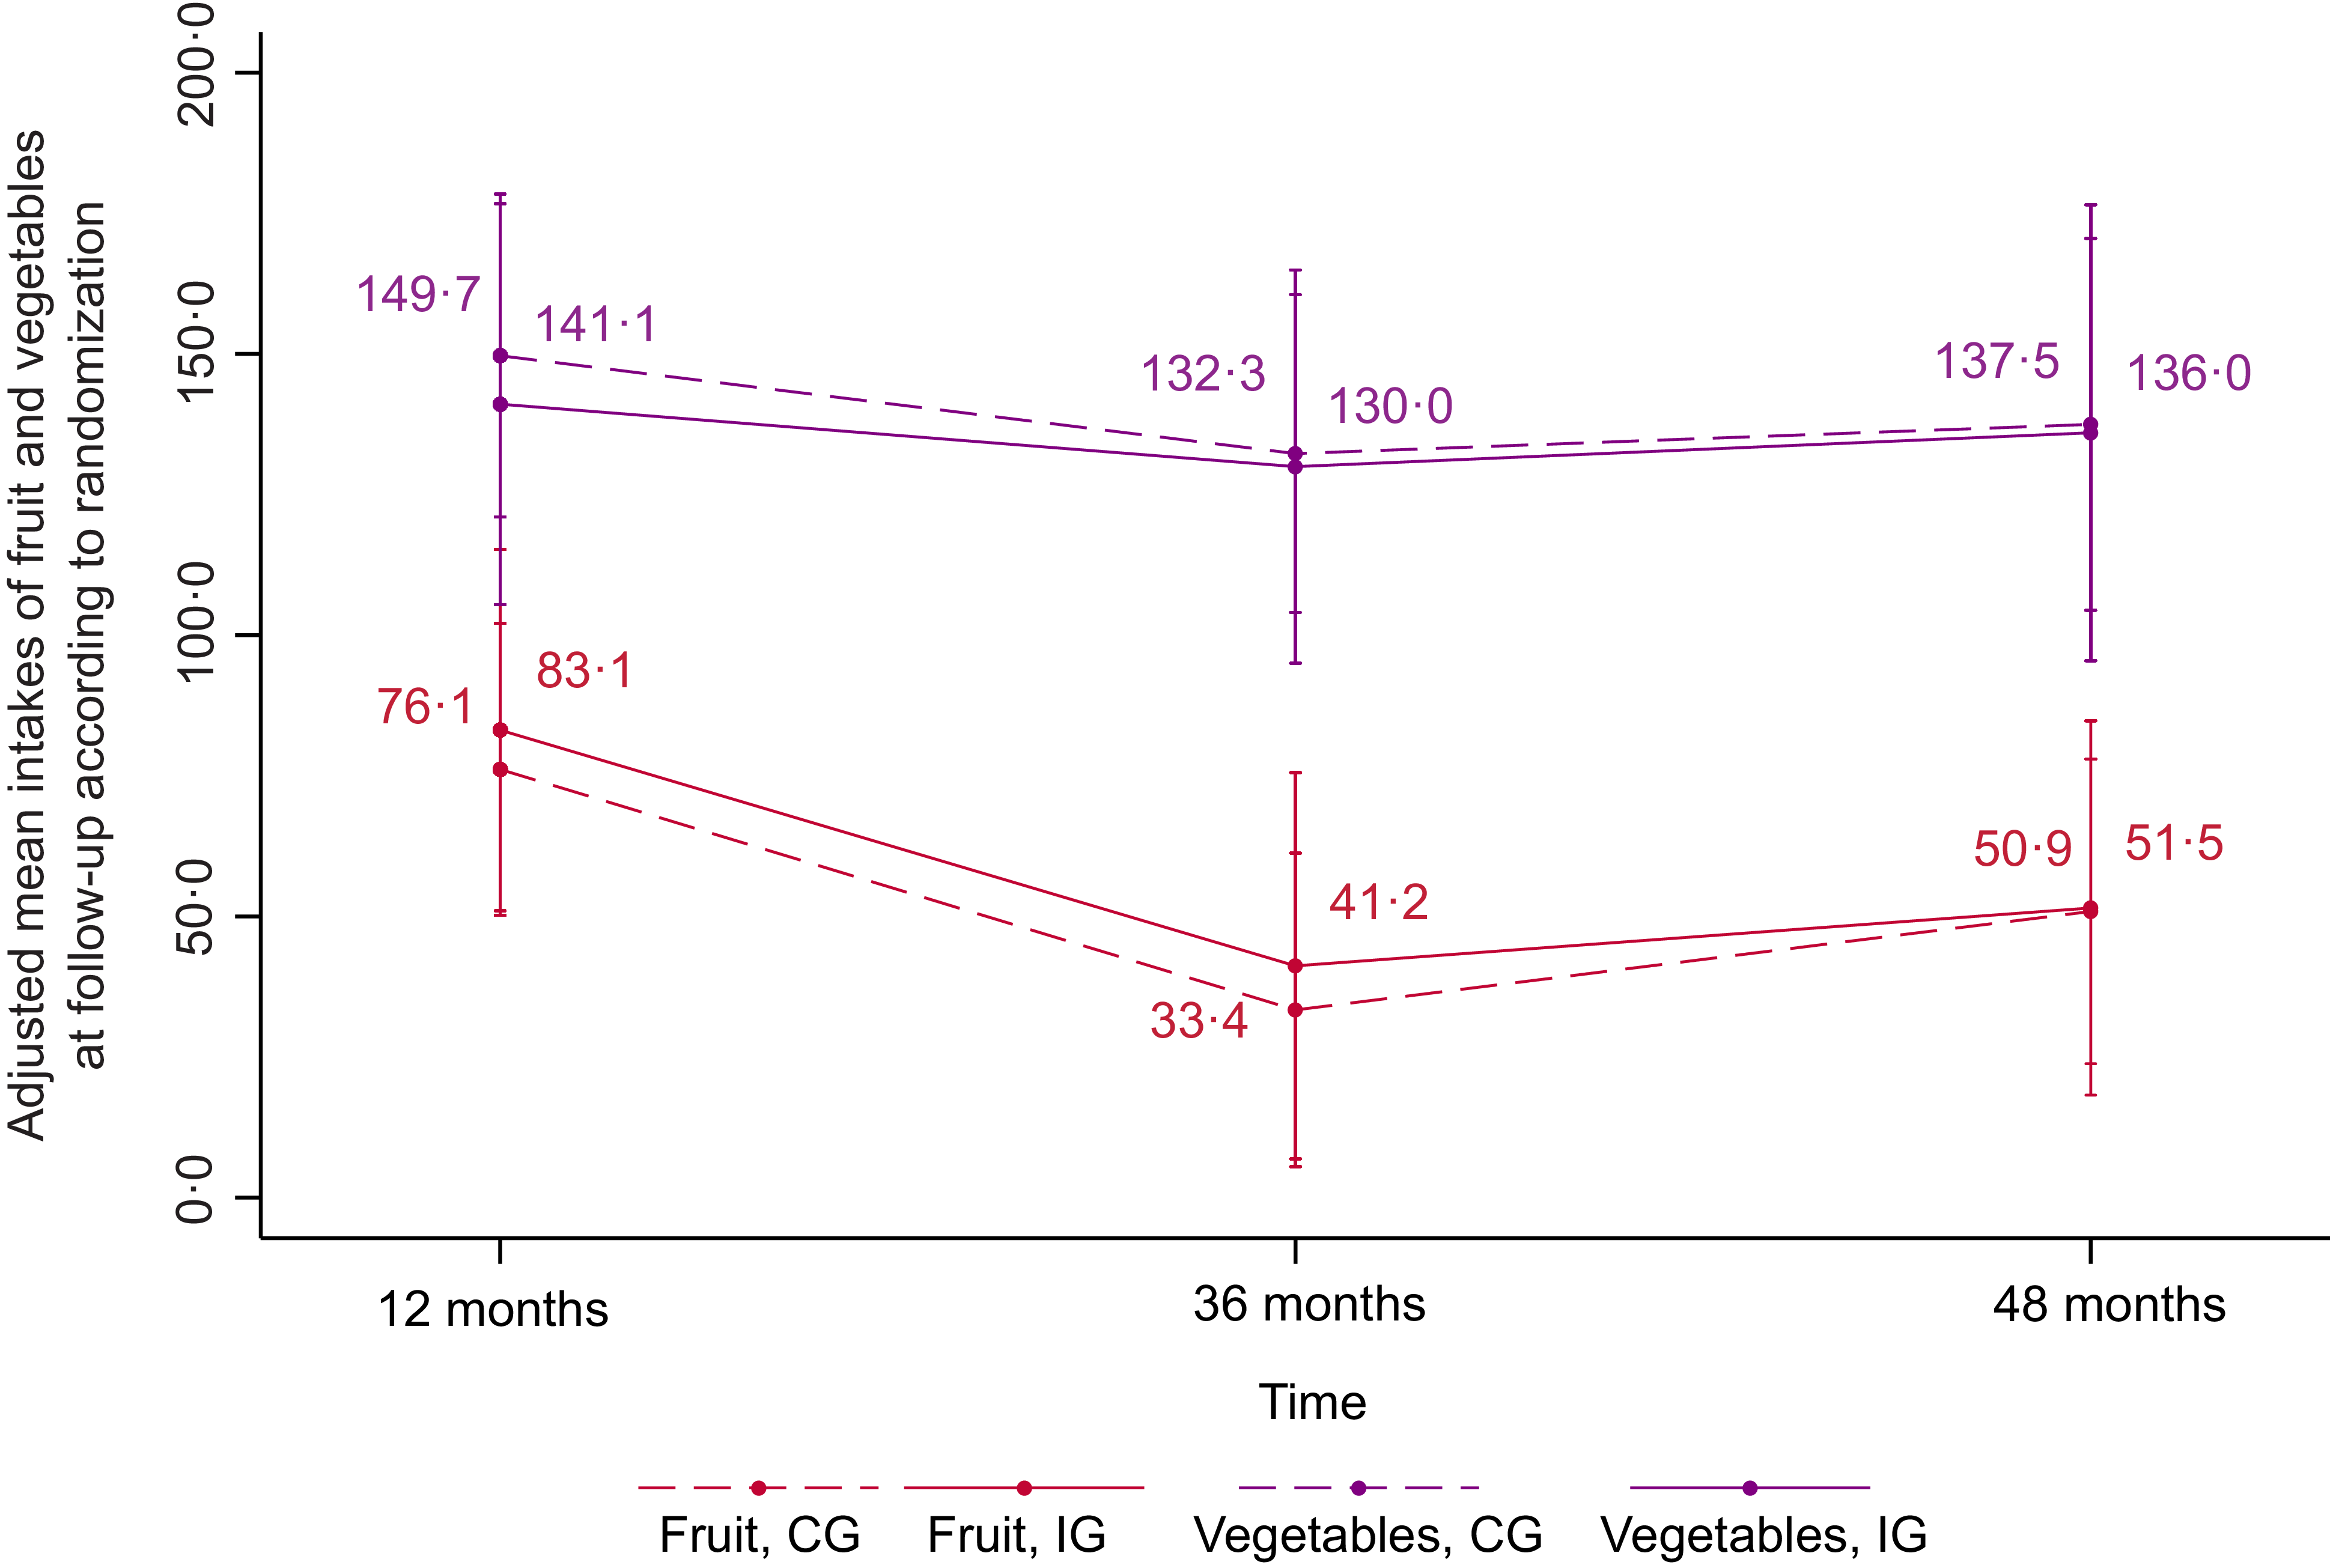
Adjusted mean fruit intakes were different between groups at 12 months: 76·1 g/d in the CG and 83·1 g/d in the IG (P = 0·026). At 36 months, adjusted mean fruit intakes were also different: 33·4 g/d in the CG and 41·2 g/d in the IG (P = 0·017). At 48 months, adjusted mean fruit intakes were no longer different between groups: 50·9 g/d in the CG and 51·5 g/d in the IG (P = 0·846). Adjusted mean vegetable intakes were different between groups at 12 months: 149·7 g/d in the CG and 141·1 g/d in the IG (P = 0·015). At 36 and 48 months, adjusted mean vegetable intakes were no different between groups. At 36 months, mean intakes were 132·3 g/d in the CG and 130·0 g/d in the IG (P = 0·498); at 48 months, 137·5 g/d in the CG and 136·0 g/d in the IG (P = 0·696) (Figure 2).
Adjusted mean daily intakes of fruit and vegetables over time according to randomisation. Belo Horizonte, Brazil, 2013–2018.

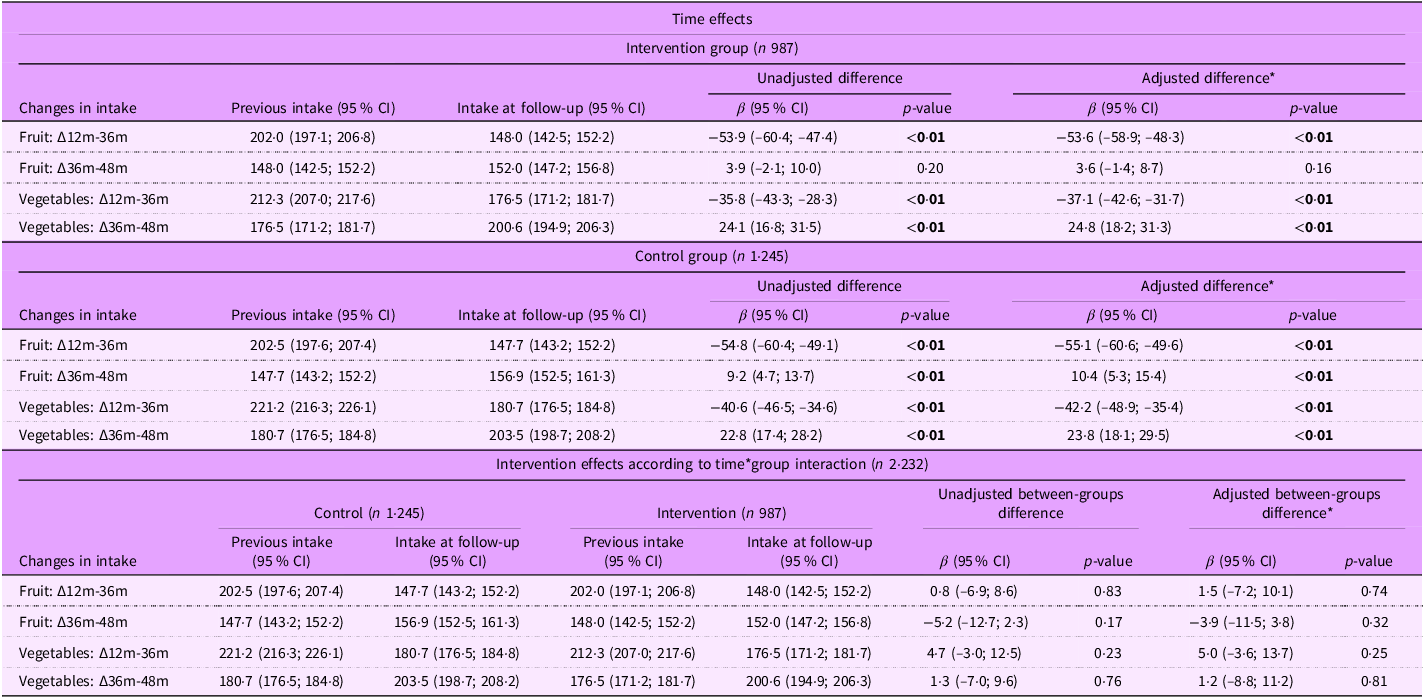
Fruit and vegetable intakes at 36 and 48 months were associated with participants’ characteristics, and these variables were included in adjusted models. Adjusted intra-group analyses at 36 months revealed a significant effect of time on fruit and vegetable intake, which decreased among the CG and the IG. At 48 months, a significant effect of time on vegetable intake was identified within both groups, and an effect of time on fruit intake was identified in the CG. The adjusted interaction terms between time and intervention were not associated with significant changes in fruit or vegetable intake at 36 or 48 months (Table 2).
Changes in fruit and vegetable intake 36 and 48 months after baseline and associations with time and intervention participation. Belo Horizonte, Brazil, 2013–2018

Table 2. Long description
A table comparing changes in fruit and vegetable intake over time in intervention and control groups. The table has 12 rows and 10 columns. Column headers include Changes in intake, Previous intake (95% CI), Intake at follow-up (95% CI), Unadjusted difference β (95% CI), p-value, Adjusted difference β (95% CI), and p-value. Row labels include Fruit: Δ12m-36m, Fruit: Δ36m-48m, Vegetables: Δ12m-36m, and Vegetables: Δ36m-48m for both intervention and control groups. The table also includes a section for intervention effects according to time*group interaction. Notable trends include significant decreases in fruit and vegetable intake in both groups over time, with adjusted differences showing similar patterns.
* Adjustment variables: sex, age, schooling, income, self-reported diabetes, receipt of dietary counselling, attempting to lose weight, time since joining Programa Academia da Saúde, initial change in fruit and vegetables intake, stages of change (all models); baseline fruit intake (fruit, 36 and 48 months); baseline vegetable intake (vegetables, 36 and 48 months).
Discussion
The intervention was not associated with changes in FV intakes at 36 and 48 months after baseline, which means the IG did not maintain initial gains compared to the CG. These results highlight the need for intervention boosters, which will allow individuals to maintain an adequate FV intake over time.
We expected to find an association between intervention participation and the maintenance of FV intakes at 36 and 48 months after baseline due to the theoretical framework of our intervention. In our intervention sessions, we discussed barriers to increase FV intake and supported participants in the elaboration of action plans. However, action planning and coping planning might be more effective if followed by ‘boosters’ after the intervention, allowing individuals to review their plans(Reference Hagger and Luszczynska27). ‘Boosters’ can take place in the form of in-person sessions, printed materials, and/or eHealth strategies(Reference Hagger and Luszczynska27).
Examples of interventions with boosters were published by Tinker(Reference Tinker, Bonds and Margolis10), Pierce et al.(Reference Pierce, Newman and Natarajan11) and Greene et al.(Reference Greene, Fey-Yensan and Padula28). Tinker et al. found that a nutrition intervention promoted increases in FV intake, which were maintained after six years. This intervention included 18 group sessions in the first year, followed by quarterly sessions for five years(Reference Tinker, Bonds and Margolis10). Pierce et al. delivered a 4-year intervention, including telephone counselling and newsletters, followed by cooking classes as a booster. The authors found an increased FV intake at one year within the IG, which was maintained at 4 years(Reference Pierce, Newman and Natarajan11). Greene et al. evaluated a TTM-based intervention with community-dwelling older adults, including monthly stage-tailored printed materials and three coaching calls over one year, which promoted increases in FV intake, 12 and 24 months after baseline(Reference Greene, Fey-Yensan and Padula28).
By contrast, shorter interventions without boosters have revealed that initial increases in FV intake are usually lost 12 months later(Reference Kanera, Willems and Bolman29,Reference Guillaumie, Godin and Manderscheid30) . Kanera et al. and Guillaumie et al. found that increases in vegetable or FV intake at six months were not maintained at 12 months(Reference Kanera, Willems and Bolman29,Reference Guillaumie, Godin and Manderscheid30) .
In our study, the decreases in FV intake between 12 and 36 months after baseline could be due to environmental factors. This time point coincides with an economic and political crisis in Brazil, which impacted individuals’ incomes and access to health services(Reference da Silva, Teixeira and Prates17). Initial increases in FV intakes might have become unsustainable, which could partially explain the lack of an association between the intervention and the maintenance of initial increases(Reference da Silva, Teixeira and Prates17). This can also be partially explained by the fact that, at 36 months, larger decreases in FV intake were found among participants with lower education levels and a lower income.
Increases in FV intake from 36 to 48 months after baseline were also not associated with the intervention, and might reflect an attenuation of the crisis(Reference Kwasnicka, Dombrowski and White8). We found a larger increase in fruit intake at 48 months among CG individuals with lower education levels and a larger increase in vegetable intake among IG individuals with a lower income. Staying in a health promotion service might have helped individuals overcome lapses and relapses(Reference de Deus Mendonça, Lopes and de Carvalho31).
Nonetheless, this effect of time on fruit intake at 48 months was only observed among the CG. We hypothesise that increasing intakes of both FV was easier for individuals in the CG because of their higher income and education levels, which could have allowed them to increase intakes of both food groups simultaneously(Reference Kwasnicka, Dombrowski and White8,Reference da Silva, Teixeira and Prates17) . Meanwhile, IG participants might have chosen vegetables as the food group whose intake would be easier to change, since simultaneous changes might have been unfeasible for them(Reference da Silva, Teixeira and Prates17). When individuals with limited resources are faced with changing more than one health behaviour, they might choose an easier behaviour to modify first, and changes in the first behaviour can facilitate further changes in a second behaviour(Reference Fleig, Lippke and Pomp32,Reference Johnson, Paiva and Mauriello33) .
Food environments might also have influenced participants’ FV intake over time. Food environments around PHC services are usually unhealthy, with a high availability of ready-to-eat foods, while FV are low-quality and not frequently advertised(Reference Horta, Souza and Freitas34,Reference Lopes, Martiniano and Freitas35) . Our results highlight that it is challenging for individuals to maintain increased FV intakes in an unfavourable context. Thus, food environments within and around PAS units should be modified with community gardens, mobile FV markets, and other food security policies(Reference Lopes, de Menezes and de Araújo36).
As shown above, individual and contextual factors influence health behaviour change and maintenance; however, it is not clear which theoretical constructs and mechanisms are involved in the maintenance of intervention effects after behaviour change is initiated. A systematic review has identified five factors that potentially explain the maintenance of health behaviour change: (1) different reasons to initiate change and to maintain it; (2) individual skills affect behaviour self-regulation; (3) turning a behaviour into a habit favours maintenance; (4) physical and mental resources are required for self-regulation; and (5) environmental factors can facilitate or hinder individual efforts(Reference Kwasnicka, Dombrowski and White8). Therefore, initiation of behaviour change does not equal behaviour change maintenance(Reference Kwasnicka, Dombrowski and White8).
Based on our results, we suggest that PHC services such as PAS include booster food and nutrition education activities in their routine(Reference Hagger and Luszczynska27). Within this health promotion service, usual care after the intervention should include continuing food and nutrition education, such as discussions on FV intake, that would boost the previous intervention and could encourage the maintenance of behaviour change. Boosters can include either the repetition of intervention strategies or simplified strategies(Reference Kwasnicka, Dombrowski and White8,Reference Hagger and Luszczynska27) .
Limitations and strengths
Our results should be interpreted in light of the following limitations: first, all estimates of FV intake were self-reported. However, instruments for assessing FV intake were validated with our population(Reference Lopes, dos Santos and Lopes23,Reference de Carvalho, Lopes and de Freitas37) . Second, our sample of mostly female participants is not representative of the general population. However, analyses were adjusted for sex. Furthermore, the predominance of women in our sample reflects PHC service participants in Brazil, where over 70 % of the population depends on the Unified Health System(Reference Pinto, Quesada and D’Avila38). Loss to follow-up is also a limitation, which was addressed with multiple imputation.
On the other hand, the length of our follow-up is longer than is usually assessed in randomised controlled community trials. This allowed us to verify that intervention effects were not maintained for a longer period, and that boosters might be necessary over time. Our large sample size and our procedures for quality assurance and control are further strengths.
Conclusion
We conclude that TTM-based intervention participants did not maintain initial changes in FV intake over time. Therefore, we suggest that theory-based interventions be followed by boosters in the routine of health promotion services, and that food environments around and within these services be modified to facilitate the maintenance of increased FV intake over time.
Supplementary material
To view supplementary material for this article, please visit https://doi.org/10.1017/S1368980026103565
Data availability statement
The datasets generated and/or analysed during the current study are not publicly available due to confidentiality of data but are available from the corresponding author on reasonable request.
Acknowledgements
Not applicable.
Author contributions
MCRC: Data curation; Formal analysis; Investigation; Methodology; Writing – original draft; Writing – review & editing; MSL: Investigation; Writing – review & editing; PPF: Investigation; Writing – review & editing; ACSL: Conceptualisation; Funding acquisition; Methodology; Project administration; Resources; Supervision; Writing – review & editing.
Financial support
This work was supported by the Minas Gerais State Research Support Foundation (Fundação de Amparo à Pesquisa do Estado de Minas Gerais, FAPEMIG) [grant numbers APQ-033376-12, PPM-00254-15]; the Coordination for the Improvement of Higher Education Personnel (Coordenação de Aperfeiçoamento de Pessoal de Nível Superior, CAPES) [finance code 001]; and the National Council of Scientific and Technological Development (Conselho Nacional de Desenvolvimento Científico e Tecnológico, CNPq) [grant numbers 476686/2013-0 and 408136/2017-0, research productivity scholarship number 302451/2022-6 for ACSL]. The funders had no role in the study design, collection, analysis and interpretation of data, in the writing of the report and in the decision to submit the article for publication.
Competing interests
The authors declare that they have no competing interests.
Ethical standards
The recommendations from the Declaration of Helsinki were thoroughly followed during the trial and follow-up. Our project received approval from Institutional Review Boards at the University and the City Hall. PAS participants were informed about the trial, and written informed consent was obtained from all participants before data collection was performed.
Consent for publication
Not applicable.



 Open access

