1. Introduction
Detonation is characterised by the coupling between a leading shock wave and subsequent chemical reactions (Lee Reference Lee2008). The post-shock reaction process determines detonation characteristics, particularly the cellular structure (Lee Reference Lee2008). While a single-cellular detonation typically forms in mixtures with a continuous exothermic reaction process, two-stage reactions in certain mixtures can produce double-cellular structure characterised by hierarchical cell patterns – smaller detonation cells nested within larger cellular frameworks (Vasil’ev et al. Reference Vasil’ev, Vasiliev and Trotsyuk2010; Zhang Reference Zhang2012).
The seminal experimental work by Presles et al. (Reference Presles, Desbordes, Guirard and Guerraud1996) first identified double-cellular structures in nitromethane/oxygen mixtures. Subsequently, Sturtzer et al. (Reference Sturtzer, Lamoureux, Matignon, Desbordes and Presles2005) analysed the Zeldovich–von Neumann–Döring (ZND) structure of nitromethane/oxygen mixtures. They proposed that two-stage reactions were responsible for the formation of the double-cellular structure. Similar double-cellular structures were observed and interpreted separately by Diakow et al. (Reference Diakow, Cross and Ciccarelli2015) and Ng et al. (Reference Ng, Chao, Yatsufusa and Lee2009) in dimethyl ether/oxygen mixtures. Fuel blending can effectively induce multi-stage reactions and thereby lead to the formation of double-cellular structures. For example, Joubert et al. (Reference Joubert, Desbordes and Presles2008) observed double-cellular detonation waves in H2, CH4 and C2H6 blended with NO2/N2O4. Besides, Virot et al. (Reference Virot, Khasainov, Desbordes and Presles2010) experimentally evaluated the effect of pressure on detonation structures in H2–NO2/N2O4–Ar mixtures. They found that reducing the initial pressure inhibits the formation of large-scale cellular structure, resulting in single-cellular detonation propagating at speed lower than the Chapman–Jouguet (CJ) speed. They attributed this transition in cellular structure with varying pressure to losses.
Despite experimental advances, resolving the spatiotemporal complexity of double-cellular detonation remains challenging due to diagnostic limitations. Numerical simulation has therefore become an indispensable tool for mechanistic investigation of cellular structure. The inherent multi-scale nature of double-cellular detonation imposes conflicting resolution requirements: fine grids necessary for resolving micron-scale reaction fronts versus large domains needed to capture metre-scale cellular dynamics. This computational dichotomy explains the scarcity of high-fidelity simulations. A clear double-cellular structure was reported in few studies, including the work of Davidenko et al. (Reference Davidenko, Mével and Dupré2011), who simulated double-cellular detonation propagating in H2–NO2/N2O4 mixtures using a reduced chemistry model.
To reduce computational cost, researchers have employed reduced two-step reaction mechanisms to study double-cellular detonation. Guilly et al. (Reference Guilly, Khasainov, Presles and Desbordes2006) demonstrated double-cellular reproducibility using sequential reaction model, A→B→C. Khasainov et al. (Reference Khasainov, Virot, Presles and Desbordes2012) employed the same sequential reaction model to examine the effects of the ratio between the induction lengths associated with the first and second reaction steps on the cellular structure. They also found that comparable heat release from both reaction steps facilitates the formation of a distinct double-cellular structure. Furthermore, Sugiyama and Matsuo (Reference Sugiyama and Matsuo2011) demonstrated that reducing the channel width can induce the transition from double-cellular detonation to single-cellular detonation using a two-step reaction model.
Besides, double-cellular structures have also been reported when detonation waves propagate through non-uniform mixtures, such as those with periodically varying equivalence ratios (Xi et al. Reference Xi, Teng, Chen and Yang2022; Wang et al. Reference Wang, Huang, Deiterding, Chen and Chen2023). In these cases, local auto-ignition and explosion events are triggered as the detonation wave enters high-reactivity regions, resulting in re-initiation of the detonation. Conversely, as the wave passes through low-reactivity regions, partial quenching may occur. This periodic extinction and re-initiation process leads to the development of large-scale cellular patterns, giving rise to double-cellular structures.
In the present work, we focus solely on the cellular structures arising in homogeneous mixtures exhibiting multi-stage reaction characteristics. Collectively, the aforementioned studies suggest that the transition from double- to single-cellular detonation can be facilitated by enhancing losses and reducing channel width (Virot et al. Reference Virot, Khasainov, Desbordes and Presles2010; Sugiyama & Matsuo Reference Sugiyama and Matsuo2011). However, a fundamental question remains unanswered: can distinct cellular regimes (single versus double) coexist in identical mixtures under uniform operational conditions through initiation control? Besides, the simulations of both Vasilev et al. (Reference Vasil’ev, Vasiliev and Trotsyuk2010) and Mével et al. (Reference Mével and Gallier2018) indicate that a two-stage exothermic process is not a sufficient condition for the formation of double-cellular detonation. This suggests that the mechanism underlying double-cellular detonation formation is still not fully understood and requires further investigation. These knowledge gaps motivate our systematic investigation.
The present study employs two-dimensional simulations with detailed chemical kinetics to explore the transient detonation initiation and propagation in C2H4/O2/O3/N2 mixtures. Ozone is introduced into the mixture to induce two-stage reactions during ethylene oxidation (Sun et al. Reference Sun, Wang, Tian and Chen2023). The remainder of the paper is organised as follows. Section 2 describes the numerical model and methodology. Section 3 presents simulations of typical double-cellular detonation waves, and examines the conditions for their formation. Section 4 investigates the effect of initiation strength on detonation propagation, and analyses the dynamics and reactive features of the low-speed single-cellular detonation. Section 5 compares the thermodynamic characteristics of the two detonation regimes, and explains the transition from the low-speed single-cellular to the double-cellular mode. Section 6 summarises the key findings.
2. Model and numerical methodology
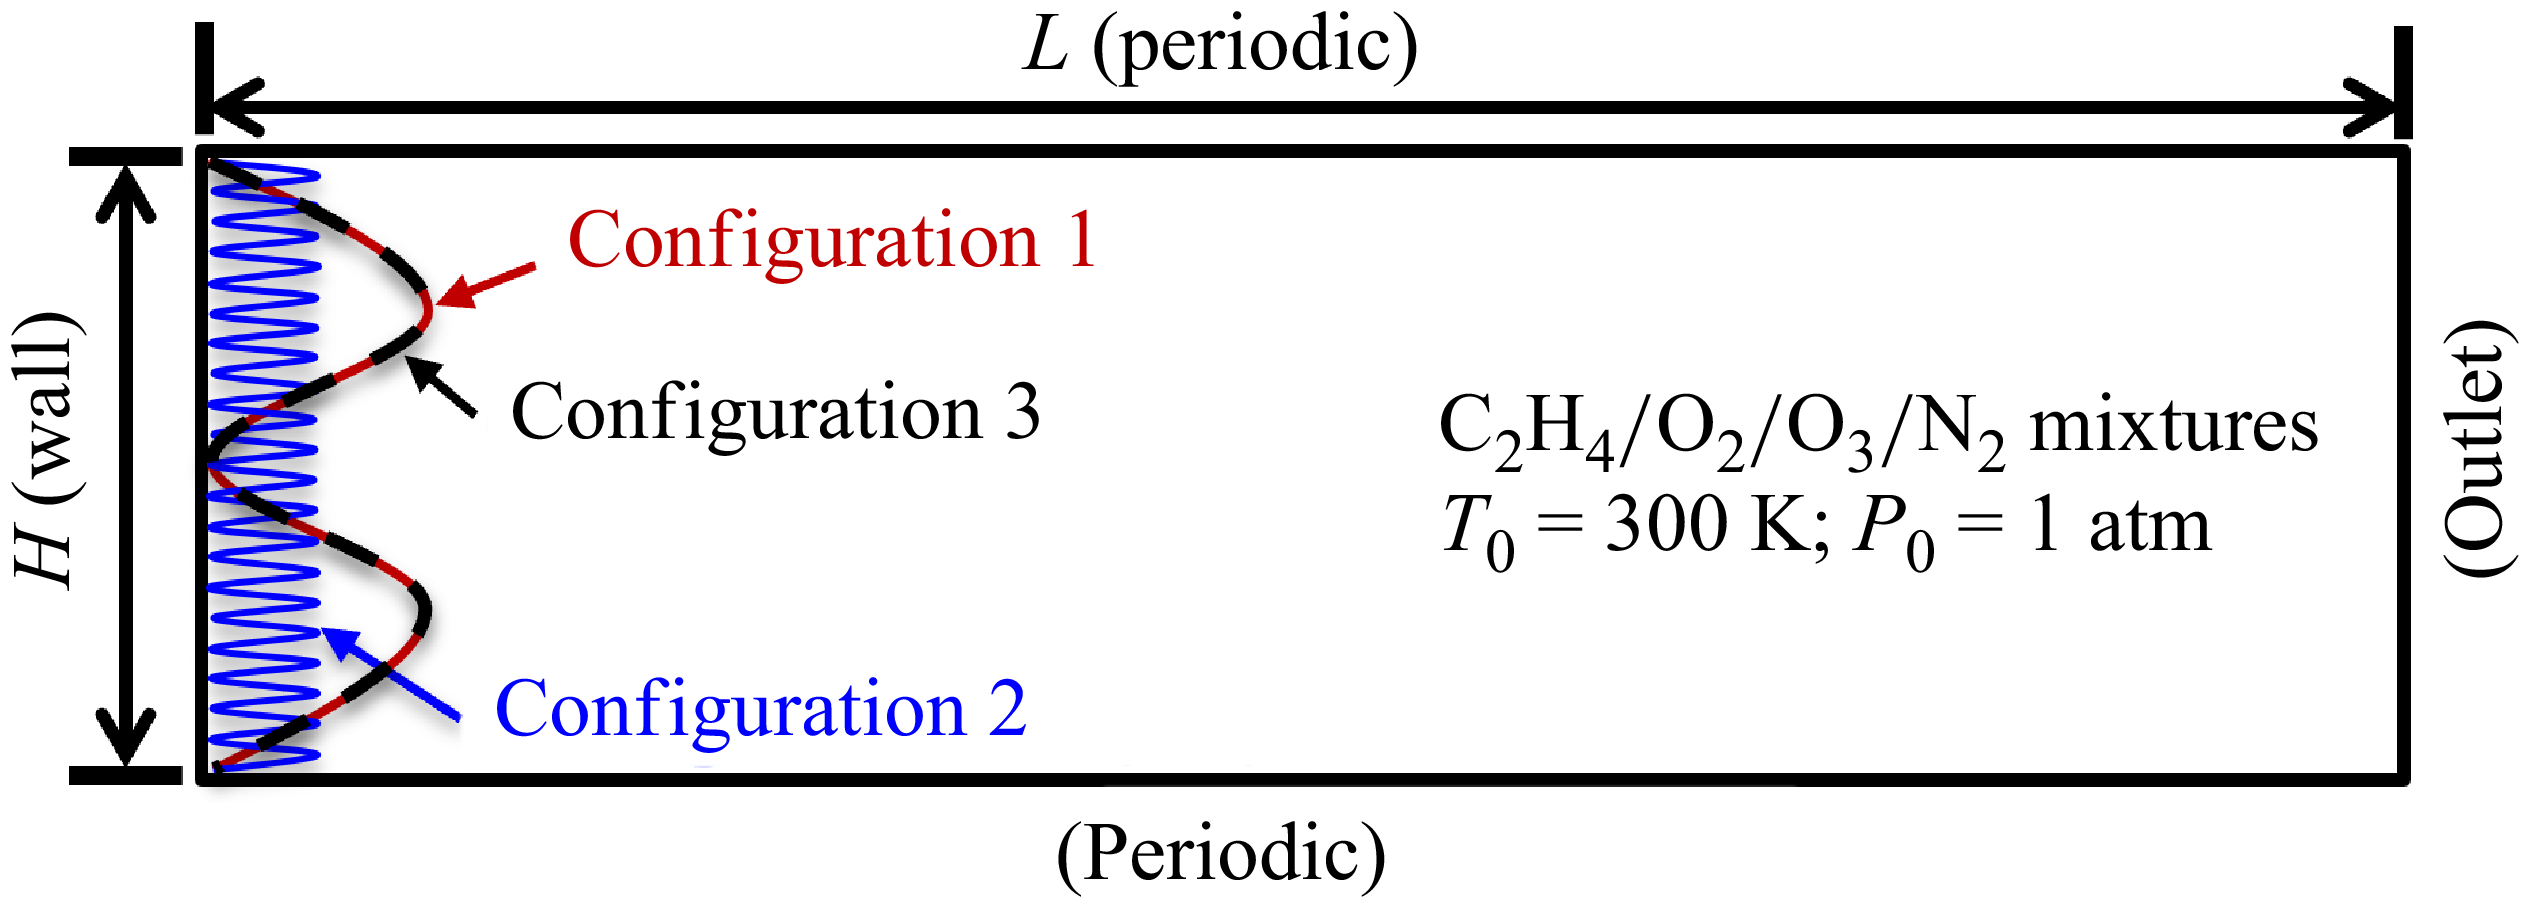
The computational domain configuration is schematically illustrated in figure 1. Initially, the domain is filled with a static C2H4/O2/O3/N2 mixture at T
0 = 300 K and P
0 = 1 atm. Specifically, XC2H4 : XO2 : XO3 : XN2 = 1 : 3(1−
 $\kappa $
) : 2
 $\kappa $
: 20, where
 $\kappa $
is defined as 3XO3/(2XO2 + 3XO3) and changed to regulate the reaction process behind the leading shock. The numerical framework employs a rectangular domain defined by length L = 100 mm and width H = 10 mm, with adiabatic no-slip left boundary, supersonic outflow right boundary, and periodic lateral boundaries. Detonation initiation is achieved through three distinct initiation configurations (configurations 1, 2 and 3 in figure 1) with high pressure Ph
and temperature Th
.
 \begin{equation} \begin{array}{l} \text{Configuration }1\colon\!\!\quad\!\! {P}_{{h}}=30\ \mathrm{atm},\ {T}_{{h}}=3000\ \mathrm{K}\quad\!\! \mathrm{for}\ 0\lt {x}\lt |5\sin \left(200\pi {y}\right)\!|+0.5\text{ mm}.\\ \text{Configuration }2\colon\!\!\quad\!\! {P}_{{h}}=20\ \mathrm{atm},\ {T}_{{h}}=2000\ \mathrm{K}\quad\!\! \mathrm{for}\ 0\lt {x}\lt |0.5\sin \left(4000\pi {y}\right)\!|+0.5\text{ mm}.\\ \text{Configuration }3\colon\quad\!\!\!\! {P}_{{h}}=10\ \mathrm{atm},\ {T}_{{h}}=2000\ \mathrm{K}\quad\!\! \mathrm{for}\ 0\lt {x}\lt |5\sin \left(200\pi {y}\right)\!|+0.5\text{ mm}. \end{array} \end{equation}
Schematic of the simulation domain and settings.

Compared to the initiation setting in configuration 1, configurations 2 and 3 feature lower pressure and temperature in initiation zones, representing lower initiation energies. Besides, configuration 3 shares the same sinusoidal perturbation profile as configuration 1.
The simulations utilise the open-source detonationFoam solver (Sun et al. Reference Sun, Wang, Tian and Chen2023), in which the governing equations for multi-component, compressible, reactive flow are solved using the finite volume method. The solver detonationFoam has been thoroughly validated and used for simulating gaseous detonation (Sun et al. Reference Sun, Yang, Wang and Chen2024, Reference Sun, Yu, Yang, Wang, Wang and Chen2025, Reference Sun, Yu, Yang, Wang, Wang and Chen2025); and the detailed descriptions of the governing equations, numerical methods and validations can be found in Sun et al. (Reference Sun, Wang, Tian and Chen2023). The numerical methods used are as follows. For the spatial discretisation, the second-order MUSCL scheme (Leer Reference van Leer1979) is used for reconstruction, and the pressure-corrected approximate Riemann solver HLLC-P (Xie et al. Reference Xie, Zhang, Lai and Li2018) is employed to calculate the convection fluxes. Diffusion terms are treated with a second-order central difference scheme, while time integration is performed using the implicit Euler method. The stiff ordinary differential equation solver seulex (Hairer, Nørsett & Wanner Reference Hairer, Nørsett and Wanner1996) is used to handle the chemical reactions. In all simulations, we incorporate the reduced kinetic model for ethylene oxidation coupled with an ozone sub-kinetic model (Wang et al. Reference Wang, Yang, Li, Li, Sun, Aldén, Cen and Konnov2012; Gao et al. Reference Gao, Zhang, Adusumilli, Seitzman, Sun, Ombrello and Carter2015). This model consists of 45 species and 289 elementary reactions. To balance resolution requirements, adaptive mesh refinement (Rettenmaier et al. Reference Rettenmaier, Deising, Ouedraogo, Gjonaj, Gersem, Bothe, Tropea and Marschall2019) is employed. Specifically, we use uniform grids with resolution 10 μm along with a two-level mesh refinement strategy that yields minimum grid size 2.5 μm. Grid convergence is checked in the supplementary material.
3. The double-cellular detonation
3.1. Propagation and structure of the double-cellular detonation
First,
 $\kappa $
is fixed at 0.6, and the corresponding ZND structure of the C2H4/O2/O3/N2 mixture is illustrated in figure 2. The thermicity (σ) distribution (figure 2a
) exhibits dual peaks separated by a local minimum at xm
= 1.3 mm. Heat release in region x < xm
is caused by the first-stage reaction and defined as Q
1, while heat release caused by the second-stage reaction in region x > xm
is defined as Q
2. The ratio of Q
2 to Q
1 will be used to assess the formation conditions of double-cellular structures in § 3.2. The first stage (x < xm
) features complete O3 depletion and partial C2H4 consumption as well as significant heat release. Analysis of key reactions in the supplementary material reveals that heat release primarily stems from ozone decomposition and reactions involving C2H4/CH3 and O radicals. The second stage (x > xm
) completes fuel oxidation with a second-stage heat release. The induction length (
 $\unicode{x1D6E5} _{\kern-1pt I}$
) is defined as the distance from the leading shock to the peak thermicity. The first-stage induction length is
 $\unicode{x1D6E5} _{\kern-1pt I1}$
= 3.6 μm, while the second-stage induction length is
 $\unicode{x1D6E5} _{\kern-1pt I2}$
= 323.2 μm. Figure 2(b) presents the pressure and temperature profiles of the ZND structure. At the von Neumann peak (x = 0), the pressure and temperature reach 29.8 atm and 1480 K, respectively. As the two-stage reaction progresses, the temperature continues to rise, while the pressure behind the leading shock gradually decreases.
(a) The mass fractions of C2H4 and O3, thermicity. (b) Pressure and temperature profiles of the ZND structure, with
 $\kappa $
= 0.6. The leading shock is located at x = 0. Here,
 $\unicode{x1D6E5} $
I1 denotes induction length of the first-stage reaction,
 $\unicode{x1D6E5} $
I2 denotes induction length of the second-stage reaction, and xm
denotes position of the local minimum thermicity.

Figure 3 displays the triple-point trajectories of detonation initiated by configuration 1. It shows that stable double-cellularity immediately establishes, with macro-cells containing approximately 240 micro-cells. The width of the large-scale detonation cell, λ, is 4.3 mm, which is approximately 13 times the induction length. This ratio falls within the typical experimental range 10–100 (Zhang Reference Zhang2012). Figure 4(a) further shows the transient numerical soot foil, while the corresponding wave structures are depicted in figure 4(b). The triple-shock configurations – comprising Mach stem (MS), incident shock wave (ISW) and transverse wave (TW) – govern macroscopic cell formation (figure 4 b). The movement of the triple point generates the large cells observed in figure 4(a). Additionally, finer triple-shock configurations appear at the fronts of the MS and ISW in figure 4(b), with their trajectories giving rise to the finer detonation cells shown in figure 4(a). To further examine the reaction zone, we plot the temperature and C2H4 mass fraction distributions in figures 4(c) and 4(d), respectively. Behind the ISW, the temperature reaches approximately 1970 K, enabling partial C2H4 consumption through the first-stage reaction. As the detonation wave propagates, the remaining mixture reacts behind the MS after being compressed by the transverse wave, triggering the second-stage reaction. This process increases the temperature to 2520 K, achieving near-complete C2H4 consumption. These results indicate that the first-stage reaction leads to small cellular structures, while the second-stage reaction results in large detonation cells.
Numerical soot foil of detonation propagation process initiated by configuration 1 for mixture with
 $\kappa $
= 0.6. Here, λ is the width of the large detonation cell.

(a) Numerical soot foil, (b) density gradient, (c) temperature and (d) C2H4 mass fraction contours at t = 27 μs for the detonation wave initiated by configuration 1, with
 $\kappa $
= 0.6. Here, ISW is incident shock wave, MS is Mach stem, and TW is transverse wave.

3.2. Conditions for the formation of double-cellular structure
Next, the two-stage reaction process behind the leading shock is adjusted by changing the value of
 $\kappa $
. The numerical soot foils for
 $\kappa $
= 0.2, 0.4, 0.6 and 0.8 are shown in figure 5. When
 $\kappa $
= 0.2, single-scale detonation cells are observed in figure 5(a). Although weak triple-point trajectories are present within the large detonation cells, no stable small detonation cells form. As
 $\kappa $
increases to 0.4 and 0.6, the corresponding results in figure 5(b,c) reveal obvious double-cellular structures, where small detonation cells fill the larger ones. When
 $\kappa $
= 0.8, figure 5(d) shows that the single-cellular detonation propagates with only small cells. These results clearly demonstrate that the influence of
 $\kappa $
on the detonation structure (i.e. single- and double-cellular detonation) is non-monotonic.
Numerical soot foils of the detonation propagation processes for (a)
 $\kappa $
= 0.2, (b)
 $\kappa $
= 0.4, (c)
 $\kappa $
= 0.6 and (d)
 $\kappa $
= 0.8.

To investigate how
 $\kappa $
affects the detonation regimes, thermicity profiles of ZND structures for
 $\kappa $
= 0.2, 0.4, 0.6 and 0.8 are plotted in figure 6(a). The results indicate that the reactions proceed in two stages for all cases. This further confirms that two-stage exothermicity is not a sufficient condition for the emergence of double-cellular structures. The ratio of induction lengths between the second-stage reaction and the first-stage reaction,
 $\unicode{x1D6E5} _{\kern-1pt I2}$
/
 $\unicode{x1D6E5} _{\kern-1pt I1}$
, is introduced to examine the correlation between the two-stage reactions. When
 $\unicode{x1D6E5} _{\kern-1pt I2}$
/
 $\unicode{x1D6E5} _{\kern-1pt I1}$
is large, the reactions of the two stages proceed more independently. Figure 6(b) shows that as
 $\kappa $
increases from 0.2 to 0.4, 0.6 and 0.8,
 $\unicode{x1D6E5} _{\kern-1pt I2}$
/
 $\unicode{x1D6E5} _{\kern-1pt I1}$
decreases from 158.7 to 126.4, 86.1 and 53.7, respectively. Hence for
 $\kappa $
= 0.8 shown in figure 5(d), the reactions of the two stages proceed in a highly coupled manner, thereby no obvious double-cellular structures are observed.
(a) Thermicity profiles; (b)
 $\unicode{x1D6E5} $
I2/
 $\unicode{x1D6E5} $
I1 and Q
2/Q
1 for different values of
 $\kappa $
. Here,
 $\unicode{x1D6E5} $
I2/
 $\unicode{x1D6E5} $
I1is the ratio of induction lengths between the second-stage reaction and the first-stage reaction, and Q
2/Q
1 is the ratio of the heat release in the second stage to that in the first stage.

In figure 6(b), the ratios of heat release in the second stage to that in the first stage, Q
2/Q
1, are also calculated. The results show that as
 $\kappa $
increases, Q
2/Q
1 decreases and trends towards 1. According to Khasainov et al. (Reference Khasainov, Virot, Presles and Desbordes2012), similar heat effects from both reaction stages facilitate the formation of double-cellular structures. For
 $\kappa = 0.2$
, the heat release from the first-stage reaction accounts for only 24.2 % of the total value, which is too low to sustain detonation wave propagation. As a result, the triple-shock structures cannot survive; their trajectories weaken during detonation propagation, and no obvious small detonation cells are observed (see figure 5
a).
Qualitatively, two conditions are required for the formation of double-cellular detonation: the reactions of the two stages must proceed as independently as possible, and the heat releases from both stages must be high enough to maintain the triple-shock structures. Consequently, double-cellular structures are observed only for cases
 $\kappa $
= 0.4 and 0.6 in this subsection, and the influence of
 $\kappa $
on the cellular detonation structure is non-monotonic.
4. The low-speed single-cellular detonation
4.1. Propagation of the detonation induced by weak initiation configurations
To further investigate the effect of initiation energy, detonation is induced for
 $\kappa $
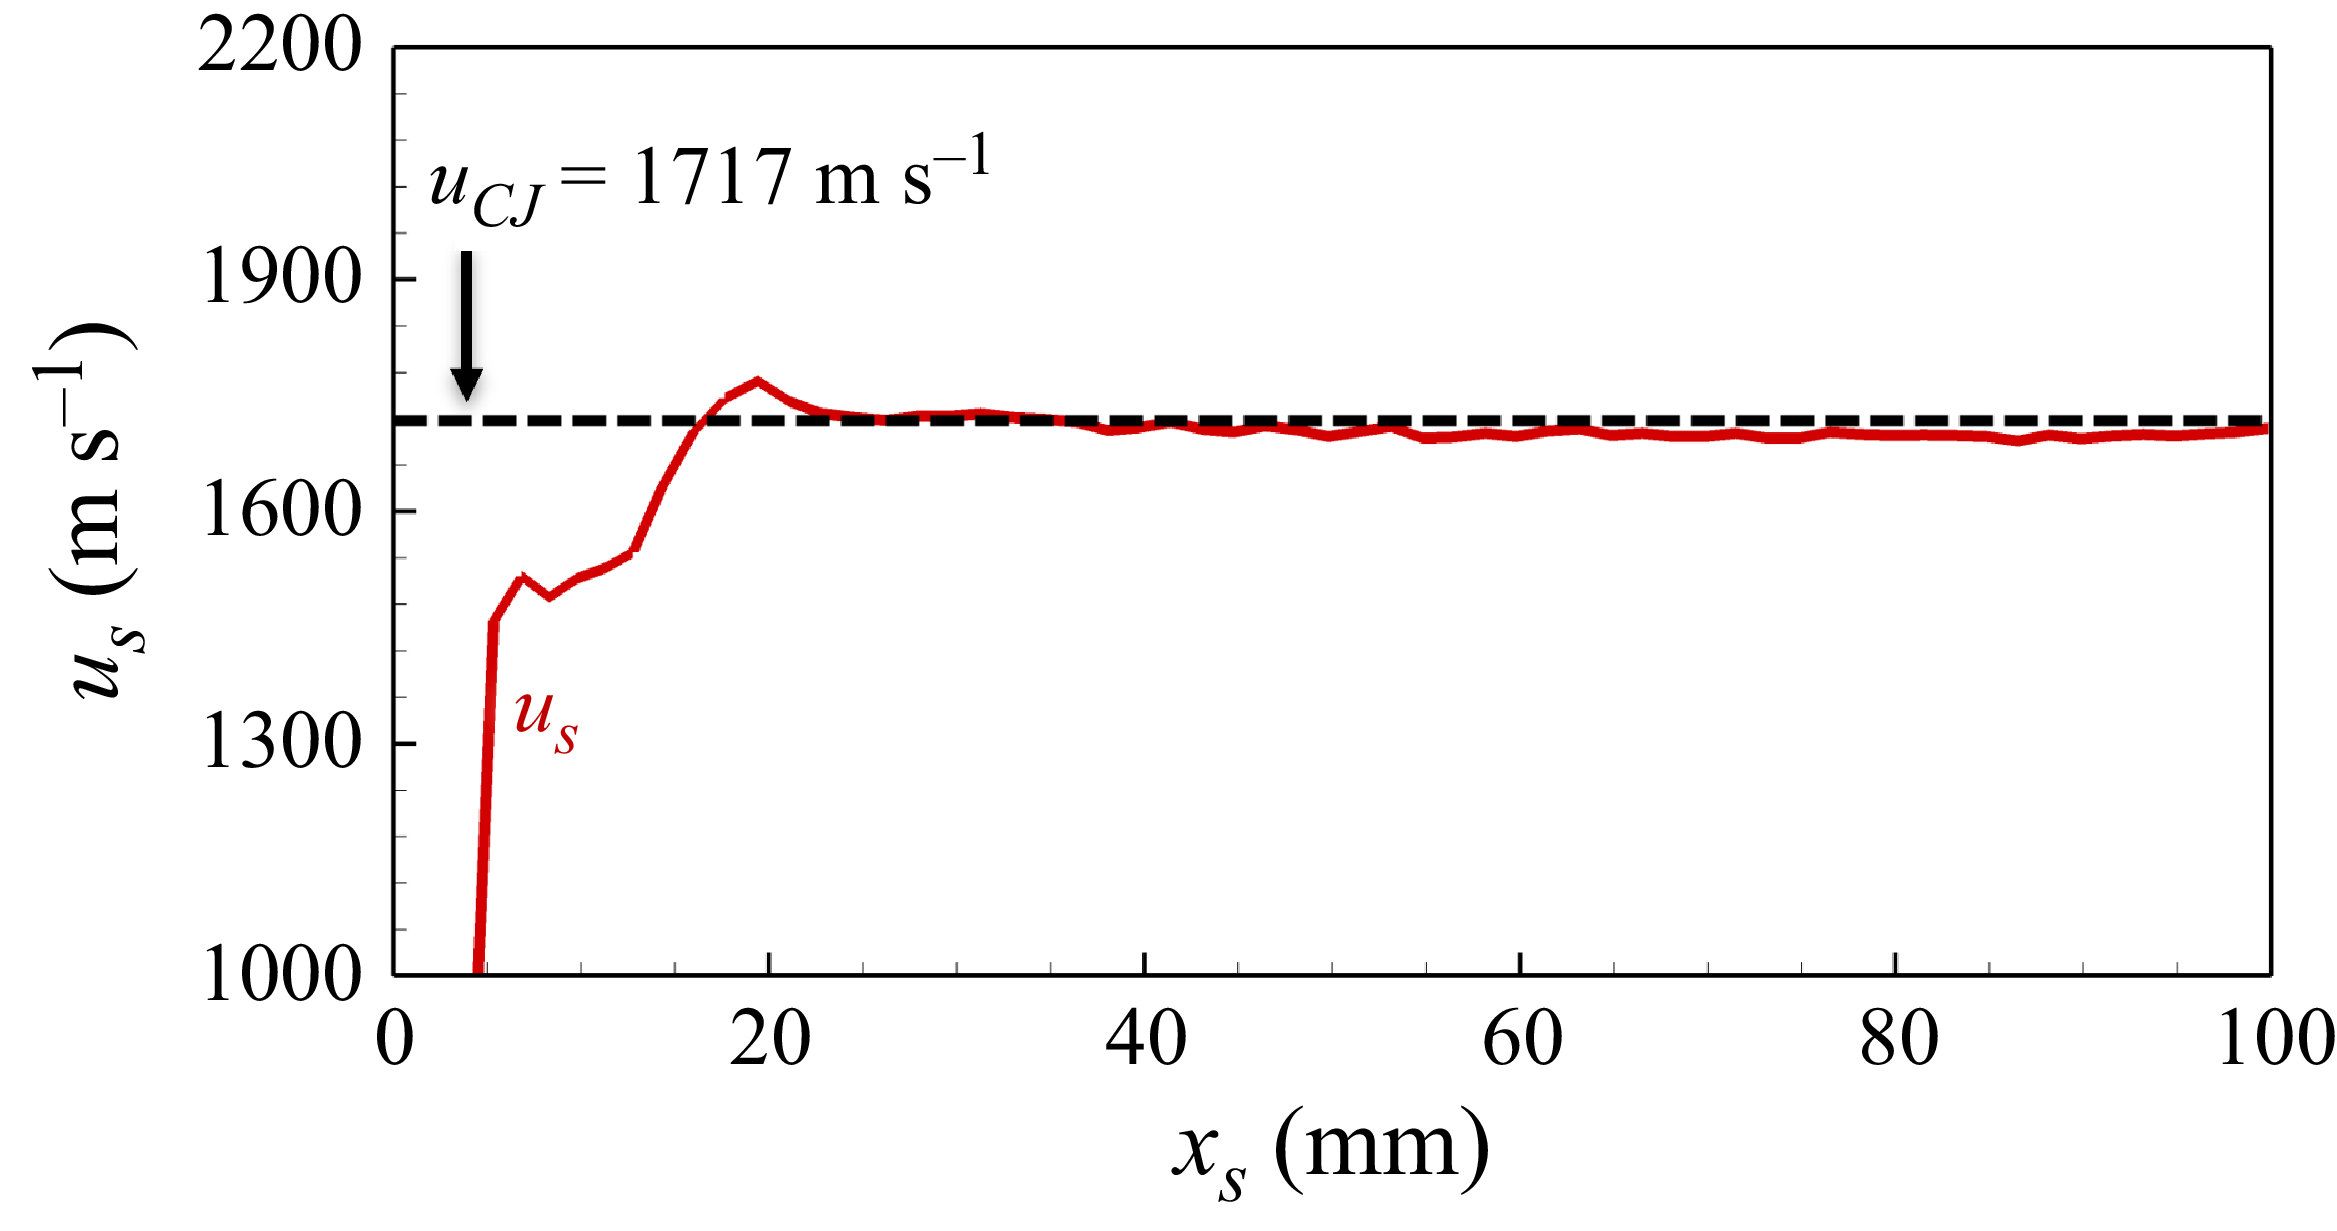
= 0.6 using a lower-energy initiation configuration (configuration 2). Figure 7(a) indicates that configuration 2 results in a multi-stage evolution of the cellular structure. Initially, auto-ignition occurs within the initiation region, generating a single-cellular detonation propagating in the region with x < 22 mm. This is referred to as the initiation stage. As the detonation propagates through the region with 22 < x < 58 mm, it maintains the single-cellular structure with almost constant cell width λ ≈ 1.5 mm. The leading shock speed u
S
also remains nearly constant but is significantly lower than the CJ speed (further discussed in figure 8). Therefore, this phase is termed as the weak stage. Subsequently, during the transition stage (58 < x < 74 mm), the single-cellular detonation evolves into a double-cellular detonation. Finally, in the normal stage (x > 74 mm), the detonation wave propagates in a fully developed double-cellular pattern matching configuration 1 (figure 3).
Numerical soot foils for detonation propagation processes separately initiated by (a) configuration 2 and (b) configuration 3. Here,
 $\kappa $
is fixed at 0.6.

Change of the leading shock speed with shock position for detonation initiated by configurations 1 (red line), 2 (blue line) and 3 (solid black line) for
 $\kappa $
= 0.6.

To facilitate comparison with the results in figure 3 and to further verify that the observed triple-point trajectory in figure 7(a) is reproducible rather than a numerical artefact caused by a specific initiation configuration, figure 7(b) presents the triple-point trajectory of the detonation wave induced by configuration 3. Notably, configuration 3 employs the same perturbation profile as configuration 1, aiming to rule out the influence of initial perturbation on the observed behaviour. Figure 7(b) exhibits a multi-stage detonation propagation pattern similar to that in figure 7(a), demonstrating that under low initiation energy, the double-cellular detonation is indeed not triggered immediately.
The leading shock speeds u
S
during the detonation initiation and propagation processes triggered by configurations 1–3 for
 $\kappa $
= 0.6 are shown in figure 8. For the detonation initiated by configuration 1, u
S
fluctuates around the CJ speed (u
CJ
= 1717 m s–1 for
 $\kappa $
= 0.6). In contrast, for the detonations initiated by configurations 2 and 3, u
S
at the weak stage oscillates around 1283 m s−1 during the weak stage. As the transition stage begins, the leading shock accelerates, and u
S
increases to u
CJ
. Finally, u
S
stabilises at approximately the CJ speed, indicating that the double-cellular detonation is fully developed, and the normal stage is reached.
4.2. Structure of the low-speed single-cellular detonation
The results in § 4.1 indicate that the detonation wave at the weak stage features almost stable propagation speed (lower than the CJ value) and constant cell size, thereby it is defined as the low-speed single-cellular detonation. The quasi-steady propagation characteristics of this low-speed single-cellular detonation warrant detailed structural examination, and figure 9(a–d) show its wave structure. Only single-cellular structures and single-scale triple-shock configurations are observed in figures 9(a) and 9(b). Besides, the limited post-shock temperatures (1580 K, figure 9 c) restrict combustion to first-stage reaction, leaving approximately 50 % fuel unreacted (figure 9 d). This indicates that the detonation wave in the weak stage is only sustained by the first-stage reaction and is thereby characterised by single-cellular structure.
(a) Numerical soot foil, (b) density gradient, (c) temperature and (d) C2H4 mass fraction contours at t = 30 μs for the detonation wave initiated by configuration 2, with
 $\kappa $
= 0.6.

In § 3.1, we examine the ZND structure with two-stage heat release, which corresponds to the state of double-cellular detonation. By setting the leading shock speed to the average shock speed during the weak stage (i.e. 1283 m s−1 as indicated in figure 8), we obtain the one-dimensional steady-state solution behind the leading shock, as shown in figure 10. Figures 10(a) and 10(b) show that the flow behind the leading shock accelerates and eventually reaches sonic speed at x = x C = 3.3 mm. According to the thermicity distribution in figure 10(c), the induction length for the detonation wave in the weak stage is 115.1 μm. The corresponding detonation cell width (approximately 1.5 mm, measured in figure 7) is approximately 13 times this induction length. Besides, figure 10(c) indicates that only the first-stage heat release occurs, consuming approximately 50 % C2H4. Figure 10(d) further shows that the first-stage heat release raises the temperature to approximately 1520 K. Moreover, the pressure behind the leading shock (i.e. at the von Neumann peak) is 16.3 atm and is much lower than the 29.8 atm for the ZND structure in figure 2(b). These one-dimensional results further demonstrate that low-speed single-cellular detonation is only driven by the first-stage heat release.
The spatial distributions of (a) flow speed and sound speed, (b) Mach number, (c) mass fractions of O3 and C2H4, and thermicity, and (d) pressure and temperature behind the leading shock with u
s
= 1283 m s−1, with
 $\kappa $
= 0.6. The leading shock is at x = 0, and the sonic point appears at x
C
= 3.3 mm, as indicated by the black dashed line.

5. Transition from single- to double-cellular detonation
5.1. Thermal dynamics analysis
The thermodynamic characteristics of different cellular detonation regimes are systematically compared through Rayleigh line–Hugoniot curve analysis in figure 11. For low-speed single-cellular detonation with u S = 1283 m s−1, the red Rayleigh line shows tangency with the post-first-stage-reaction Hugoniot curve at CJ point S2, while intersecting the unburned mixture’s Hugoniot curve at S1. This configuration reveals a two-step combustion process: (i) initial shock compression from ambient state O to von Neumann state S1; (ii) subsequent first-stage exothermic reaction along the Rayleigh line from S1 to S2.
Hugoniot curves and Rayleigh lines. The black curve corresponds to the unburned mixture, while the red and blue curves represent respectively the mixtures after the first- and second-stage reactions. Here,
 $\kappa $
= 0.6.

In contrast, double-cellular detonation with u S = uCJ = 1717 m s−1 (blue line and curve) demonstrates more complex thermofluidic behaviour. The steeper Rayleigh line achieves tangency with the fully reacted Hugoniot curve at CJ point D3 after completing two distinct reaction phases: (i) initial shock-induced compression to von Neumann state D1; (ii) sequential energy release through first-stage (D1→D2) and second-stage (D2→D3) reactions along the same Rayleigh line. This multi-step energy release mechanism explains the observed velocity enhancement and cellular structure differentiation between detonations in weak and normal stages. These results indicate that the distinction between low-speed single- and double-cellular detonations arises from differences in the degree of coupling between the leading shock and the chemical reaction zone. When the reaction is fully coupled with the shock wave, a double-cellular detonation is sustained. Conversely, when the coupling is only partial, a single-cellular detonation emerges.
It is noted that the thermodynamic process of the low-speed single-cellular detonation presented in this study is fundamentally different from that reported by Sugiyama and Matsuo (Reference Sugiyama and Matsuo2011). In Sugiyama and Matsuo (Reference Sugiyama and Matsuo2011), the transition from double- to single-cellular detonation was achieved by reducing the channel width, which altered the cellular structure through confinement effects. Referring to Sugiyama and Matsuo (Reference Sugiyama and Matsuo2011), additional simulations are conducted by reducing the computational domain width (H) from 10 mm to 1 mm for
 $\kappa $
= 0.6. The resulting triple-point trajectories and instantaneous temperature contours are shown in figure 12. As demonstrated in figure 12(a), this domain confinement indeed results in single-cellular detonation. However, the observed detonation cell size is much smaller than that of the low-speed single-cellular detonation presented in figure 7. Furthermore, figure 12(b) shows that C2H4 is completely consumed behind the leading shock, and the post-shock region reaches a significantly elevated temperature, indicative of the completion of both two-stage reactions. These results demonstrate that despite the appearance of a single-scale cellular pattern, the two-stage reaction mechanism still fully proceeds and remains tightly coupled to the leading shock in figure 12.
(a) Numerical soot foil and (b) temperature contour at t = 57 μs for detonation propagation, with
 $\kappa $
= 0.6 and H = 1 mm.

For cellular detonation, decreasing the channel width suppresses the development of triple-wave structures. In experiments, this suppression is typically attributed to increased wall-induced dissipation, which results in higher wave front curvature and velocity deficits (Chinnayya, Hadjadj & Ngomo Reference Chinnayya, Hadjadj and Ngomo2013; Gao, Lee & Ng Reference Gao, Lee and Ng2014; Xiao et al. Reference Xiao, Sow, Maxwell and Radulescu2021). However, in our simulations, periodic boundary conditions are applied in the transverse direction, effectively eliminating wall effects. Therefore, the suppression to large-scale triple-shock structures in our case stems from the geometric confinement itself. Consequently, the detonation front associated with the second-stage reaction degenerates into a quasi-one-dimensional structure. Nevertheless, the second-stage reaction still supplies energy to sustain the detonation propagation.
Therefore, for the single-cellular detonation presented in figure 12, the thermodynamic state of the mixture still follows the trajectory O → D1 → D2 → D3 shown in figure 11. This also indicates that the leading shock of the detonation wave shown in figure 12 is substantially stronger than that of the low-speed single-cellular detonation discussed in § 4. This distinction is readily confirmed by comparing the detonation wave velocities. As shown in figure 13, the measured leading shock speed of the detonation in narrow tube is close to the theoretical CJ velocity, and significantly higher than the velocity of the low-speed single-cellular detonation, which propagates at only 1283 m s−1.
Change of the leading shock speed with shock position during the detonation propagation process, with
 $\kappa $
= 0.6 and H = 1 mm.

Thus the single-cellular detonation observed under narrow confinement conditions is essentially distinct from the low-speed single-cellular detonation discussed in § 4. In the latter case, only the first-stage reaction is active behind the leading shock, while for the case in a narrow tube, both stages contribute to energy release and detonation sustenance.
5.2. Transition from single- to double-cellular structure
This subsection investigates the structural transition from single- to double-cellular detonation. Figures 9(c) and 9(d) reveal localised hot spots (>2000 K) forming behind the leading shock, characterised by rapid C2H4 consumption. These features are further quantified in figure 14, which presents synchronised heat release and vorticity fields at t = 30 μs for detonation initiated by configuration 2.
(a) Heat release and (b) vorticity contours at t = 30 μs behind the wave front for detonation of
 $\kappa $
= 0.6 initiated by configuration 2.

Figure 14(a) demonstrates a multi-modal reaction topology: while the primary heat release zone (first-stage reaction) coincides with the leading shock front, discrete secondary reaction clusters emerge downstream. Cross-referencing with the figure 9 species consumption patterns confirms that these secondary zones correspond to spatially resolved second-stage reactions. The vorticity field in figure 14(b) reveals a strong correlation between reaction localisation and rotational flow structures, suggesting hydrodynamic instability-driven enhancement of chemical kinetics. During detonation propagation, cellular instability induces complex wave patterns. Wave interactions and fluid instabilities trigger second-stage reactions that generate hot spots.
The SWACER (shock-wave amplification by coherent energy release) mechanism (Lee, Knystautas & Yoshikawa Reference Lee, Knystautas and Yoshikawa1978) can provide a reasonable explanation for the transition from single- to double-cellular detonation. Wave interactions and fluid dynamic instabilities behind the wave front of the single-cellular detonation create additional hot spots driven by the second-stage reaction. These hot spots release energy that promotes the propagation of the leading shock. As a result, the leading shock becomes stronger and thereby further accelerates the second-stage reaction. Such coherent coupling between reaction and shock wave helps to create the second-stage reaction front. Consequently, the large-scale triple-shock configuration develops, and the single-cellular detonation evolves into double-cellular detonation.
During the transition stage shown in figure 7(a), the cell size of the low-speed single-cellular detonation gradually decreases, indicating the emergence of additional triple-shock structures along the wave front. A similar phenomenon was reported by Suryanarayan et al. (Reference Suryanarayan, Dushe, Hytovick, Berson, Ahmed and Yang2025) in their study of detonations with high activation energy, where the ignition of unburnt gas pockets behind the wave front produced reactive blast waves that subsequently interacted with the leading shock. This interaction was identified as a key mechanism in the formation of new transverse wave structures.
In this study, as illustrated in figure 14, numerous hot spots form behind the leading shock due to wave interactions and hydrodynamic instabilities, which promote localised energy release. It is reasonable to infer that heat release from these hot spots perturbs the wave front and contributes to the emergence of new triple-shock structures, as proposed by Suryanarayan et al. (Reference Suryanarayan, Dushe, Hytovick, Berson, Ahmed and Yang2025). However, a key difference lies in the characteristics of the energy release: in our case, the isolated reaction zones observed during the transition phase release energy more gradually and do not produce strong reactive blast waves capable of directly impacting the leading shock. The development of new transverse structures appears to be driven by the accumulated influence of sustained disturbances generated by this gradual heat release behind the leading shock.
5.3. Discussion on physical plausibility
The novelty of the present work lies in identifying and characterising a low-speed single-cellular detonation that emerges under weak initiation conditions in mixtures exhibiting two-stage heat release. This observation leads to the key finding that two distinct detonation regimes – a CJ-speed double-cellular detonation and a sub-CJ-speed single-cellular detonation – can transiently exist in the same reactive mixture under identical thermodynamic conditions, depending solely on the initiation.
As mentioned in the Introduction, multiple detonation regimes were experimentally recorded by Virot et al. (Reference Virot, Khasainov, Desbordes and Presles2010), who investigated the influence of initial pressure on detonation structures in H2–NO2/N2O4–Ar mixtures with two-stage heat release characteristics. Their results demonstrated that reducing the initial pressure suppresses the second-stage reaction, leading to the emergence of a single-cellular detonation with sub-CJ speed, in contrast to the double-cellular detonation observed at higher pressures. They attributed this transition to losses (heat and/or friction), and proposed that the initial pressure decrease slows down the reaction rate and makes losses more important because reaction length becomes longer. Besides, under near-critical conditions, as figure 15 shows, Virot et al. (Reference Virot, Khasainov, Desbordes and Presles2010) also reported a bifurcation for the same mixture under the identical thermodynamical state between these two propagation modes, indicating that detonation waves could propagate either at a quasi-CJ velocity with a double-cellular structure, or at a lower velocity with a single-cellular structure.
Soot traces revealing double-cellular and single-cellular structures for H2–NO2/N2O4–Ar mixtures at 25 kPa: (a) Double-cellular structure; (b) single-cellular structure (Virot et al. Reference Virot, Khasainov, Desbordes and Presles2010).

This experimental observation offers strong support for the physical plausibility of the detonation regimes identified in our simulations. While Virot et al. (Reference Virot, Khasainov, Desbordes and Presles2010) attributed the regime bifurcation to the influence of losses, the present study achieves the structural transition under identical thermodynamic conditions, solely by varying the initiation energy. By employing a detailed chemical mechanism, we demonstrate that for the same reactive mixture at fixed pressure and temperature, it is possible to obtain either a low-speed single-cellular or a CJ-speed double-cellular detonation, depending on whether the second-stage reaction is activated by the initial shock. This highlights a new metastable detonation regime that is not externally imposed (e.g. by thermal losses), but rather intrinsically governed by the reaction–shock coupling.
However, in this study, the low-speed single-cellular detonation could not propagate stably. Wave interactions generate localised hot spots, and hydrodynamic instabilities induce vortex structures that promote the onset of the second-stage reaction, and transition the low-speed single-cellular detonation into a CJ-speed double-cellular mode. Undoubtedly, introducing energy loss mechanisms as emphasised by Virot et al. (Reference Virot, Khasainov, Desbordes and Presles2010) that suppress the second-stage reaction may allow the low-speed single-cellular detonation to persist for a longer duration. However, an intriguing idea worth exploring is the effect of a significantly delayed second-stage reaction. If the delay time for the second-stage reaction becomes extremely large compared to the first stage (i.e.
 $\unicode{x1D6E5} _{\kern-1pt I2}$
/
 $\unicode{x1D6E5} _{\kern-1pt I1}$
>> 1), then the onset of the second stage may be further postponed under weak initiation. In such cases, the single-cellular detonation might persist for extended periods, or potentially become self-sustaining, even in the absence of explicit loss mechanisms. In future works, it would be interesting to investigate this hypothesis.
6. Conclusions
In this study, two-dimensional simulations are conducted to investigate the cellular detonation dynamics in C2H4/O2/O3/N2 mixtures. Strong initiation (configuration 1) directly generates stable double-cellular detonation propagating at the theoretical CJ velocity. In contrast, weak initiation (configurations 2 and 3) induces a three-stage development: (i) a weak stage during which the initial auto-ignition produces low-speed single-cellular detonation with constant cell size, sustained exclusively by first-stage reactions; (ii) a subsequent transition stage that arises from feedback between vorticity-induced hot spots and shock amplification, where second-stage energy release triggers cellular bifurcation; and (iii) a normal stage in which the final stabilisation achieves the double-cellular detonation through coordinated two-stage exothermicity. The wave structures in both the cellular detonation regimes are analysed. The low-speed single-cellular detonation is solely supported by the first-stage reaction, while the double-cellular structure arises from the two-stage exothermic reactions. Besides, mechanistic analysis reveals that flow instabilities generate vorticity-rich zones enabling viscous dissipation-driven temperature spikes, which triggers the second-stage reaction. Vortical–thermal interactions nucleate secondary triple-point configurations and cause the transition from single- to double-cellular detonation. Additionally, conditions for the formation of double-cellular detonation are explored, and two qualitative requirements are summarised: the reactions of the two stages must proceed as independently as possible, and both heat releases from the two stages must be high enough to sustain triple-shock configurations.
The discovery of two distinct detonation regimes coexisting under identical thermodynamic conditions reveals the non-uniqueness of detonation structures, underscoring the complex interplay between shock dynamics and chemical kinetics in multi-stage reactive fuels. From an applied perspective, these findings highlight the potential risk of incomplete detonation under weak initiation in staged-reactivity mixtures, and offer valuable insights into possible bifurcation or instability behaviours in detonation-based propulsion systems. The current detonation initiation configuration can be reproduced in a shock tube. The use of different pressures and temperatures in detonation configurations is representative of shock reflection from an end wall. We hope that future experiments can be designed to validate the key findings presented in this study in mixtures with two-stage heat releases. The current study also has some limitations. For instance, ozone is used to artificially regulate the two-stage reaction process in this work, with its concentration being significantly higher than what is typically found in practical applications. Besides, the grid size employed in this study is not sufficiently fine to fully resolve the small detonation cells, and the simulation domain is limited. Future investigations should consider more realistic mixtures and finer resolutions to address these issues.
Supplementary material
Supplementary material is available at https://doi.org/10.1017/jfm.2025.10770.
Acknowledgements
We thank Dr P. Yang and Dr D. Yu from Institute of Mechanics, Chinese Academy of Sciences, and Dr Y. Wang from Peking University, for valuable discussions.
Funding
This work was supported by the National Natural Science Foundation of China (no. 52425604).
Declaration of interests
The authors report no conflict of interest.
Author contributions
J.S. performed the research, analysed the data, and drafted the manuscript. Z.C. conceived the original idea, designed the research, revised the manuscript, and supervised the project.
Data availability
The data that support the findings of this study are available upon request.