





Introduction
Hospital-associated Staphylococcus aureus bacteremia (HA-SAB) is a leading cause of nosocomial infections worldwide and is associated with significant mortality ranging from 10% to 40% morbidity (e.g., disseminated and metastatic sites of infections, ICU admission) and healthcare costs (estimated $10,000–30,000 per case).Reference Bai, Lo and Komorowski1–Reference Thampi, Showler and Burry5
HA-SAB is commonly associated with a variety of sources of infection. From 2011 to 2014, S. aureus was the most common recovered pathogen for ventilator-associated pneumonia and surgical-site infections reported by hospitals in the United States to the Centers for Disease Control and Prevention. For central line-associated bloodstream infections (CLABSI), S. aureus was the second most common isolated pathogen, behind only Coagulase-negative Staphylococci.Reference Weiner, Webb and Limbago6 HA-SAB is an important surveillance metric for Infection Prevention and Control (IPAC) programs to determine whether prevention measures can be improved. In the United Kingdom, for example, there is mandatory reporting of SAB as a care quality indicator.7,Reference Morris and Russell8
In Canada, the Canadian Nosocomial Infection Surveillance Program (CNISP) collects data on healthcare-associated Methicillin Resistant Staphylococcus aureus (MRSA)/Methicillin Sensitive Staphylococcus aureus (MSSA) bloodstream infections (BSI) in participating CNISP hospitals. The case definition of hospital-acquired MRSA/MSSA BSI is isolation of MRSA or MSSA from the bloodstream in patients on or beyond calendar day 3 of their hospitalization, or in those who have been hospitalized in the last 7 days, or up to 90 days depending on the source of infection, or if patients have had a healthcare exposure at their facility that would have resulted in this bacteremia (using best clinical judgment). Patients are excluded if less than 14 days since a previously treated MSSA/MRSA BSI.9 From a previous CNISP review of MRSA BSI in 2016, the majority were hospital-acquired. The most common sources of MRSA HA-SAB were vascular catheters (26%), followed by skin and soft tissue (14%), pulmonary (14%) and surgical site (12%).Reference Simor, Pelude and Golding10 HA-SAB secondary to peripheral IV (PIV) was not reported separately in the 2016 CNISP Surveillance Report; however, PIV has previously been reported as a common source of HA-SAB cases (23.5%–36%).Reference Blauw, Foxman and Wu4,Reference Gallego Rodríguez, Duch Llorach and Grillo11 The objective of this study is to outline the creation of a more efficient surveillance system through increased automation of detecting HA-SAB BSI in our acute care facilities. In addition, our goal was to determine the rate of HA-SAB BSI in our facilities and describe the most commonly attributable sources for HA-SAB to better inform nosocomial infection prevention strategies.
Methods
Study population
The study was conducted between April 1, 2020 and March 31, 2025 at two Providence Health Care (PHC) acute-care facilities, which includes a 422-bed academic and 101-bed community hospital in Vancouver, British Columbia, Canada.
Study design and data collection
A clinical algorithm was developed in partnership with our Analytics and Decision Support (ADS) team to automate extraction of cases that meet the temporal case definition of HO-SAB. Clinical data was extracted from Cerner electronic health record (EHR). Case definitions are summarized in Figure 1. Hospital-onset SAB (HO-SAB) was defined as S. aureus identified in blood culture after 48 hours of hospital admission (HO-SAB Current Admission, HO-SAB-CA), or admitted ≤48 hours but with an admission of>24 hours within the last 28 days (HO-SAB Previous Admission, HO-SAB-PA). Algorithm extracted cases of HO-SAB-CA and HO-SAB-PA underwent chart review (Infection Control Professional and Infection Control Physician) to determine if they were HA-SAB or community-associated (CA-SAB). The attributable source(s) of HA-SAB were identified for each case; if the source was not evident, it was classified as unknown. Sources of HA-SAB included central line (peripherally inserted central catheter (PICC), Implanted Venous Access Device (IVAD), tunneled/non-tunneled, hemodialysis), PIVC, bone/joint/musculoskeletal, genitourinary, intra-abdominal, pleuropulmonary, skin and soft tissue infection (SSTI), prosthetic material infection (cardiac/non-cardiac device) and surgical site infection. ADS extracted the 30 and 90 day in/out hospital mortality as well as readmission rates for HA-SAB cases from Cerner EHR.
Clinical algorithm for identification of hospital-associated Staphylococcus aureus bacteremia (HA-SAB) at Providence Health Care (PHC), 2020–2025. Note: MSSA, methicillin sensitive Staphylococcus aureus; MRSA, methicillin resistant Staphylococcus aureus; ED, emergency department; ICP, infection control practitioner; IPAC, infection prevention and control.

Figure 1. Long description
The flowchart starts with 5146 cases of S. aureus Bacteremia (SAB) with MSSA/MRSA positive blood cultures. The first decision point checks if it has been more than 14 days since the previous positive blood culture. If no, the case is excluded from surveillance. If yes, the next step checks if the collection date/time is more than 48 hours after admission. If yes, it is classified as Hospital-Onset S. aureus Bacteremia Current Admission (HO-SAB-CA) with 158 cases. If no, further questions determine if the patient was discharged from a PHC facility in the last 28 days, if the previous length of stay was more than 24 hours, and if the patient did not have a positive blood culture in the previous encounter. If all are yes, it is classified as Hospital-Onset S. aureus Bacteremia Previous Admission (HO-SAB-PA) with 64 cases. Both classifications are reviewed by ICP & IPAC Physician for Hospital-Associated S. aureus Bacteremia. The outcomes are either Community-Associated S. aureus Bacteremia (CA-SAB) or Hospital-Associated S. aureus Bacteremia (HA-SAB).
Data analysis
The annual HA-SAB infections incidence at our institution was calculated and reported in cases per fiscal year and rate per 10,000 admissions and patient days (PDs) per fiscal year. Incidence of HA-SAB was stratified by MRSA versus MSSA. Analysis of changes in the HA-SAB incidence rate over time was performed using Poisson regression models with an offset for PDs (R version 4.4.1), with P<.05 considered significant.
Ethics
Research ethics approval was exempted because the surveillance was observational, patient confidentiality was maintained, and quality improvement surveillance was considered to be a routine component of the IPAC program.
Results
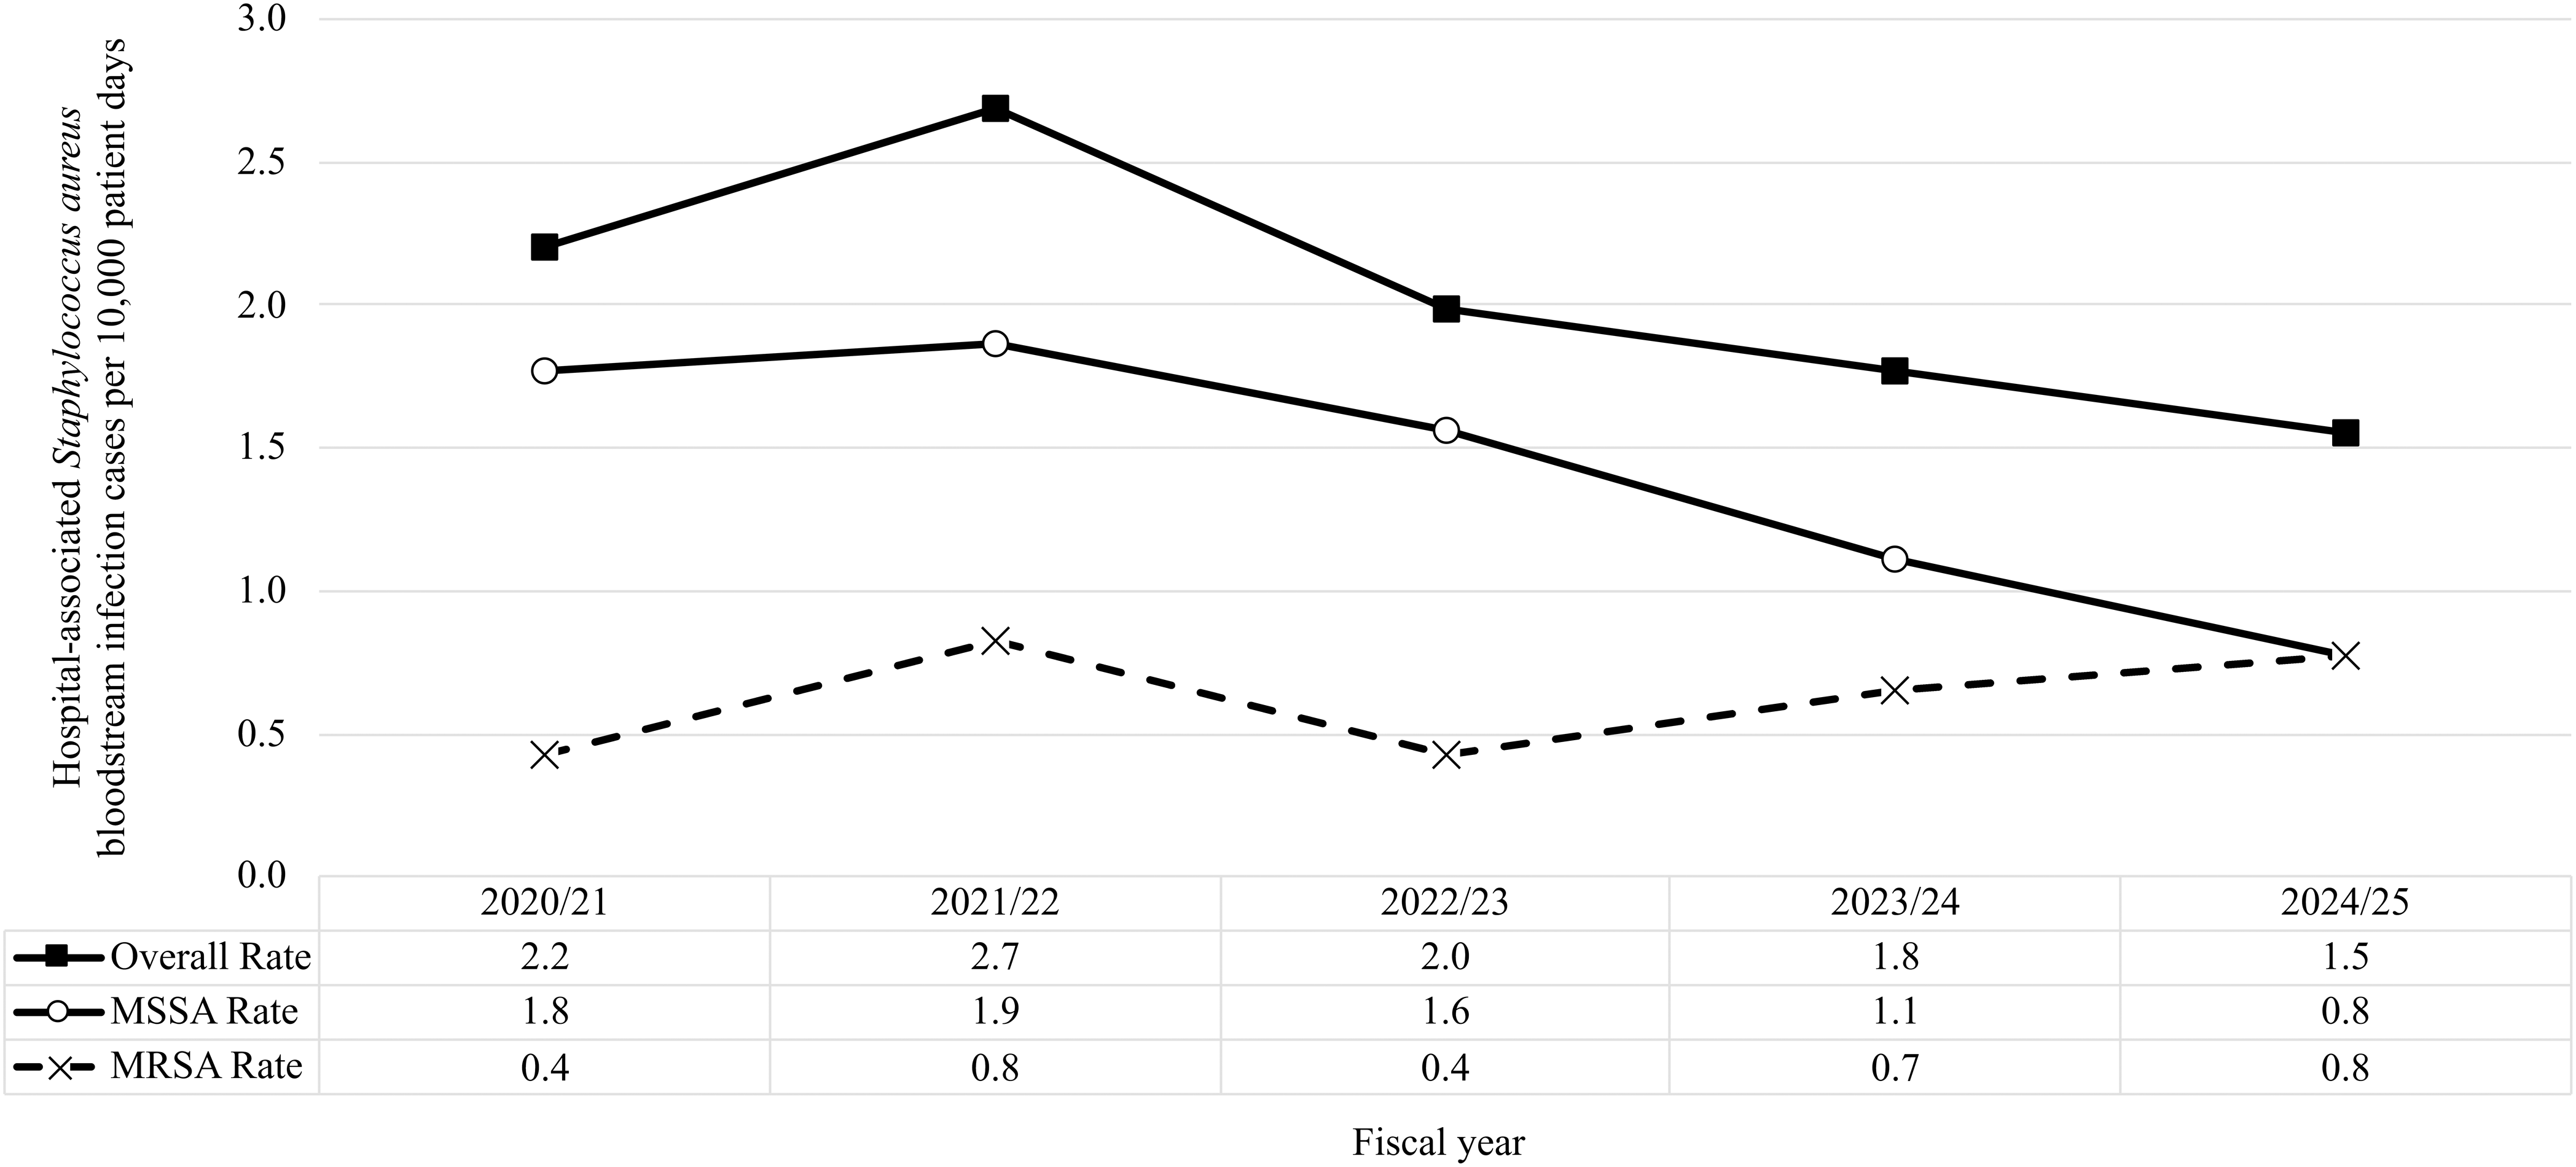
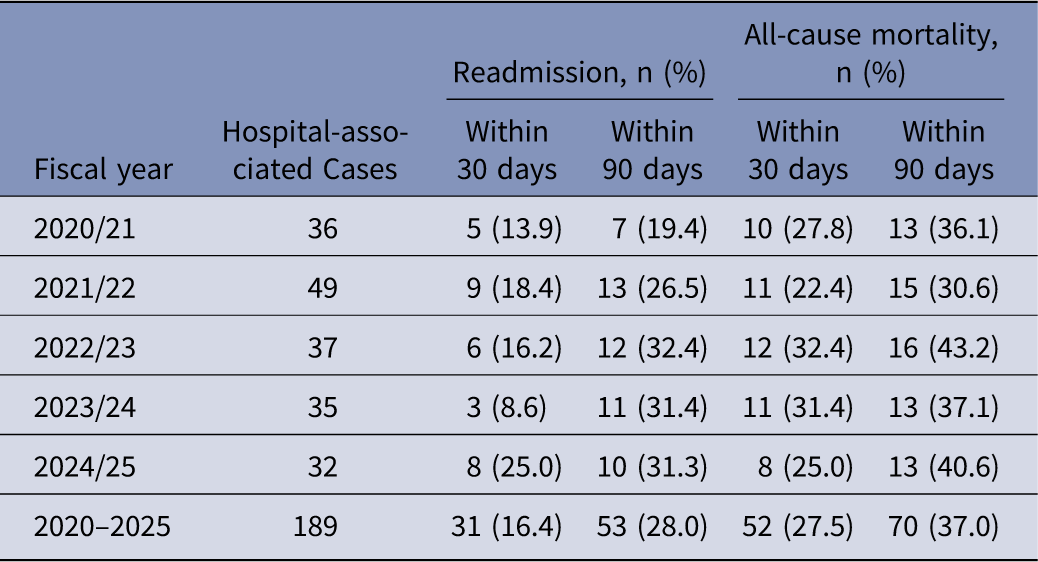
Over a 5-year period from 2020 to 2025, the automated algorithm process effectively screened 5,146 total cases of SAB, and determined that 222 cases (4%) fit the temporal definition of HO-SAB. Of these, 158 (71%) identified cases were from current admission (HO-SAB-CA) and 64 (29%) cases from previous admission (HO-SAB-PA) (Figures 1 and 2). All HO-SAB-PA/CA cases underwent chart review, with 189 (85%) cases classified as hospital-associated (HA-SAB) and 33 (15%) as community-associated (CA-SAB) (Figure 3). Of the 189 HA-SAB cases, we attributed 151 (80%) to current admission (>48 hours after admission) and 38 (20%) cases to a previous admission (Figure 1). Stratified by methicillin resistance, we identified 130 (69%) MSSA cases and 59 (31%) MRSA cases (Figure 4). A higher proportion of HO-SAB-CA algorithm identified cases met criteria for HA-SAB, following chart review (151/158 (96%), compared to HO-SAB-PA 38/64 (59%) algorithm identified cases) (Figure 1). The rate of HA-SAB from 2020 to 2025 varied between 1.5 and 2.7 cases per 10,000 PDs (Figure 5) or 15.2–26.2 per 10,000 patient admissions. During the study period, HA-SAB incidence per PDs had a statistically significant decrease. The regression-based incidence rate ratio (IRR) per year was 0.893 (95% CI 0.806–0.988, P = .028), corresponding to an average decrease of 10.7% per year. MSSA HA-SAB incidence rate per PDs also had a statistically significant decrease over the study period. The regression-based incidence rate ratio (IRR) per year was 0.816 (95% CI 0.721–0.923, P = .001), corresponding to an average decrease of 18.4% per year. MRSA HA-SAB incidence rate, as assessed by the regression-based incidence rate ratio (IRR) per year, was 1.087 (95% CI 0.905–1.305, P = .375), corresponding to an average increase of 8.7% per year which was not statistically significant (Figure 2). In the study period, the most common sources of HA-SAB were central lines (23%), PIVC (22%) and SSTI (13%) (Figure 6). However, the source of HA-SAB was unknown for 12% of patients. We also analyzed two outcome measures, readmission and mortality, for HA-SAB cases. During the study period, readmission rates at 30 and 90 days ranged from 8.6% to 25.0% and 19.4–32.4%, respectively. All-cause mortality at 30 and 90 days (both in and out of hospital) ranged from 22.4% to 32.4% and 30.6–43.2%, respectively (Table 1).
Annual hospital-onset Staphylococcus aureus bacteremia (HO-SAB), current versus previous admission. Note: HO-SAB-CA, hospital-onset Staphylococcus aureus bacteremia current admission; HO-SAB-PA, hospital-onset Staphylococcus aureus bacteremia previous admission.

Annual hospital-onset Staphylococcus aureus bacteremia (HO-SAB), hospital versus community-associated. Note: HA-SAB, hospital-associated Staphylococcus aureus bacteremia; CA-SAB, community-associated Staphylococcus aureus bacteremia.

Annual hospital-associated Staphylococcus aureus bacteremia (HA-SAB), MSSA versus MRSA. Note: MSSA, methicillin sensitive Staphylococcus aureus; MRSA, methicillin resistant Staphylococcus aureus.

Annual hospital-associated Staphylococcus aureus bacteremia (HA-SAB) incidence rate. Note: MSSA, methicillin sensitive Staphylococcus aureus; MRSA, methicillin resistant Staphylococcus aureus.

Cumulative sources of hospital-associated Staphylococcus aureus bacteremia (HA-SAB), 2020–2025. Note: Over the 5-year period, there were 189 HA-SAB cases and 214 sources of bacteremia as some patients had multiple sources of bacteremia.

Figure 6. Long description
Panel A: A stacked bar chart comparing the cumulative sources of hospital-associated Staphylococcus aureus bacteremia from 2020 to 2025. The horizontal axis lists different sources of infection: Bone, joint, M S K (musculoskeletal); Genitourinary; Intra-abdominal; Line – central (P I C C, tunneled, non-tunneled, I V A D, H D) line; Line – peripheral intravenous catheter (P I V C); Pleuropulmonary; Prosthetic material infection; Skin and soft tissue infection (S S T I) – acute, non-surgical site; Surgical site infection; Unknown. The vertical axis represents the count of cases. Each bar is divided into segments representing different years: 2020/21, 2021/22, 2022/23, 2023/24, and 2024/25, with different colors for each year. Notable trends include the highest counts for Line – central (P I C C, tunneled, non-tunneled, I V A D, H D) line and Skin and soft tissue infection (S S T I) – acute, non-surgical site.
Annual hospital-associated Staphylococcus aureus bacteremia (HA-SAB) readmission and mortality outcomes, 2020–2025

Table 1. Long description
The table presents data on hospital-associated Staphylococcus aureus bacteremia (HA-SAB) readmission and mortality outcomes over a five-year period from 2020 to 2025. It includes six rows and six columns. The columns are labeled as Fiscal year, Hospital-associated Cases, Readmission, n (%), and All-cause mortality, n (%). The Readmission column is further divided into Within 30 days and Within 90 days, and the All-cause mortality column is also divided into Within 30 days and Within 90 days. The table lists the fiscal years 2020/21, 2021/22, 2022/23, 2023/24, 2024/25, and 2020-2025. Each row provides the number of hospital-associated cases, readmission percentages within 30 and 90 days, and all-cause mortality percentages within 30 and 90 days for each fiscal year. Notable trends include varying readmission and mortality rates across the years, with some years showing higher percentages than others.
Discussion
During our study period, the rate of HA-SAB per fiscal year ranged from 15.2 to 26.2/10,000 patient admissions and 1.5–2.7/10,000 PDs. Interestingly in our study with the exception of fiscal year 2021/22, we noted a statistically significant decrease in HA-SAB incidence from 2020/21 to 2024/25, which was attributable to a decrease in MSSA incidence. The number of MRSA HA-SAB had a trend of increase during the study period, but the increase was not significant. In comparison, CNISP Canadian data from 2008 to 2012, MRSA BSI rates were 0.45/1,000 admissions or 0.59/10,000 PDs with a decreasing trend during the surveillance period.Reference Simor, Pelude and Golding10 In another observational study in Australia over 12 years, a total of 2,733 hospital-onset SAB cases were identified, giving an aggregate incidence of 0.90 per 10,000 PDs. There was also a decrease in incidence from 1.72 per 10,000 PDs in 2002 to 0.64 per 10,000 PDs in 2013, representing a 63% decrease in incidence.Reference Mitchell, Collignon, McCann, Wilkinson and Wells12 Similar trends were seen in a review of HO-SAB in the United States from 2012–2017.Reference Kourtis, Hatfield and Baggs13 It is proposed that IPAC initiatives played a large role in decreasing the rates of SAB. These interventions included national surveillance programs, evidence-based guidelines, clinician training, and a national hygiene initiative.Reference Mitchell, Collignon, McCann, Wilkinson and Wells12
The most common identified sources of HA-SAB were central line, PIVC and SSTI (both surgical and non-surgical), which is consistent with previous studies on nosocomial S. aureus BSI.Reference Blauw, Foxman and Wu4,Reference Simor, Pelude and Golding10,Reference Leekha, Robinson and Jacob14 Peripheral intravenous catheters are commonly used in patients admitted to hospital, but are not a benign intervention. In addition to non-infectious complications such as phlebitis, pain, catheter blockage, and infiltration,Reference Webster, Osborne, Rickard and Marsh15 they are associated with increased risk of bacteremia, and can prolong hospital length of stay.Reference Gallego Rodríguez, Duch Llorach and Grillo11 S. aureus is a leading pathogenic cause of PIV-related BSIs. Past studies that have looked at S. aureus bloodstream infection have identified peripheral IVs as the source in up to one third of cases.Reference Blauw, Foxman and Wu4 However, surveillance for peripheral IV catheter associated BSI, specifically for S. aureus, is not routinely conducted, particularly compared to the emphasis on CLABSI surveillance at healthcare facilities. In the absence of local data, instituting local interventions can be challenging despite known risk factors for peripheral IV catheter BSI which may be preventable such as emergent placement of peripheral IVs and prolonged dwell times.Reference Blauw, Foxman and Wu4 Bundles including staff education and training, maintenance of peripheral IVs, discontinuation of unnecessary peripheral IVs and routine monitoring for complications, have been reported to reduce complications secondary to peripheral IVs.Reference Kovacs, Fatica, Butler, Gordon and Fraser16,Reference Blanco-Mavillard, de Pedro-Gómez and Rodríguez-Calero17 In our study, the proportion of SAB attributable to peripheral IVs was 22%. This data highlights the importance of regular catheter review and discontinuing them when they are no longer medically needed.
Our study was unique, as we demonstrated how an automated algorithm using sensitive temporal definitions can be used to efficiently identify HA-SAB cases for further review. The inclusion of HO-SAB related to previous admissions criteria (overnight admission within the previous 4 weeks), allowed for the identification of an additional 38 (20%) cases of HA-SAB. Previous studies have reported the use of an automated surveillance process for the identification of hospital-onset bacteremia (HOB) using the Providing a Roadmap for Automated Infection Surveillance in Europe consensus definition of HOB.Reference Aghdassi, van der Werff and Catho18,Reference Brekelmans, Vlek and van Dijk19 For these studies, the overall HOB rate was 1.0–2.2/1,000 PDs. Polymicrobial bacteremia episodes were relatively common (12%–18%) and S. aureus was identified as a pathogen in 8%–16% of cases. For our surveillance program S. aureus was selected as the target pathogen, as the clinical interpretation of infection is clear for each case of bacteremia. Furthermore, S. aureus is a common pathogen for preventable hospital acquired infections, such as central line, peripheral intravenous catheter (PIVC), and surgical site infections. This allows for actionable quality improvement results for a common nosocomial pathogen associated with significant morbidity and mortality.
Developing the algorithm was an essential component of our HA-SAB surveillance system to increase automation. The automation process helped to extract cases that met the temporal case definition of HO-SAB. By using this automated process, only 4% of all SAB required further clinical review by IPAC. This workflow enabled a sustainable SAB surveillance program as a quality metric for our institution. By filtering out non-relevant SAB, IPAC could devote the resources to clinically review each HO-SAB-CA/PA rather than classifying based solely on a time-based definition. The effectiveness of the clinical algorithm is summarized in Figure 1.
There can be challenges when developing an automated system to extract data. A large cross-sectional study on the prevalence of patients classified as HA-SAB varied significantly with different definitions of HA infection.Reference Smit, Søgaard, Schønheyder, Nielsen and Thomsen20 When utilizing a temporal case definition of hospital-onset SAB, incidence can be overestimated. At our institution, our patient demographics include an inner-city population with patients who inject drugs (PWID). As such, an algorithm that filters by temporal case definition alone may capture cases that are CA-SAB. Our automated clinical algorithm generates a monthly data extraction with push notification to IPAC. Infection control practitioners play a vital role in reviewing all HO-SAB cases identified by the algorithm, followed by a secondary review by a physician, to ensure the accuracy of our HA-SAB rates.
There are limitations of this study. This study was retrospective, and thus data collection was conducted within the limitations of chart review and previous documentation by healthcare staff. This study included centers with a high proportion of vulnerable populations, which likely influenced the proportion of SAB attributable to intravenous drug use. Patient demographics were not collected, and thus we were unable to explore risk factors for SAB at the individual patient level. Given this was a newly introduced surveillance program, it was launched as an automated process to avoid manual ICP review, and as a result, a comparison to a previous manual surveillance could not be performed. In addition, this study was conducted in a high-income country, and patient demographics and medical practice likely differ in other areas of the world.
Conclusion
We developed an automated surveillance system for SAB to identify potential HO-SAB cases. Utilizing both current and previous admission temporal definitions, allowed detection and evaluation of an additional 38 (20%) cases. We were able to analyze the local epidemiology of common sources of infection for HA-SAB, which will help target future efforts to decrease the incidence of HA-SAB and its associated morbidity and healthcare costs. In particular, the data can inform local practice including focused interventions to address SAB related to peripheral IV catheters, such as reviewing insertion practices, maintenance, and regular review of catheter indications. Future research could explore a cost-benefit analysis of implementing such changes, and the overall effect on incidence of HA-SAB over time.
Acknowledgements
We would like to thank the IPAC practitioners and laboratory personnel from PHC, as well as our data analytics teams.
Financial support
None.
Competing interests
Authors report no conflicts of interest relevant to this article.
Potential conflicts of interest
M.P. reports having consulted for Cepheid and bioMérieux. M.N. reports an honorarium and having consulted for Paladin Labs Inc. C.L. reports an honorarium from GSK, and funding from Roche Diagnostics to attend a conference. All above are unrelated to this study. The remaining authors have no conflicts of interest to declare.




 Open access

