1 Introduction
The dynamics of turbulent shear flows over rough walls has been an active area of research because of its relevance in the design of engineering systems and in environmental fluid mechanics. Momentum and scalar exchanges between the wall and the fluid in such flows are of interest in a wide range of disciplines (Belcher, Harman & Finnigan Reference Belcher, Harman and Finnigan2012). Previous field experiments over natural vegetation (Katul et al.
Reference Katul, Kuhn, Schieldge and Hsieh1997b
; Poggi, Katul & Albertson Reference Poggi, Katul and Albertson2004), wind tunnel studies over obstacles of regular shapes (Macdonald & Griffiths Reference Macdonald and Griffiths1998; Castro, Cheng & Reynolds Reference Castro, Cheng and Reynolds2006) and numerical simulations over three-dimensional roughness elements (Coceal et al.
Reference Coceal, Dobre, Thomas and Belcher2007a
; Finnigan, Shaw & Patton Reference Finnigan, Shaw and Patton2009; Leonardi et al.
Reference Leonardi, Orlandi, Djenidi and Antonia2015) have advanced our understanding of this problem significantly. For example, these past studies have underlined the importance of dispersive fluxes inside and close to the roughness elements (Poggi et al.
Reference Poggi, Katul and Albertson2004; Poggi & Katul Reference Poggi and Katul2008; Jelly & Busse Reference Jelly and Busse2018). Nevertheless, there still remains a significant knowledge gap, particularly concerning the transport of scalars, and how it compares to that of momentum, over surfaces that consist of ‘large’ three-dimensional bluff-body-type roughness elements. Large here implies that the roughness protrudes significantly into the inertial sublayer, and that the details of the flow below the top of the roughness elements are important for the application. Note that in the atmospheric science literature, the inertial sublayer is often called the ‘surface layer’. Over a rough wall, it would be found above the canopy sublayer (ranging from the ground to the top of the roughness elements) and the roughness sublayer (ranging from the top of the roughness elements up to the height where the flow signatures of individual roughness elements are blended out). In the review paper by Jiménez (Reference Jiménez2004), he limited the discussions of rough-wall boundary layers to
 $H/\unicode[STIX]{x1D6FF}<0.025$
, where
 $H$
is the roughness element height and
 $\unicode[STIX]{x1D6FF}$
is depth of the boundary layer. In many natural settings and engineering applications,
 $H/\unicode[STIX]{x1D6FF}$
often exceeds 0.1, a regime sometimes termed the very rough surface (Castro et al.
Reference Castro, Cheng and Reynolds2006). For very rough surfaces, momentum and scalar transport within the canopy and roughness sublayers are topics of active ongoing research.
Various previous numerical studies (e.g. Kanda, Moriwaki & Kasamatsu Reference Kanda, Moriwaki and Kasamatsu2004; Castro et al. Reference Castro, Cheng and Reynolds2006; Coceal et al. Reference Coceal, Dobre, Thomas and Belcher2007a ; Orlandi & Leonardi Reference Orlandi and Leonardi2008; Anderson, Li & Bou-Zeid Reference Anderson, Li and Bou-Zeid2015; Anderson Reference Anderson2016; Giometto et al. Reference Giometto, Christen, Meneveau, Fang, Krafczyk and Parlange2016; Li, Bou-Zeid & Anderson Reference Li, Bou-Zeid and Anderson2016a ; Li et al. Reference Li, Bou-Zeid, Anderson, Grimmond and Hultmark2016b ) have probed the details of these very rough-wall flows such as the morphology of coherent structures and the effects of the roughness in such regimes. Moreover, recent large-eddy simulations (LES) and direct numerical simulations (DNS) (Finnigan et al. Reference Finnigan, Shaw and Patton2009; Boppana, Xie & Castro Reference Boppana, Xie and Castro2010, Reference Boppana, Xie and Castro2012; Park & Baik Reference Park and Baik2013; Philips, Rossi & Iaccarino Reference Philips, Rossi and Iaccarino2013; Leonardi et al. Reference Leonardi, Orlandi, Djenidi and Antonia2015; Li et al. Reference Li, Bou-Zeid, Anderson, Grimmond and Hultmark2016b ) investigated the transport of scalars. However, compared to the extensive literature focusing on the flow and momentum transport, research on scalars and their transport in flows over very rough walls remains quite limited. In addition, a detailed comparative analysis of momentum and scalar transport dynamics has not been performed before.
These open gaps motivate this present paper: we investigate both momentum and scalars at very high Reynolds numbers over three-dimensional, large roughness using the LES technique. We focus on the canopy and roughness sublayers. A logarithmic layer will exist further aloft if the roughness sublayer does not extend all the way to the top of the inertial layer. In particular, the analyses concern two aspects of the problem: the effects of different roughness geometries and the comparison between momentum and scalar transport. The numerical set-up of the problem is described next in § 2. Section 3 reports the results on the changes in turbulent flow characteristics for different surface geometries (§ 3.1) and on the spatially coherent dispersive fluxes, in particular, the differences between momentum and scalar transport (§ 3.2). Section 4 concludes with a summary and discussion.
2 Numerical set-up
In the LES code, the non-dimensional filtered incompressible continuity (2.1), Navier–Stokes (2.2), and scalar conservation (2.3) equations are solved assuming hydrostatic equilibrium of the mean flow,
 $$\begin{eqnarray}\displaystyle & \displaystyle \frac{\unicode[STIX]{x2202}u_{i}}{\unicode[STIX]{x2202}x_{i}}=0, & \displaystyle\end{eqnarray}$$
 $$\begin{eqnarray}\displaystyle & \displaystyle \frac{\unicode[STIX]{x2202}u_{i}}{\unicode[STIX]{x2202}t}+u_{j}\left(\frac{\unicode[STIX]{x2202}u_{i}}{\unicode[STIX]{x2202}u_{j}}-\frac{\unicode[STIX]{x2202}u_{j}}{\unicode[STIX]{x2202}u_{i}}\right)=-\frac{\unicode[STIX]{x2202}p}{\unicode[STIX]{x2202}x_{i}}-\frac{\unicode[STIX]{x2202}\unicode[STIX]{x1D70F}_{ij}}{\unicode[STIX]{x2202}x_{j}}+F_{i}+B_{i}, & \displaystyle\end{eqnarray}$$
 $$\begin{eqnarray}\displaystyle & \displaystyle \frac{\unicode[STIX]{x2202}\unicode[STIX]{x1D703}}{\unicode[STIX]{x2202}t}+u_{i}\frac{\unicode[STIX]{x2202}\unicode[STIX]{x1D703}}{\unicode[STIX]{x2202}x_{i}}=-\frac{\unicode[STIX]{x2202}q_{i}^{s}}{\unicode[STIX]{x2202}x_{i}}. & \displaystyle\end{eqnarray}$$
All the variables we will discuss are filtered components, so the usual tilde above the symbols is omitted for simplicity. The density
 $\unicode[STIX]{x1D70C}$
is taken to be unity and is uniform: buoyancy forces are not considered.
 $x$
,
 $y$
and
 $z$
denote the streamwise, cross-stream and wall-normal directions respectively, and
 $u$
,
 $v$
and
 $w$
are the velocity components in these respective directions.
 $t$
denotes time;
 $u_{i}$
is the resolved velocity vector;
 $x_{i}$
is the position vector;
 $p$
is a modified pressure that includes the resolved and subgrid scale (SGS) kinetic energy (Bou-Zeid, Meneveau & Parlange Reference Bou-Zeid, Meneveau and Parlange2005);
 $\unicode[STIX]{x1D70F}_{ij}$
is the deviatoric part of the SGS stress tensor;
 $F_{i}$
is the body force driving the flow (here simply a homogeneous steady horizontal pressure gradient along the
 $x$
direction with magnitude
 $u_{\ast }^{2}/\unicode[STIX]{x1D70C}\unicode[STIX]{x1D6FF}$
). The code uses the immersed boundary method (IBM) to account for the presence of the roughness elements via an immersed boundary force
 $B_{i}$
. Here we adopt a discrete forcing approach to compute
 $B_{i}$
(Mohd-Yusof Reference Mohd-Yusof1997), which means that the effect of the immersed boundary is incorporated into the discretized governing equations and
 $B_{i}$
is estimated a priori, improving numerical stability (Mittal & Iaccarino Reference Mittal and Iaccarino2005; Mittal et al.
Reference Mittal, Dong, Bozkurttas, Najjar, Vargas and Von Loebbecke2008; Fang et al.
Reference Fang, Diebold, Higgins and Parlange2011). The specific implementation in the code used here is detailed and validated in Tseng, Meneveau & Parlange (Reference Tseng, Meneveau and Parlange2006), Chester, Meneveau & Parlange (Reference Chester, Meneveau and Parlange2007) and Li et al. (Reference Li, Bou-Zeid and Anderson2016a
,Reference Li, Bou-Zeid, Anderson, Grimmond and Hultmark
b
). A friction velocity of
 $u_{\ast }=1~\text{ms}^{-1}$
, and a half-channel width of
 $\unicode[STIX]{x1D6FF}=100~\text{m}$
, are the nominal values used to non-dimensionalize
 $t$
and all outputs of the code; their imposed numerical values are thus inconsequential here. The top boundary is impermeable with zero stress; the simulations therefore are similar to a half-channel. In (2.3),
 $\unicode[STIX]{x1D703}$
denotes a passive scalar quantity, which for illustration is considered to be temperature in Kelvin in the current simulations, and
 $q_{i}^{s}$
is the
 $i$
th component of the SGS scalar flux.
We used the Lagrangian scale-dependent dynamic subgrid-scale model (Bou-Zeid et al.
Reference Bou-Zeid, Meneveau and Parlange2005, Reference Bou-Zeid, Vercauteren, Parlange and Meneveau2008) to compute the SGS viscosity required for modelling
 $\unicode[STIX]{x1D70F}_{ij}$
. Using a constant subgrid-scale Prandtl number of 0.4 (Kang & Meneveau Reference Kang and Meneveau2001; Bou-Zeid et al.
Reference Bou-Zeid, Higgins, Huwald, Meneveau and Parlange2010; Li Reference Li2016), the SGS diffusivity needed for
 $q_{i}^{s}$
is then calculated. Detailed validations for the flow and scalar transport can be found in Li et al. (Reference Li, Bou-Zeid and Anderson2016a
) and Li et al. (Reference Li, Bou-Zeid, Anderson, Grimmond and Hultmark2016b
), respectively. The LES uses a wall model for momentum and scalars that has been developed for a hydrodynamically smooth wall (here each facet of a building/cube is such a smooth wall) at high Reynolds numbers based on Kader & Yaglom (Reference Kader and Yaglom1972). For the wall model, Reynolds analogy in the vicinity of the wall (the unresolved viscous and buffer layers) is invoked. Wall modelling for complex topographies remains an ongoing area of research (Yang et al.
Reference Yang, Sadique, Mittal and Meneveau2015) and an open challenge (Bose & Park Reference Bose and Park2018). However, the performance of the current approach has been evaluated and shown to be quite satisfactory in Li et al. (Reference Li, Bou-Zeid, Anderson, Grimmond and Hultmark2016b
). Note also that although the viscous and diffusive terms are omitted in (2.2) and (2.3), the Reynolds number is encapsulated in the wall model. The friction Reynolds number
 $Re_{\ast }=(u_{\ast }\unicode[STIX]{x1D6FF})/\unicode[STIX]{x1D708}$
is approximately
 $10^{7}$
for all LES runs, where
 $\unicode[STIX]{x1D708}$
is the kinematic viscosity of air used in the wall model. Since the paper does not focus on the effect of different thermal boundary conditions, which has been studied in Pirozzoli, Bernardini & Orlandi (Reference Pirozzoli, Bernardini and Orlandi2016), a constant surface temperature scalar boundary condition is used for the surfaces of the obstacles and the bottom wall; the top thermal boundary condition is zero flux.
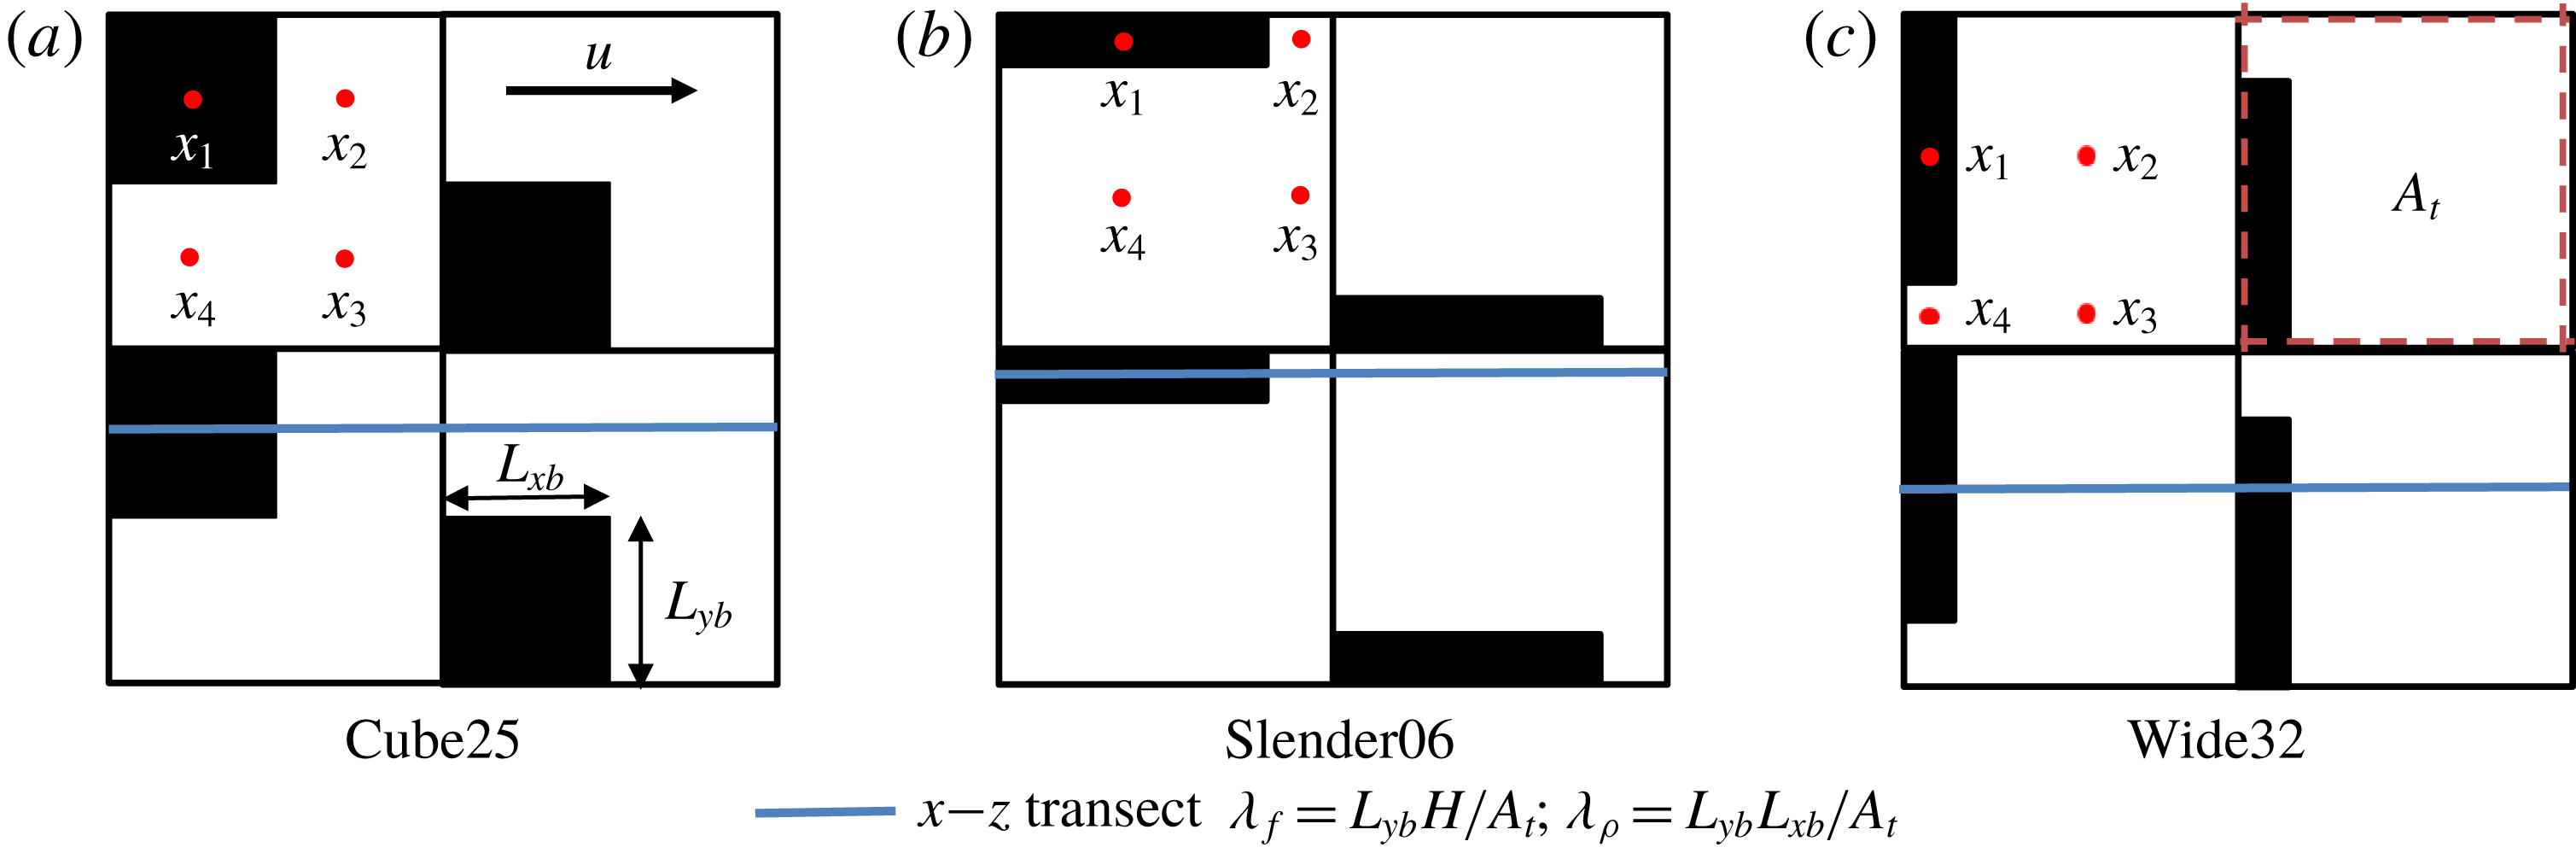
Top view of the ‘repeating unit’ for three cases shown in table 1, where shaded areas represent the obstacles: (a) Cube25; (b) Slender06; (c) Wide32. Area highlighted by red-dotted line is the lot area,
 $A_{t}$
. Different intermediate cases labelled as Sf in table 1 are achieved through varying
 $L_{xb}$
and
 $L_{yb}$
while keeping
 $H$
, the obstacle height, constant. Frontal area density,
 $\unicode[STIX]{x1D706}_{f}$
, and plan area density
 $\unicode[STIX]{x1D706}_{p}$
are defined. Points labelled as
 $x_{1}$
to
 $x_{4}$
(red dots) represent locations where time series of instantaneous data are recorded for analysis. For consistency, we refer to the locations for points
 $x_{1}$
to
 $x_{4}$
as ‘on top’, ‘behind’, ‘in front’ and ‘in between’ the obstacle, respectively, for all cases.

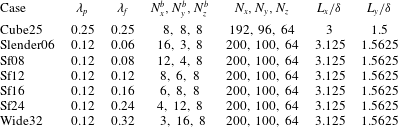
Summary of simulation parameters.
 $H/\unicode[STIX]{x1D6FF}=0.125$
across all cases, where
 $H$
is the height of obstacles.
 $\unicode[STIX]{x1D6FF}$
, the half-channel, is set equal to the domain height
 $L_{z}$
.
 $N_{i}^{b}$
is the number of grid points resolving one obstacle in the
 $i$
direction, while
 $N_{i}$
is the total number of computational points in that direction.
 $L_{x}$
and
 $L_{y}$
are the domain dimensions in the streamwise and cross-stream directions. The two digits at the end of each case name are
 $\unicode[STIX]{x1D706}_{f}\times 100$
for that case. Sf stands for ‘Stagger frontal’.

To explore the effects of the geometry, we conducted simulations of different cases as summarized in table 1 and illustrated in figure 1. The parameters
 $\unicode[STIX]{x1D706}_{f}$
and
 $\unicode[STIX]{x1D706}_{p}$
are the frontal area ratio and plan area ratio, respectively;
 $\unicode[STIX]{x1D706}_{f}$
is defined as the total projected frontal (mean-flow normal) area of the roughness elements per unit wall-parallel area (i.e. land area) and
 $\unicode[STIX]{x1D706}_{p}$
is the ratio between the crest plan area (i.e. roof area, shaded in black figure 1) and the wall-parallel area. The first case is the classic cubical obstacles. In the remaining cases, we gradually change the horizontal aspect ratio of the obstacles, while maintaining the same height and area (
 $\unicode[STIX]{x1D706}_{p}$
). Figure 1 shows the cubical case and the two extreme aspect ratios of the other cases. All cases shown in table 1 were run for 50 eddy turnover times (
 $T\approx \unicode[STIX]{x1D6FF}/u_{\ast }$
) and averaged for the last 25
 $T$
. The averaging time is comparable to that in Leonardi & Castro (Reference Leonardi and Castro2010), where averaging was done over 2000
 $T_{b}$
for
 $T_{b}=H/U_{b}$
;
 $U_{b}$
is the bulk streamwise velocity and
 $H$
is the obstacle height. Throughout the paper and unless otherwise noted,
 $\langle X\rangle$
defines a volume average of
 $X$
over
 $L_{x}L_{y}\unicode[STIX]{x0394}z$
, where
 $\unicode[STIX]{x0394}z$
is the vertical grid size;
 $\overline{X}$
defines a temporal average of
 $X$
. A single prime (
 $^{\prime }$
) denotes deviation from
 $\overline{X}$
, where
 $X=\overline{X}+X^{\prime }$
. A double prime (
 $^{\prime \prime }$
) denotes deviation from
 $\langle \overline{X}\rangle$
, where
 $\overline{X}=\langle \overline{X}\rangle +\overline{X}^{\prime \prime }$
.
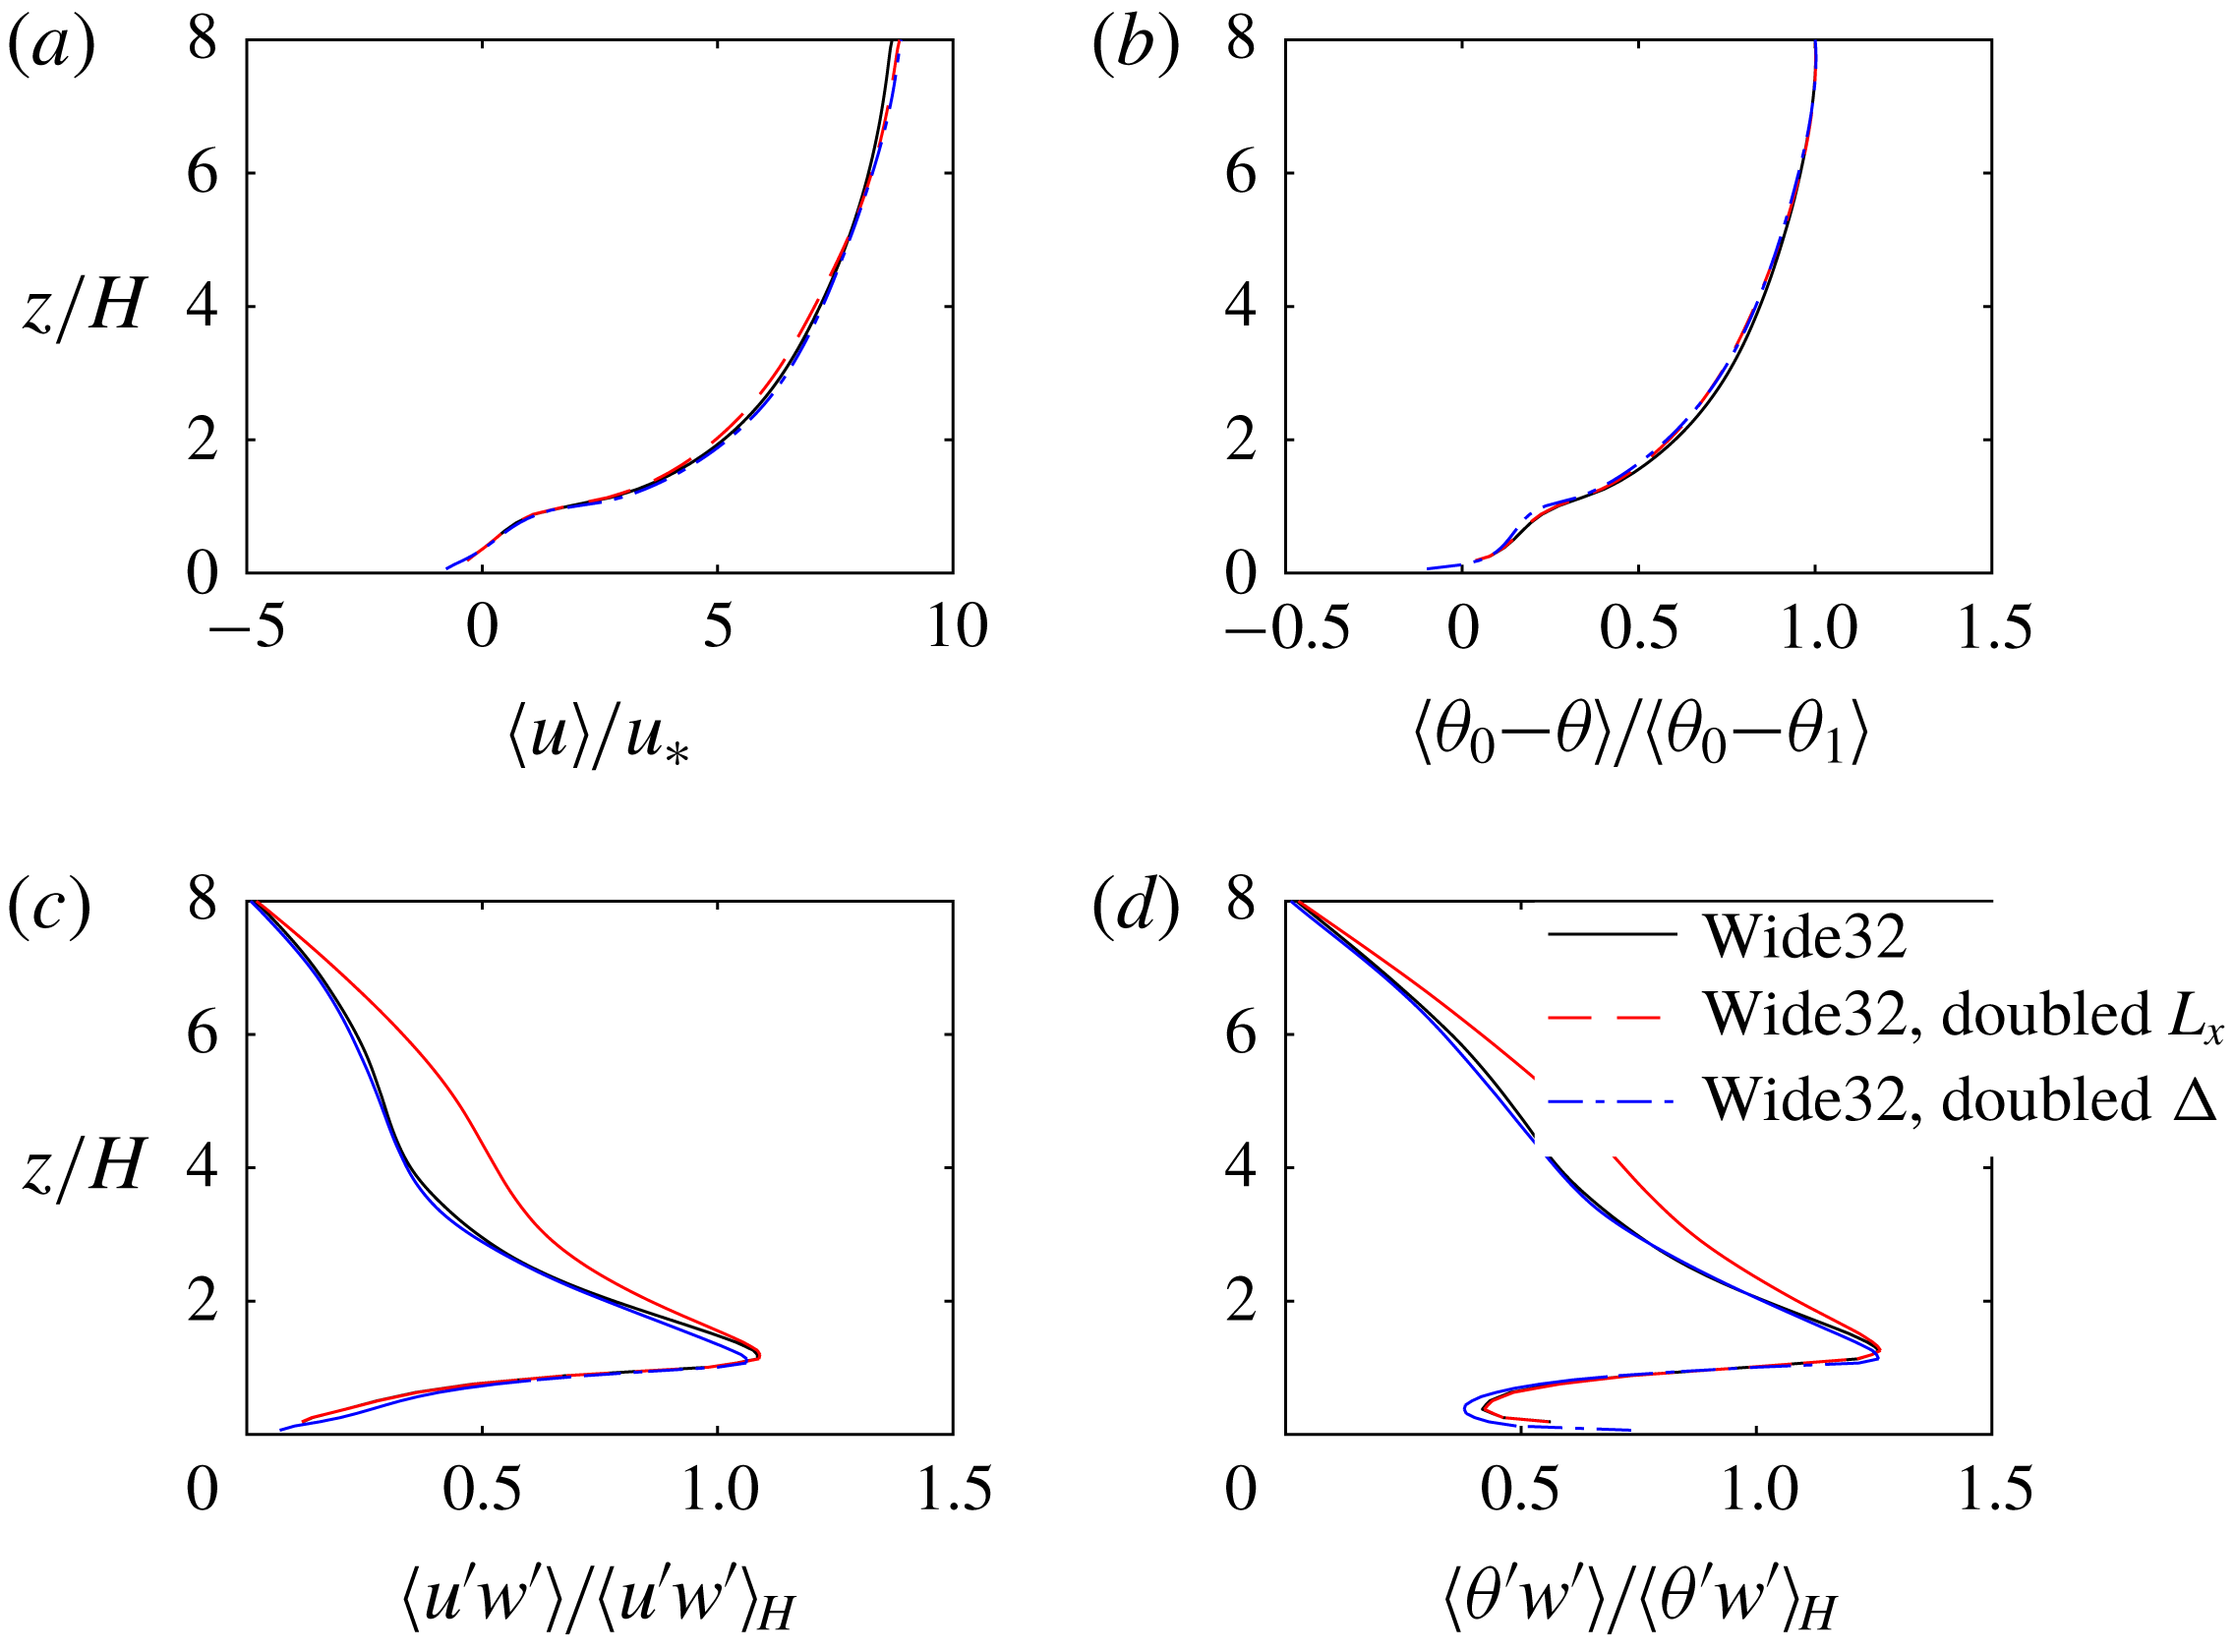
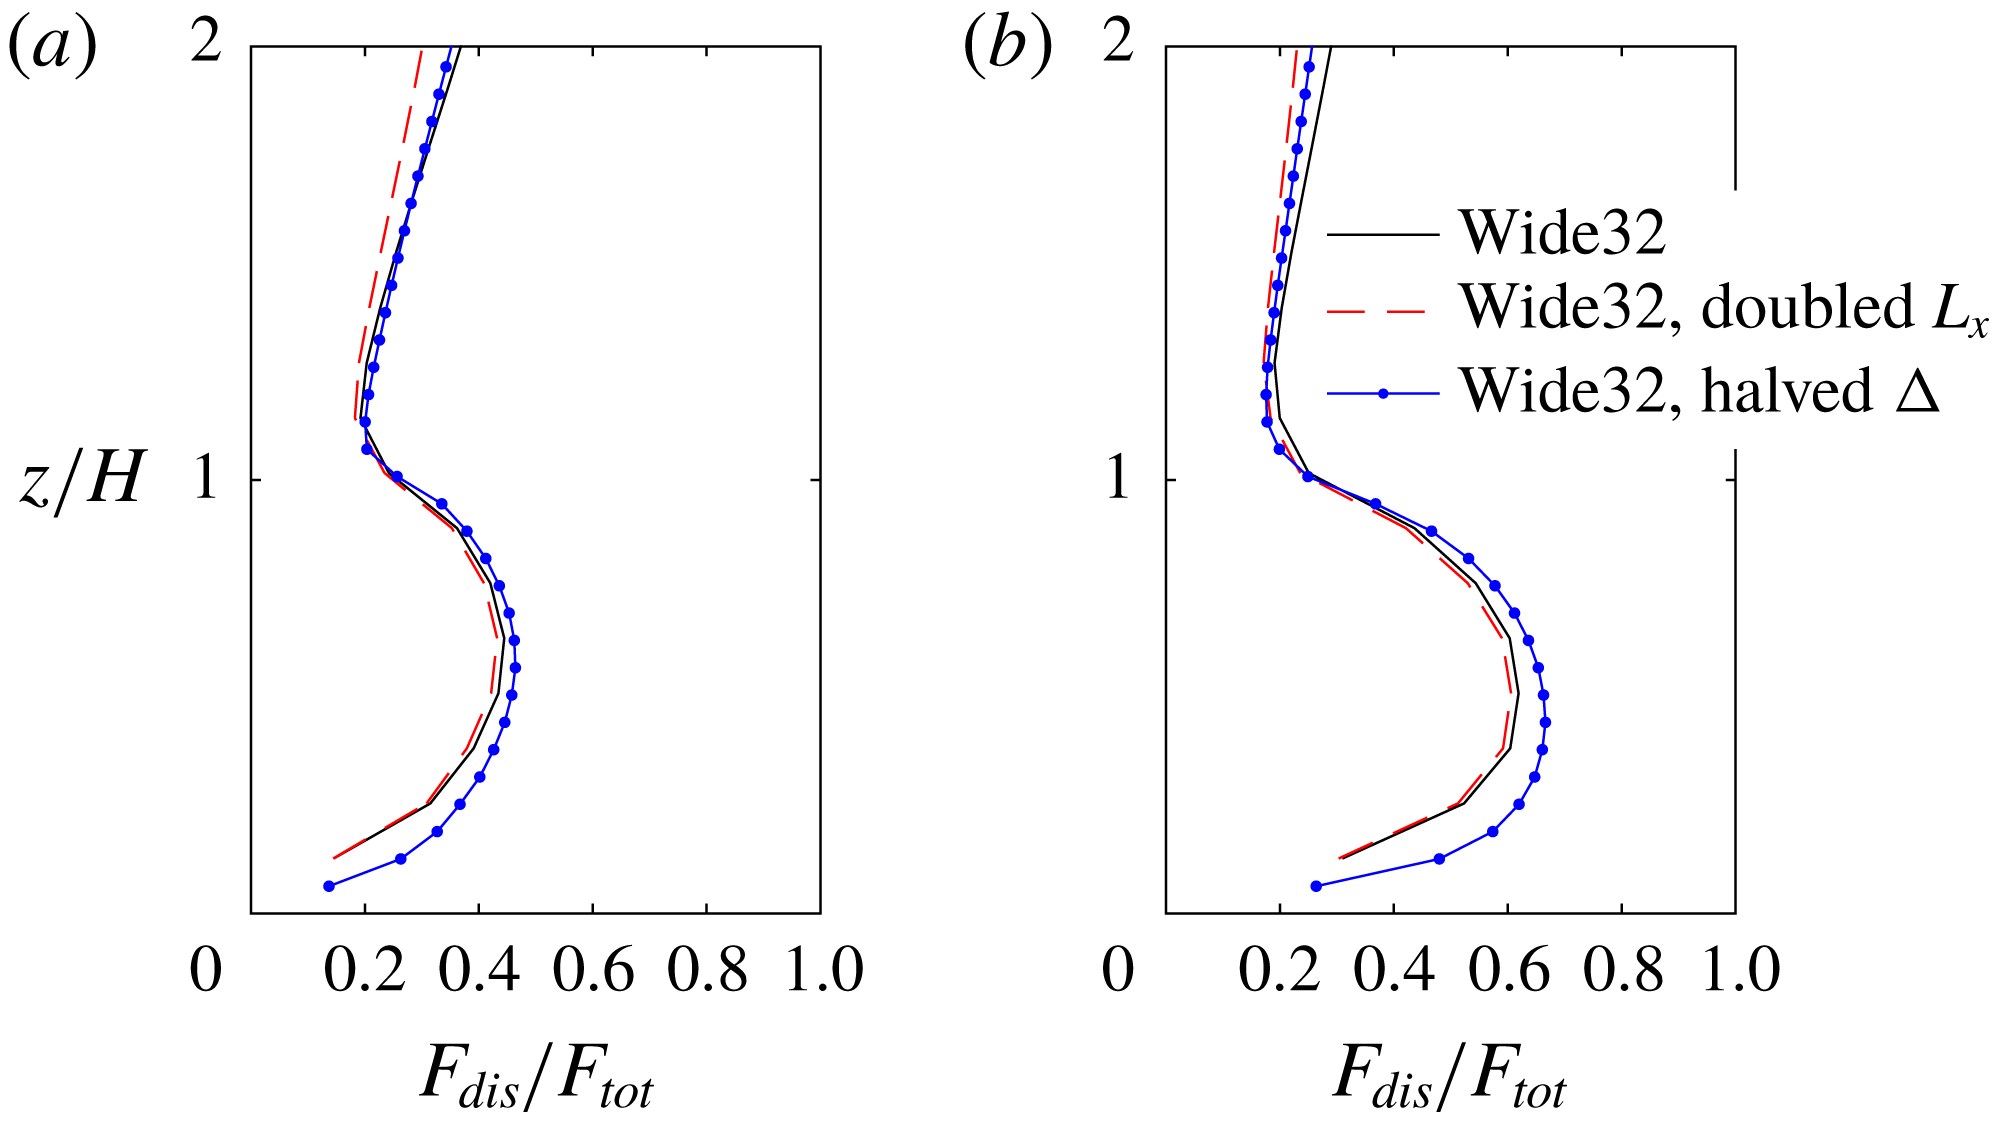
A sensitivity test was carried out to examine the effect of the number of points used to represent the obstacles and the domain length, particularly for cases where one dimension of the cubes is only spanned by three grid points. The comparisons for case Wide32 between the original simulation, a doubled resolution run and a run with doubled
 $L_{x}$
are shown in appendix A. The two simulations with different resolutions show converging results for the turbulent fluxes in the canopy and roughness sublayers. Although some discrepancies exist for the dispersive contributions, the conclusions reached in the present study regarding the Reynolds stress, turbulent scalar flux, dispersive fluxes and the quadrant analysis are insensitive to doubling the grid resolution and the streamwise dimension the computational domain.
3 Results and discussion
3.1 Turbulent transport
3.1.1 Effects of surface geometry
We first focus on the impact of surface geometry on the general turbulent flow characteristics. The parameter space that characterizes the surface geometry is large. A non-exhaustive list of previous studies have investigated height variations (Yang et al.
Reference Yang, Sadique, Mittal and Meneveau2016), geometric shapes (Leonardi et al.
Reference Leonardi, Orlandi, Djenidi and Antonia2015; Yang et al.
Reference Yang, Sadique, Mittal and Meneveau2016; Llaguno-Munitxa, Bou-Zeid & Hultmark Reference Llaguno-Munitxa, Bou-Zeid and Hultmark2017; Llaguno-Munitxa & Bou-Zeid Reference Llaguno-Munitxa and Bou-Zeid2018) of regular (Kanda et al.
Reference Kanda, Moriwaki and Kasamatsu2004; Placidi & Ganapathisubramani Reference Placidi and Ganapathisubramani2015) or irregular (Chester et al.
Reference Chester, Meneveau and Parlange2007; Yuan & Jouybari Reference Yuan and Jouybari2018) surface roughness elements, as well as statistical moments of roughness elements (Zhu et al.
Reference Zhu, Iungo, Leonardi and Anderson2017). We do not aim to comprehensively examine the parameter space in this paper, but we are more interested in the general transition of the flow as the roughness, conserving the same area density
 $\unicode[STIX]{x1D706}_{p}$
, changes from slender elements with low
 $\unicode[STIX]{x1D706}_{f}$
to wide ones with high
 $\unicode[STIX]{x1D706}_{f}$
. Ghisalberti (Reference Ghisalberti2009) analysed the dynamics of flows over many different types of canopies and used the term ‘obstructed shear flows’ to describe them; he concluded that this type of canopy flow can be characterized by the penetration depth (
 $\unicode[STIX]{x1D6FF}_{e}$
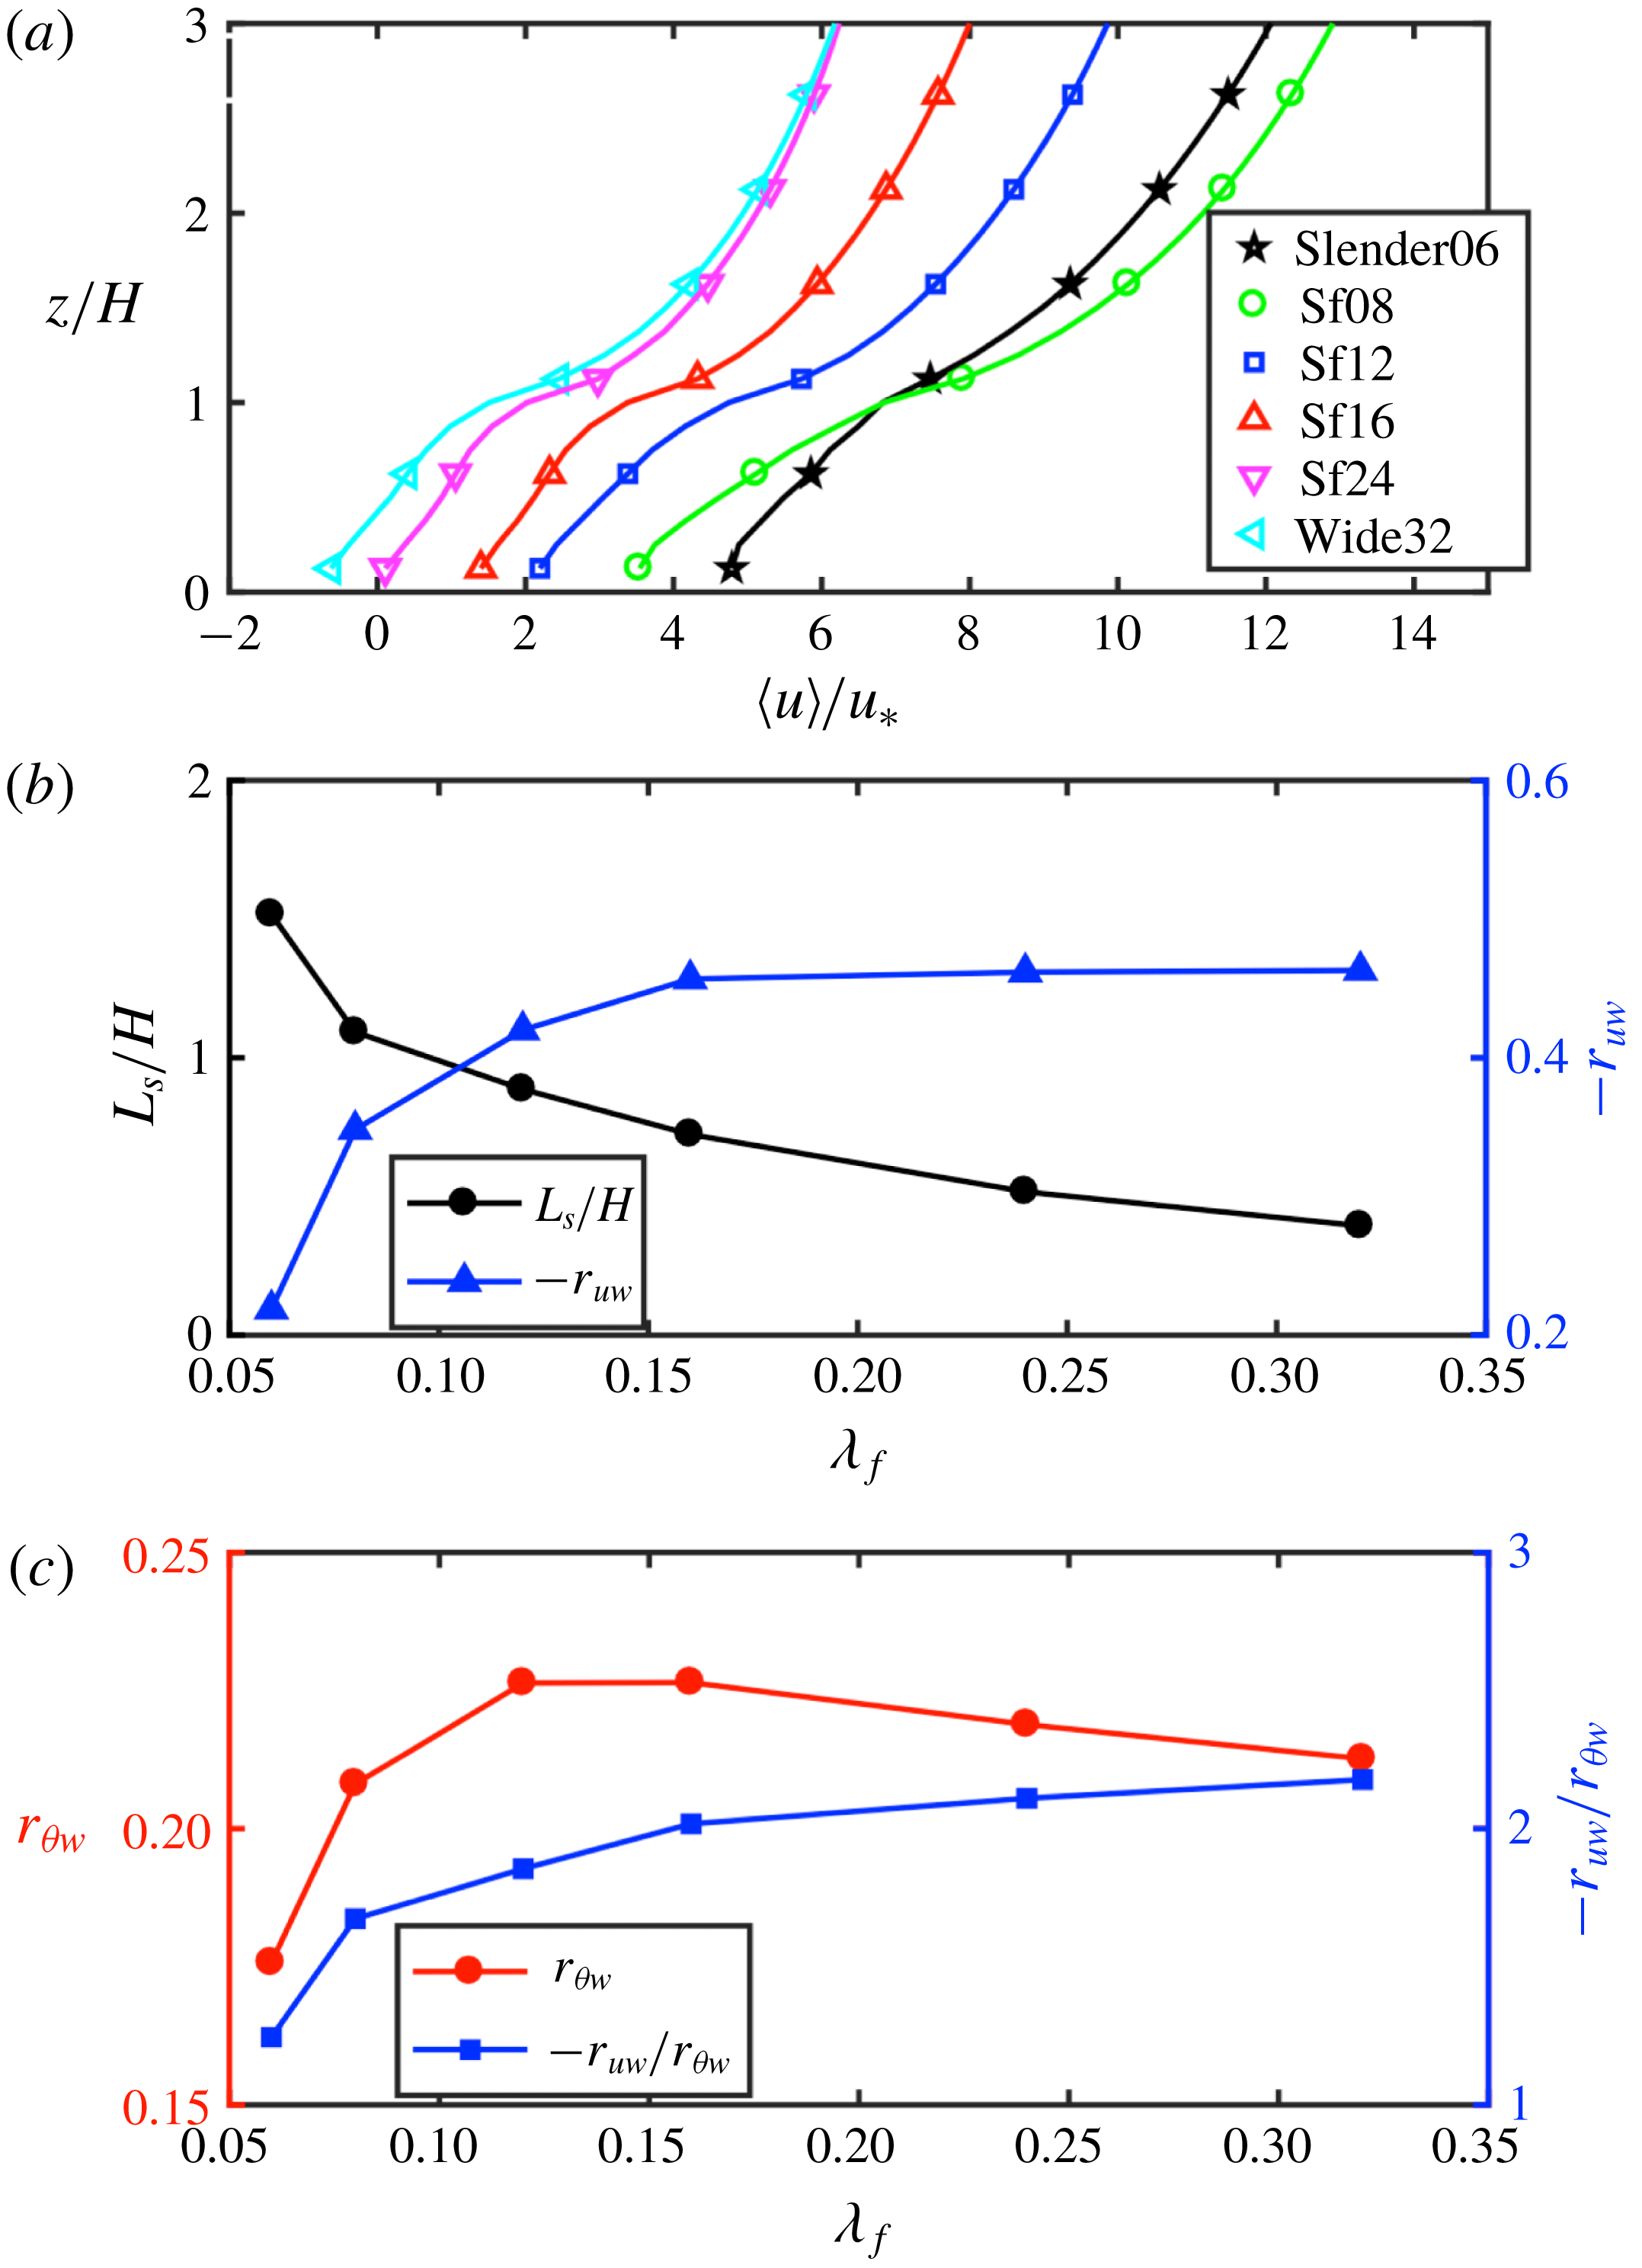
) of the vortices into the canopy sublayer. Inflection points in
 $\langle u\rangle /u_{\ast }$
clearly exist across all cases, especially with increasing
 $\unicode[STIX]{x1D706}_{f}$
as shown in figure 2(a). Figure 2(b) shows the shear scale
 $L_{s}$
, which can serve as an estimate of
 $\unicode[STIX]{x1D6FF}_{e}$
, as a function of the frontal blockage ratio
 $\unicode[STIX]{x1D706}_{f}$
.
 $L_{s}$
is a basic length scale in canopy flows similar to the vorticity thickness defined in a plane mixing layer; it is defined as
 $L_{s}=\langle \bar{u}\rangle /\langle \text{d}\bar{u}/\text{d}z\rangle$
, here computed at
 $z=H$
. The value of
 $L_{s}$
, and consequently
 $\unicode[STIX]{x1D6FF}_{e}$
, decreases with increasing
 $\unicode[STIX]{x1D706}_{f}$
(figure 2
b), which signifies a larger shear strength and hence larger deviation from the classical rough-wall boundary-layer flow as the blockage increases.
 $L_{s}$
for Slender06 and Wide32 differ significantly and additional intermediate cases show a monotonic decrease with
 $\unicode[STIX]{x1D706}_{f}$
, which are consistent with the mean streamwise velocity profiles in figure 2(a).
(a) Value of
 $\langle u\rangle /u_{\ast }$
as a function of
 $z/H$
, where inflection points are present at
 $z/H>1$
; (b) shear length scale
 $L_{s}$
and the correlation coefficient
 $r_{uw}$
for cases listed in table 1 (except cube25) computed at
 $z=H$
; (c)
 $r_{\unicode[STIX]{x1D703}w}$
and
 $r_{uw}/r_{\unicode[STIX]{x1D703}w}$
for the same cases as (a).

The correlation coefficient
 $r_{uw}$
, computed as
 $\langle (\overline{u^{\prime }w^{\prime }})/(\unicode[STIX]{x1D70E}_{u}\unicode[STIX]{x1D70E}_{w})\rangle$
at
 $z=H$
, is also depicted in figure 2(b). Its magnitude can be interpreted as a vertical turbulent momentum transport efficiency (Li & Bou-Zeid Reference Li and Bou-Zeid2011). As
 $\unicode[STIX]{x1D706}_{f}$
increases,
 $-r_{uw}$
increases approximately from 0.2 to 0.46, the latter being consistent with what is typically found in canopy flows and mixing layers (
 $-r_{uw}\approx 0.5$
) (Finnigan Reference Finnigan2003). At a higher elevation of
 $z/H=1.5$
,
 $r_{uw}$
for case Slender06 recovers to 0.43 (not shown here), consistent with observations over a smoother water surface (with negligible influence of surface waves) in the atmospheric inertial sublayer under neutral stratification (Li & Bou-Zeid Reference Li and Bou-Zeid2011). It is worth reiterating that obstacles in all the cases presented in figure 2 have the same plan area density (i.e.
 $\unicode[STIX]{x1D706}_{p}=0.12$
); but by changing
 $\unicode[STIX]{x1D706}_{f}$
, we are observing a transition from a canonical wall-bounded flow to a free shear flow, akin to a mixing layer, where momentum turbulent transport is more efficient.
As this transition occurs, and unlike for its momentum counterpart, the vertical transport efficiency for the scalar exhibits a non-monotonic behaviour (figure 2
c), reaching a peak of approximately 0.23 at around
 $\unicode[STIX]{x1D706}_{f}=0.12$
. For large
 $\unicode[STIX]{x1D706}_{f}$
, while momentum
 $r_{uw}$
is more than twice larger than its value at
 $\unicode[STIX]{x1D706}_{f}=0.06$
, the scalar
 $r_{\unicode[STIX]{x1D703}w}$
changes less significantly with changing geometry. Overall, the results show that, as the flow becomes more mixing layer like, the momentum and scalar transport efficiencies increasingly diverge. The ratio of their correlation coefficients becomes appreciably larger than 1 (figure 2
c), making the Reynolds analogy (which postulates that momentum and scalars are transported similarly) less applicable. Note that we do not imply that the flow over a very rough wall or vegetation canopy completely resembles the canonical mixing-layer flow. Rather, the examples shown in the present study demonstrate that the rough wall-bounded flows can exhibit mixed properties of wall-bounded and mixing layer flows (Kanda Reference Kanda2006).
To gain a better understanding of the turbulent statistics at representative points with respect to the roughness elements, we sampled data at four different points
 $x_{1}$
–
 $x_{4}$
(see figure 1) for all heights. The pointwise time series of relevant quantities are recorded at a frequency of
 $1/(2500T)$
, where
 $T$
is the eddy turnover time defined previously. Data were sampled at each time step for a total period of 2
 $T$
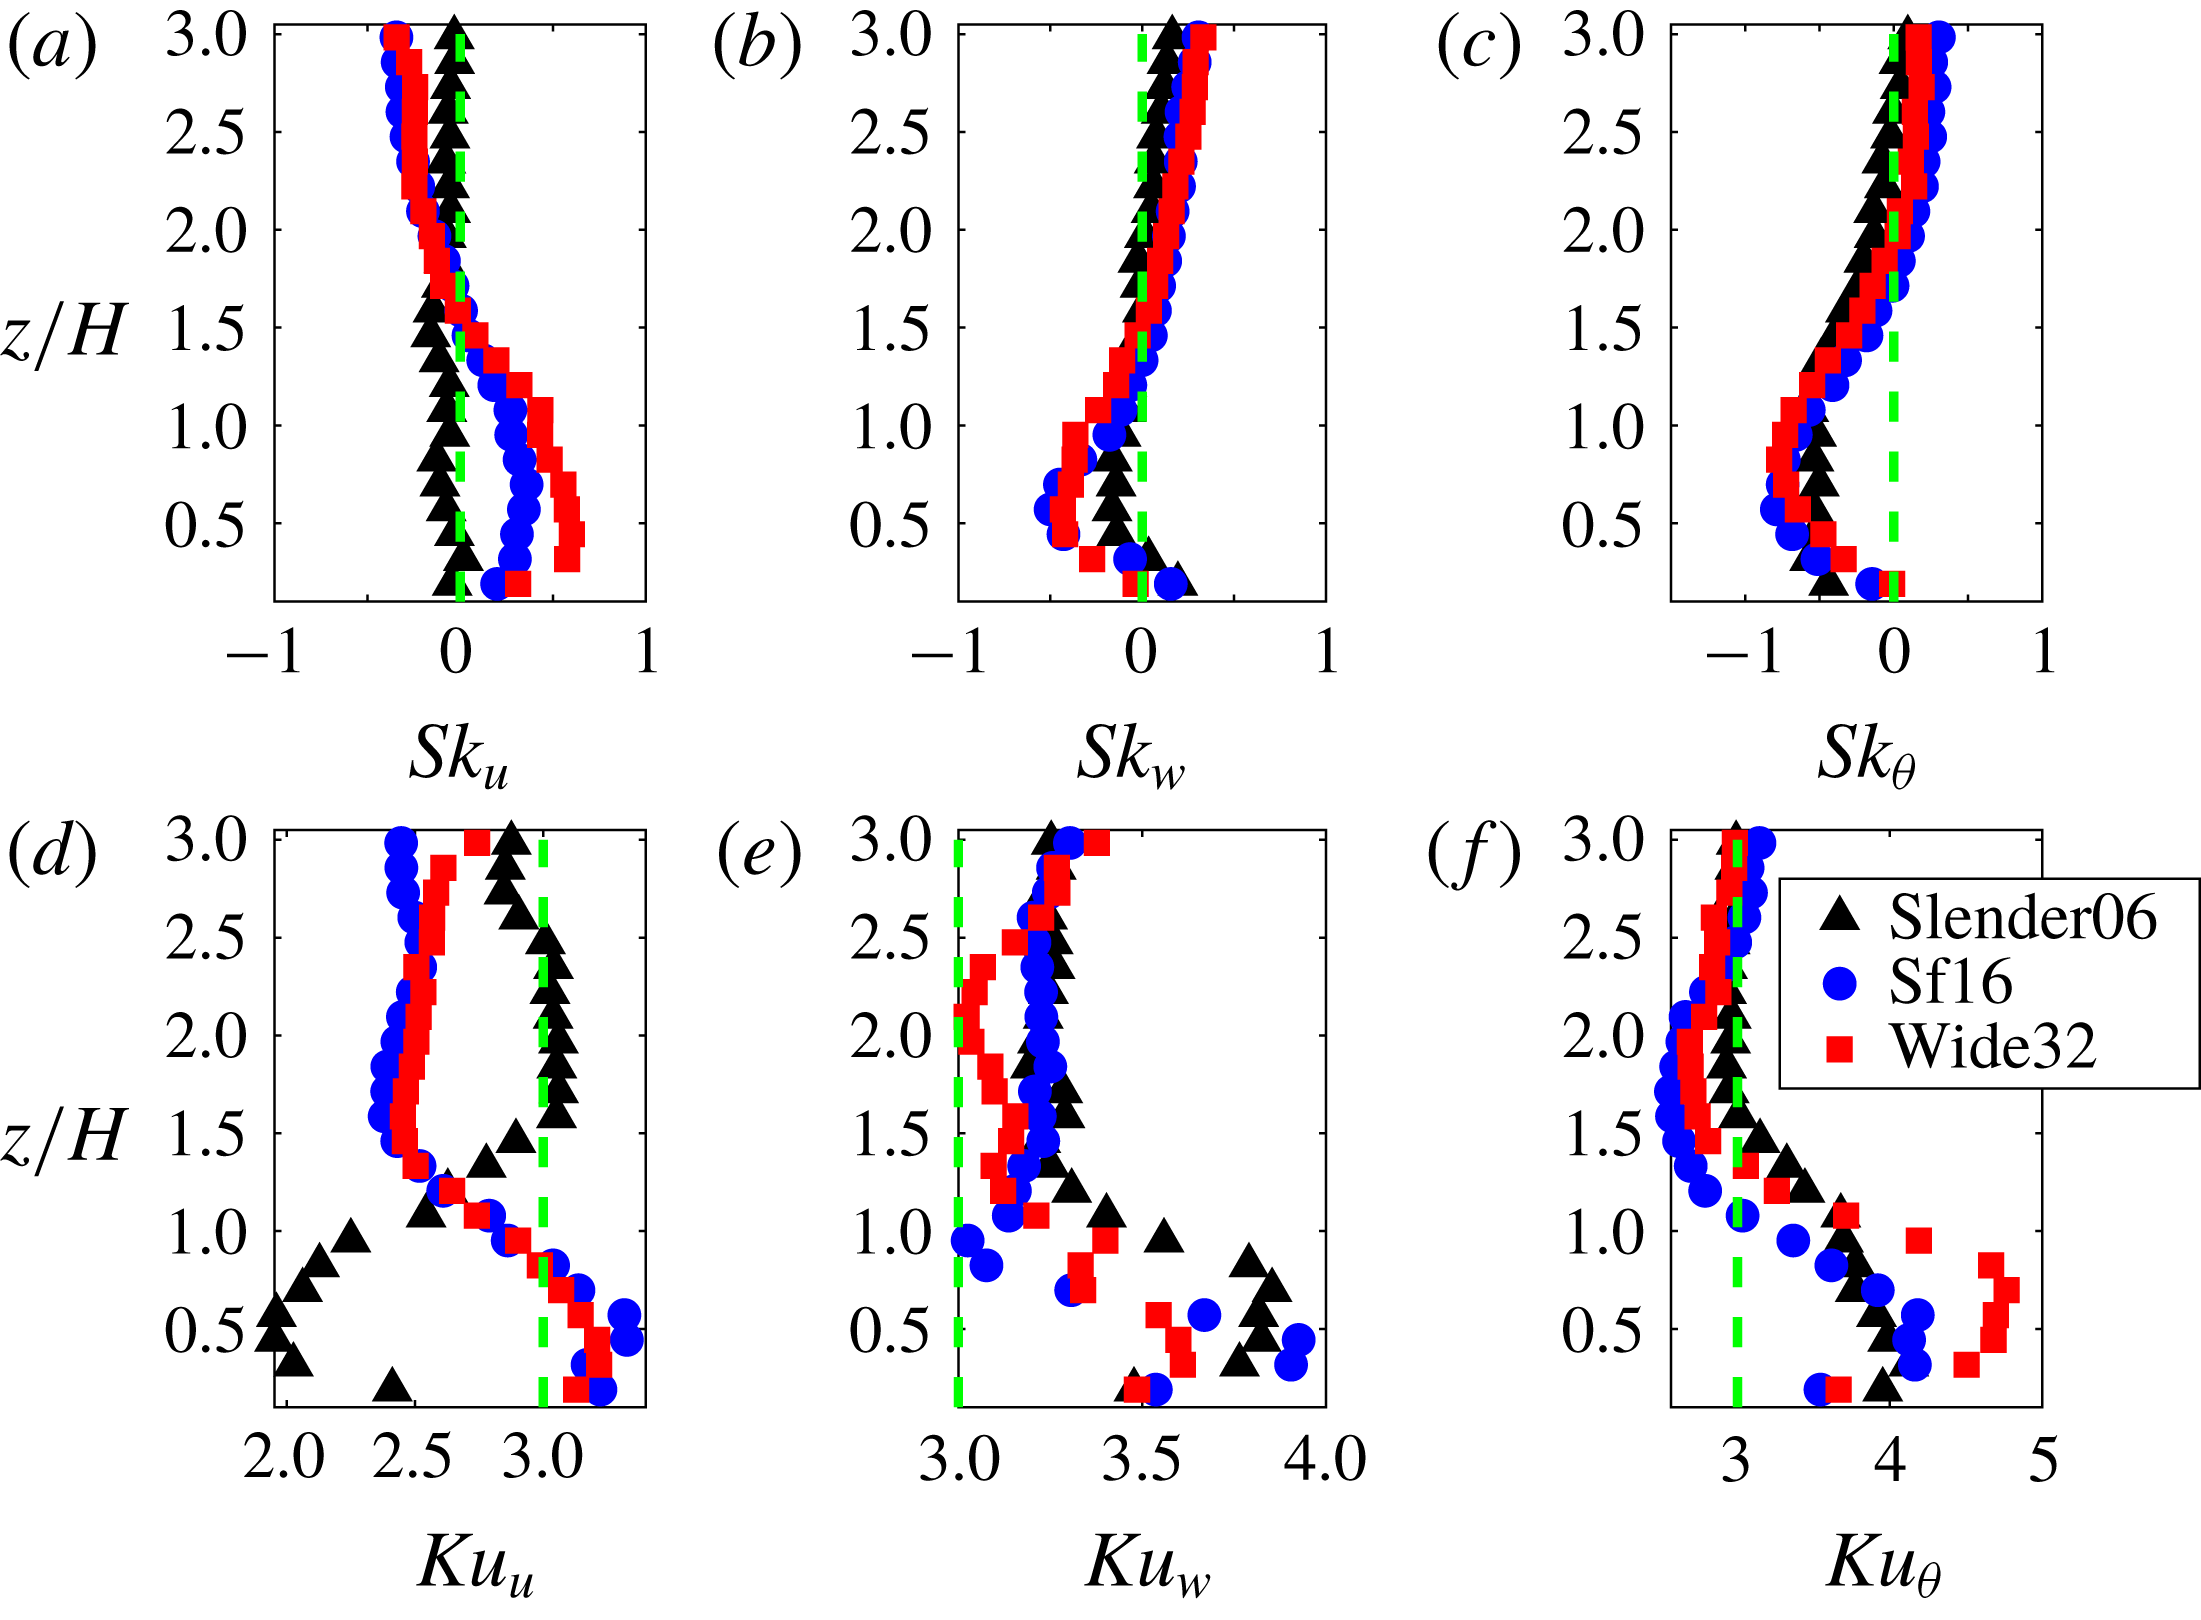
. This time averaging alone is not sufficiently long to guarantee complete statistical convergence of the results. However, the statistics were also phase averaged for all repeating units to improve statistical convergence and the primary characteristics of the flow that we will focus on are already very clear with this averaging scheme. Turbulent fluctuations tend to be non-Gaussian for canopy flows over vegetation surfaces (Raupach Reference Raupach1981; Rotach Reference Rotach1993; Finnigan Reference Finnigan2003; Chamecki Reference Chamecki2013). The skewness of a fluctuating component is an indication of the dominance of either positive or negative events given its probability distribution. As pointed out in Mouri et al. (Reference Mouri, Takaoka, Hori and Kawashima2003) in a laboratory experiment of rough-wall-bounded flow over cubical arrays, the wakes associated with the roughness elements result in correlations between the Fourier modes of the energy-containing eddies, whereas the Fourier modes are independent and random for the case of Gaussian turbulence. To further investigate the transition from a wall-bounded to a mixing-layer flow regime, first, we computed the skewness of the fluctuating components shown in figure 3(a–c) for point
 $x_{3}$
for
 $u/u_{\ast }$
,
 $w/u_{\ast }$
and
 $\unicode[STIX]{x1D703}/\unicode[STIX]{x1D703}_{1}$
, where
 $\unicode[STIX]{x1D703}_{1}=\unicode[STIX]{x1D703}(z=\unicode[STIX]{x1D6FF})$
. We only illustrate three cases with the same
 $\unicode[STIX]{x1D706}_{p}$
, spanning the full range of
 $\unicode[STIX]{x1D706}_{f}$
. Slender06 has close to zero skewness for
 $u^{\prime }$
and
 $w^{\prime }$
(figure 3
a,b) in the roughness sublayer but higher values are observed as
 $\unicode[STIX]{x1D706}_{f}$
increases in cases Sf16 and Wide32, more typical of canopy flows from experimental measurements over vegetation canopies (Raupach Reference Raupach1981; Rotach Reference Rotach1993; Finnigan Reference Finnigan2003). The variation in skewness from small values in Slender06 to larger ones as
 $\unicode[STIX]{x1D706}_{f}$
increases is consistent with what is expected based on the characteristics of wall-bounded and mixing-layer flows shown in table 2 of Finnigan (Reference Finnigan2003). In figure 3(d–f), the kurtosis
 $Ku_{u}$
and
 $Ku_{\unicode[STIX]{x1D703}}$
tends to approach 3 away from the roughness, deviating from that Gaussian value as the wall is approached. An exception is the
 $u^{\prime }$
kurtosis of cases Sf16 and Wide32, which is closer to 3 in the canopy sublayer. However, it should be noted that a kurtosis of 3 is a necessary but not a sufficient condition for the fluctuations to be Gaussian (a bimodal distribution could also have a kurtosis of 3). Two final observations on figure 3: (i) the skewness and kurtosis of
 $\unicode[STIX]{x1D703}$
are much less sensitive to geometry, in agreement with the findings based on the transport efficiency in figure 2, and (ii) while the skewness plots suggest a convergence of the various geometries at
 $z/H\approx 2$
, the kurtosis continues to show significant differences at that height.
Skewness and kurtosis of fluctuating quantities at
 $x_{3}$
:
 $u^{\prime }$
in (a,d);
 $w^{\prime }$
in (b,e);
 $\unicode[STIX]{x1D703}^{\prime }$
in (c,f). Green dotted lines indicate
 $\text{skewness}=0$
in (a–c) and
 $\text{kurtosis}=3$
in (d–f).

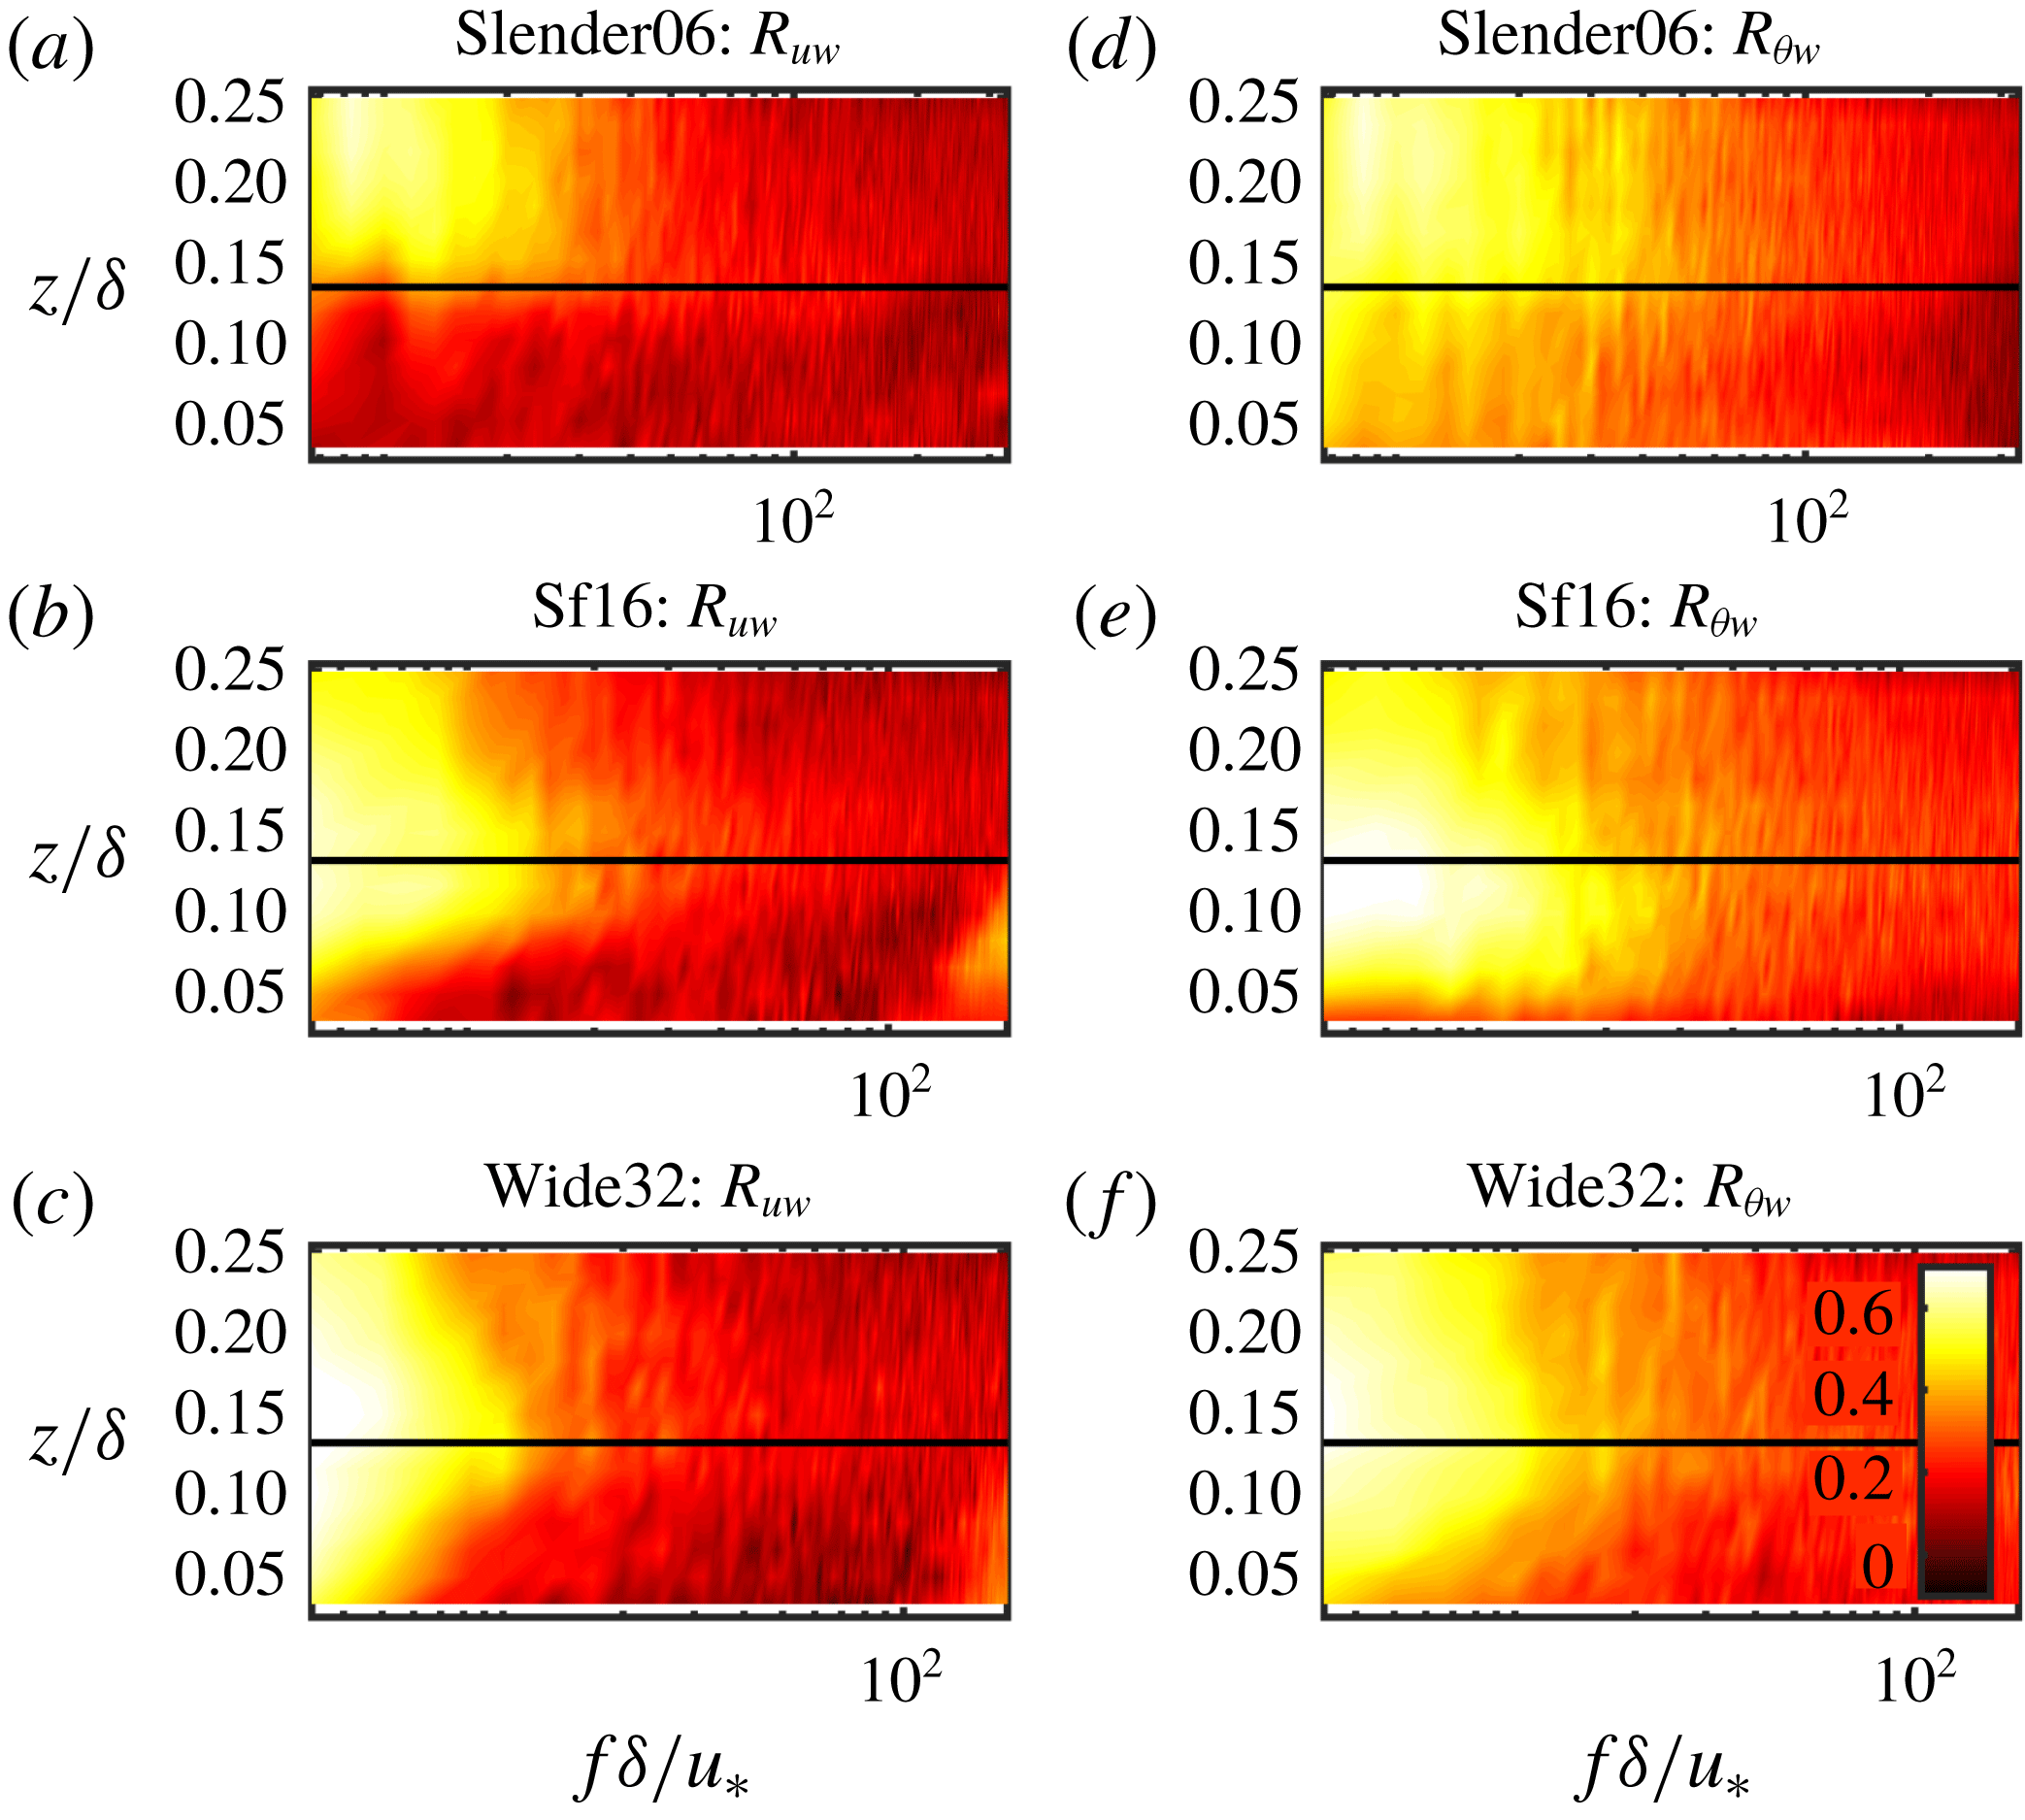
Since in physical space we observed that changes in surface roughness modify the characteristic length scale and turbulence statistics, we now examine in spectral space if that also implies a modification in the range of eddy scales that contribute the most to the turbulent transport. In the frequency domain, the correlation spectrum (Wang et al.
Reference Wang, Smith, Ramamurthy, Baeck, Bou-Zeid and Scanlon2016) is defined as
 $R_{XY}=Co_{XY}/(\sqrt{\unicode[STIX]{x1D6E4}_{X}}\sqrt{\unicode[STIX]{x1D6E4}_{Y}})$
, where
 $Co_{XY}$
is the cospectrum of time series
 $X$
and
 $Y$
and
 $\unicode[STIX]{x1D6E4}_{X}$
and
 $\unicode[STIX]{x1D6E4}_{Y}$
are the power spectra of
 $X$
and
 $Y$
, respectively. If
 $Y$
is vertical velocity fluctuations
 $w^{\prime }$
and
 $X$
is
 $u^{\prime }$
or
 $\unicode[STIX]{x1D703}^{\prime }$
,
 $R_{XY}$
is interpreted as a frequency specific transport efficiency (Wang et al.
Reference Wang, Smith, Ramamurthy, Baeck, Bou-Zeid and Scanlon2016). The total length of the collected time series defined in time unit
 $L_{z}/U_{0}$
is approximately 60, where
 $U_{0}$
is the free-stream velocity. We then section the total time series into 20 sub-series of equal length, and perform an ensemble average of the spectra of the 20 samples at each representative point
 $x_{i}$
. The presence of the obstacles makes the interpretation of spectra computed from spatial fields challenging (for example they would contain the dispersive contribution), and thus we rely on time series at a given point instead. One could convert the frequency to a wavenumber using Taylor’s frozen turbulence hypothesis, but this might lead to some uncertainties in the conversion (Cheng et al.
Reference Cheng, Sayde, Li, Basara, Selker, Tanner and Gentine2017) that we prefer to avoid here. The results are shown in figure 4, where only results at
 $x_{3}$
(in front of the obstacle) are presented; similar conclusions can be obtained from the results at other points (not shown here).
Pseudocolour plot of the correlation spectra
 $R_{uw}$
in (a–c) and
 $R_{\unicode[STIX]{x1D703}w}$
in (d–f) for different cases
 $x_{3}$
. The solid horizontal black line denotes the top of the obstacles.

Low-frequency eddies contribute to the efficient transport of both momentum and scalars, but a wider range of scales contribute to
 $R_{\unicode[STIX]{x1D703}w}$
. Higher correlation spectrum values can be noted for scalars, compared to momentum, for all three cases between
 $10<f\unicode[STIX]{x1D6FF}/u_{\ast }<10^{2}$
. As the roughness frontal blockage, and the streamwise distance between the elements, increase (e.g. for case Wide32), more lower-frequency motions can penetrate into the canopy more easily and they become more efficient in transporting momentum below the canopy top (figures 4
a to 4
c). This finding for cases with larger
 $\unicode[STIX]{x1D706}_{f}$
is consistent with the results obtained from hot-wire anemometry measurements in a wind tunnel by Perret et al. (Reference Perret, Basley, Mathis and Piquet2019), who noted that the canopy-induced smaller-scale motions strongly interact with the boundary-layer-scale motions. For scalars on the other hand, it seems slower motions spanning a larger range of frequency are the most efficient at transport deep inside the canopy at intermediate densities
 $\unicode[STIX]{x1D706}_{f}$
(case Sf16), becoming less efficient in case Wide32. In summary, figure 4 shows the change in time scales of the most efficient transport eddies across different geometries. As the transition to a mixing-layer-type flow indicated in figure 2 occurs, lower frequencies contribute more effectively to momentum transport in the canopy and roughness sublayer. However, for scalar transport, there seems to be an optimal configuration or density for the large scalar motions to interact effectively with the lower part of the canopy.
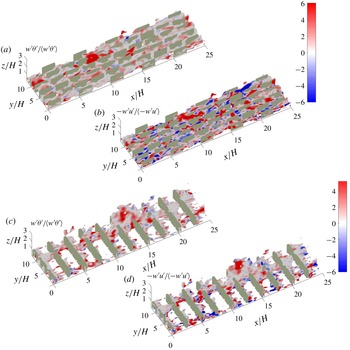
The iso-surfaces of instantaneous high temperature,
 $\unicode[STIX]{x1D703}_{high}$
, are shown in figure 5. Here,
 $\unicode[STIX]{x1D703}_{high}$
is defined as
 $\unicode[STIX]{x1D703}+1.5\unicode[STIX]{x1D703}_{rms}$
computed at
 $z/H=1$
at any instant. We colour these iso-surfaces by the instantaneous normalized Reynolds stress and wall-normal scalar flux (figures 5
b,d and 5
e,f, respectively). Although both Slender06 and Wide32 demonstrate streamwise thermal ‘streaks’ (Hetsroni et al.
Reference Hetsroni, Mosyak, Rozenblit and Yarin1999; Leonardi et al.
Reference Leonardi, Orlandi, Djenidi and Antonia2015), Wide32 is characterized by more patchy structures in most of the domain; whereas the temperature iso-surfaces in Slender06 are more elongated in the streamwise direction and are aligned in between the staggered roughness elements.
Stronger flow disturbance by the obstacles are observed in the mixing-layer-like flow where the more obstructive three-dimensional geometry is found to significantly disrupt the structures, in agreement with the experimental observations in Hetsroni et al. (Reference Hetsroni, Mosyak, Rozenblit and Yarin1999). Focusing now on the flux intensity depicted by the colours on the instantaneous flow structures, there can also be discernible dissimilarities between
 $w^{\prime }\unicode[STIX]{x1D703}^{\prime }$
and
 $-w^{\prime }u^{\prime }$
in the canopy sublayer, suggesting that some eddies might be carrying momentum but not scalars or vice versa. Thus, we conduct a quadrant analysis in the next section to further investigate the (dis)similarity of momentum and scalar transport.
Iso-surfaces of
 $\unicode[STIX]{x1D703}_{high}$
, where
 $\unicode[STIX]{x1D703}_{high}=\langle \unicode[STIX]{x1D703}(z=H)\rangle +1.5(\unicode[STIX]{x1D703}_{rms}(z=H))$
low-pass filtered for better visualization, for Slender06 in (a,b) and for Wide32 in (c,d).
 $\unicode[STIX]{x1D703}_{rms}(z=H)$
denotes the standard deviation of a snapshot of
 $\unicode[STIX]{x1D703}$
at
 $z=H$
.

3.1.2 Similarity of turbulent momentum and scalar transport
Quadrant analysis is a useful and widely used technique for probing how turbulent motions evolve and produce transport in the wall-normal direction (Wallace Reference Wallace2016). Thus, we apply this technique here to compare the momentum and scalar turbulent transports over the canopy and roughness sublayers. The definition of each quadrant for momentum flux follows previous studies (Katul, Hsieh & Kuhn Reference Katul, Hsieh and Kuhn1997a
; Katul et al.
Reference Katul, Kuhn, Schieldge and Hsieh1997b
; Li & Bou-Zeid Reference Li and Bou-Zeid2011): Q1 events are classified as
 $s^{\prime }>0$
and
 $w^{\prime }>0$
; Q2 as
 $s^{\prime }<0$
and
 $w^{\prime }>0$
; Q3 as
 $s^{\prime }<0$
and
 $w^{\prime }<0$
; Q4 as
 $s^{\prime }>0$
and
 $w^{\prime }<0$
, where
 $s$
is
 $u$
or
 $\unicode[STIX]{x1D703}$
. A prime denotes the turbulent perturbation of an instantaneous value from its Reynolds average, surrogated for here only by a time average and denoted by an overbar. We applied quadrant analysis to time series collected at the four representative horizontal locations (
 $x_{1}$
to
 $x_{4}$
) indicated in figure 1 and at every height, but we will only show results for
 $x_{2}$
and
 $x_{3}$
since the other locations convey the same information (they are shown in appendix B). The same averaging procedure detailed for the results of the skewness is used here. For the momentum flux, Q2 and Q4 are termed ejections and sweeps respectively; for scalar flux, Q1 (motion that transports higher concentrations of the scalar upward, the wall being a source here) and Q3 (motion that brings lower concentrations downward) are termed ejections and sweeps, respectively. Compared to the other two quadrants, the ejections and sweeps are the dominant events in transporting momentum and scalars; they contribute to down-gradient transport.
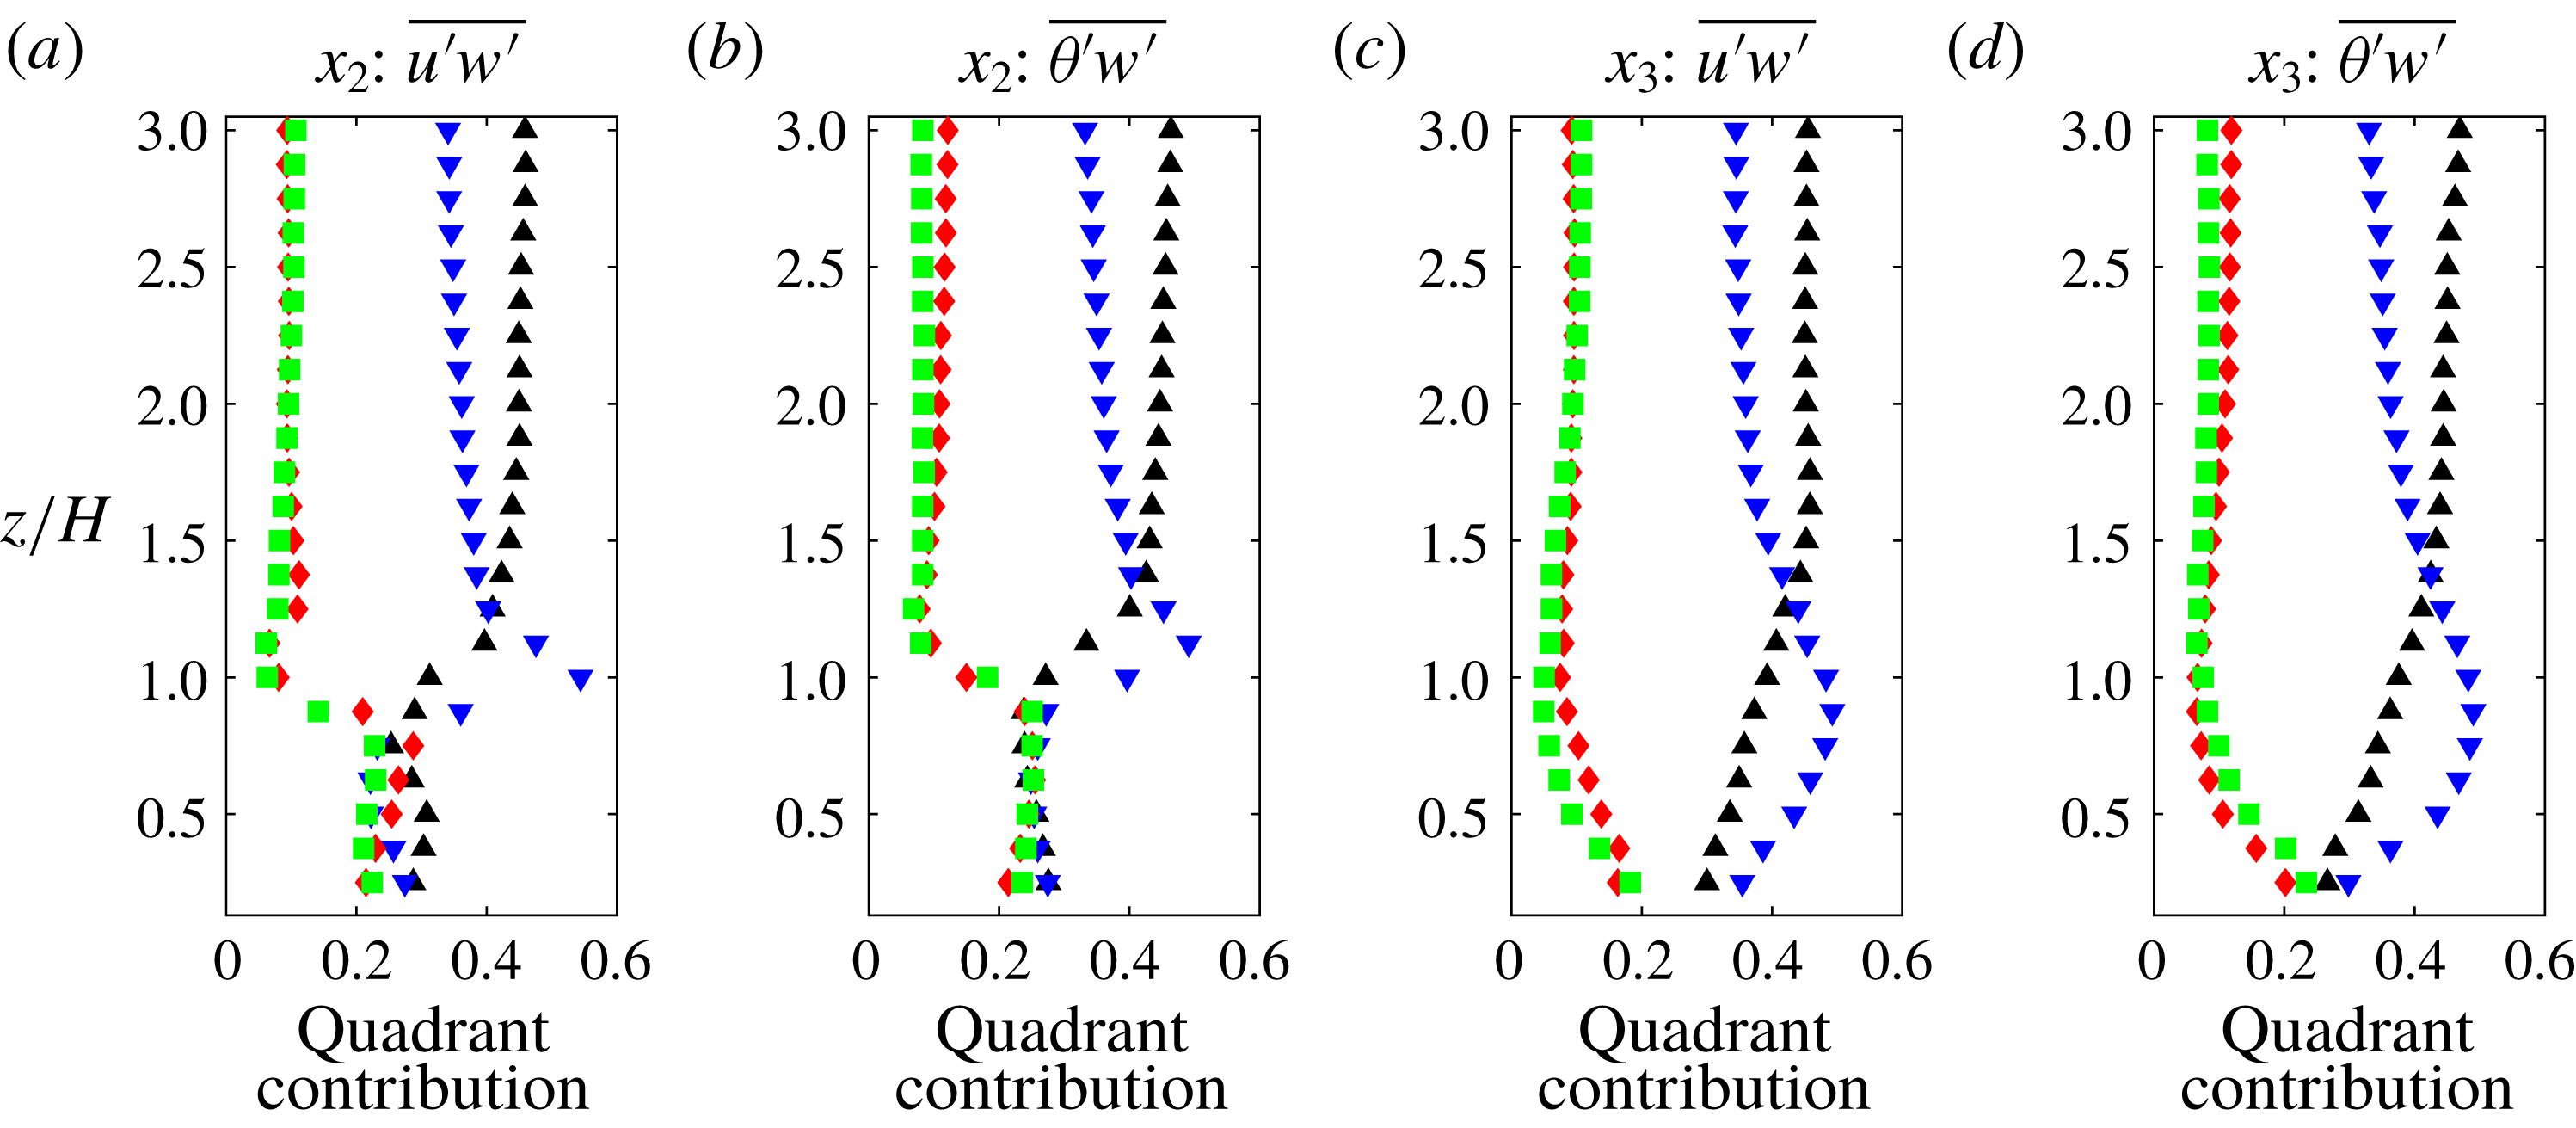
Contribution to total flux for (a,c) momentum and (b,d) scalar at points
 $x_{2}$
(back) and
 $x_{3}$
(front) in case Cube25. Ejections are black ▵; sweeps are blue ▿; outward interactions (
 $w^{\prime }>0$
and
 $u^{\prime }>0$
or
 $\unicode[STIX]{x1D703}^{\prime }<0$
) are red ♢; and inward interactions (
 $w^{\prime }<0$
and
 $u^{\prime }<0$
or
 $\unicode[STIX]{x1D703}^{\prime }>0$
) are green ▫.

Figure 6 shows the contributions from various quadrants (momentum in a,c; scalar in b,d) for case Cube25, where the contribution of quadrant
 $i$
is defined as
 $|\overline{s^{\prime }w^{\prime }}|_{i}/~\sum _{i}|\overline{s^{\prime }w^{\prime }}|$
. The contribution of each quadrant to scalar fluxes is broadly similar to that of momentum across all points, though slight differences between momentum and scalars are seen inside the canopy sublayer below
 $z/H=1$
. The spatial variation across the four different horizontal location in the canopy sublayer is on the other hand significant, underlining the complexity of the flow within these three-dimensional roughness arrays. These differences blend away above the canopy. The number of ejection events exceeds that of sweeps below
 $z/H=1.25$
across all four points (not all shown here), indicating that below this height sweeping events are stronger compared to the more frequent and less intense ejections. The cross-over point at
 $z/H=1.25$
is consistent with results for the Reynolds stress from DNS reported by Coceal et al. (Reference Coceal, Dobre, Thomas and Belcher2007a
) for the same underlying roughness geometry of staggered cubes, although they averaged over all points at a given
 $z$
. It has been previously observed that for momentum transport the sweeps’ contribution to total stress dominates over ejections in the neutral roughness sublayers of vegetation canopies (Dupont & Patton Reference Dupont and Patton2012) and in a realistic urban area characterized by large roughness elements (Rotach Reference Rotach1993; Christen, van Gorsel & Vogt Reference Christen, van Gorsel and Vogt2007). Dominance of sweeps in momentum transport over very rough walls, compared to the dominance of ejections over smooth and less rough counterparts, is in general agreement with the picture proposed and discussed in detail by Raupach, Finnigan & Brunei (Reference Raupach, Finnigan and Brunei1996) who adopted a mixing-layer analogy for these very rough walls to account for the differences compared to typical flows over smooth or small-roughness walls. In the outer layer, the dominance of ejections is restored as typical in smooth-wall boundary layers (Adrian Reference Adrian2007).
Our results for case Cube25 demonstrate that the turbulent transport of a passive scalar exhibits similar behaviour to momentum. Similarity or dissimilarity between momentum and passive scalar transport over wall-bounded turbulent flows has also been discussed in the literature. For instance, similarity in the transport is found in laboratory results (Perry & Hoffmann Reference Perry and Hoffmann1976; Nagano & Tagawa Reference Nagano and Tagawa1988) over smooth surfaces and field measurements in the atmospheric boundary layer over vegetation canopy and in the roughness sublayer over an urban area (Dupont & Patton Reference Dupont and Patton2012; Wang et al.
Reference Wang, Li, Gao, Sun, Guo and Bou-Zeid2014), and in DNS over two-dimensional square-shaped obstacles (Leonardi et al.
Reference Leonardi, Orlandi, Djenidi and Antonia2015). Dissimilarity is not as extensively reported (Christen et al.
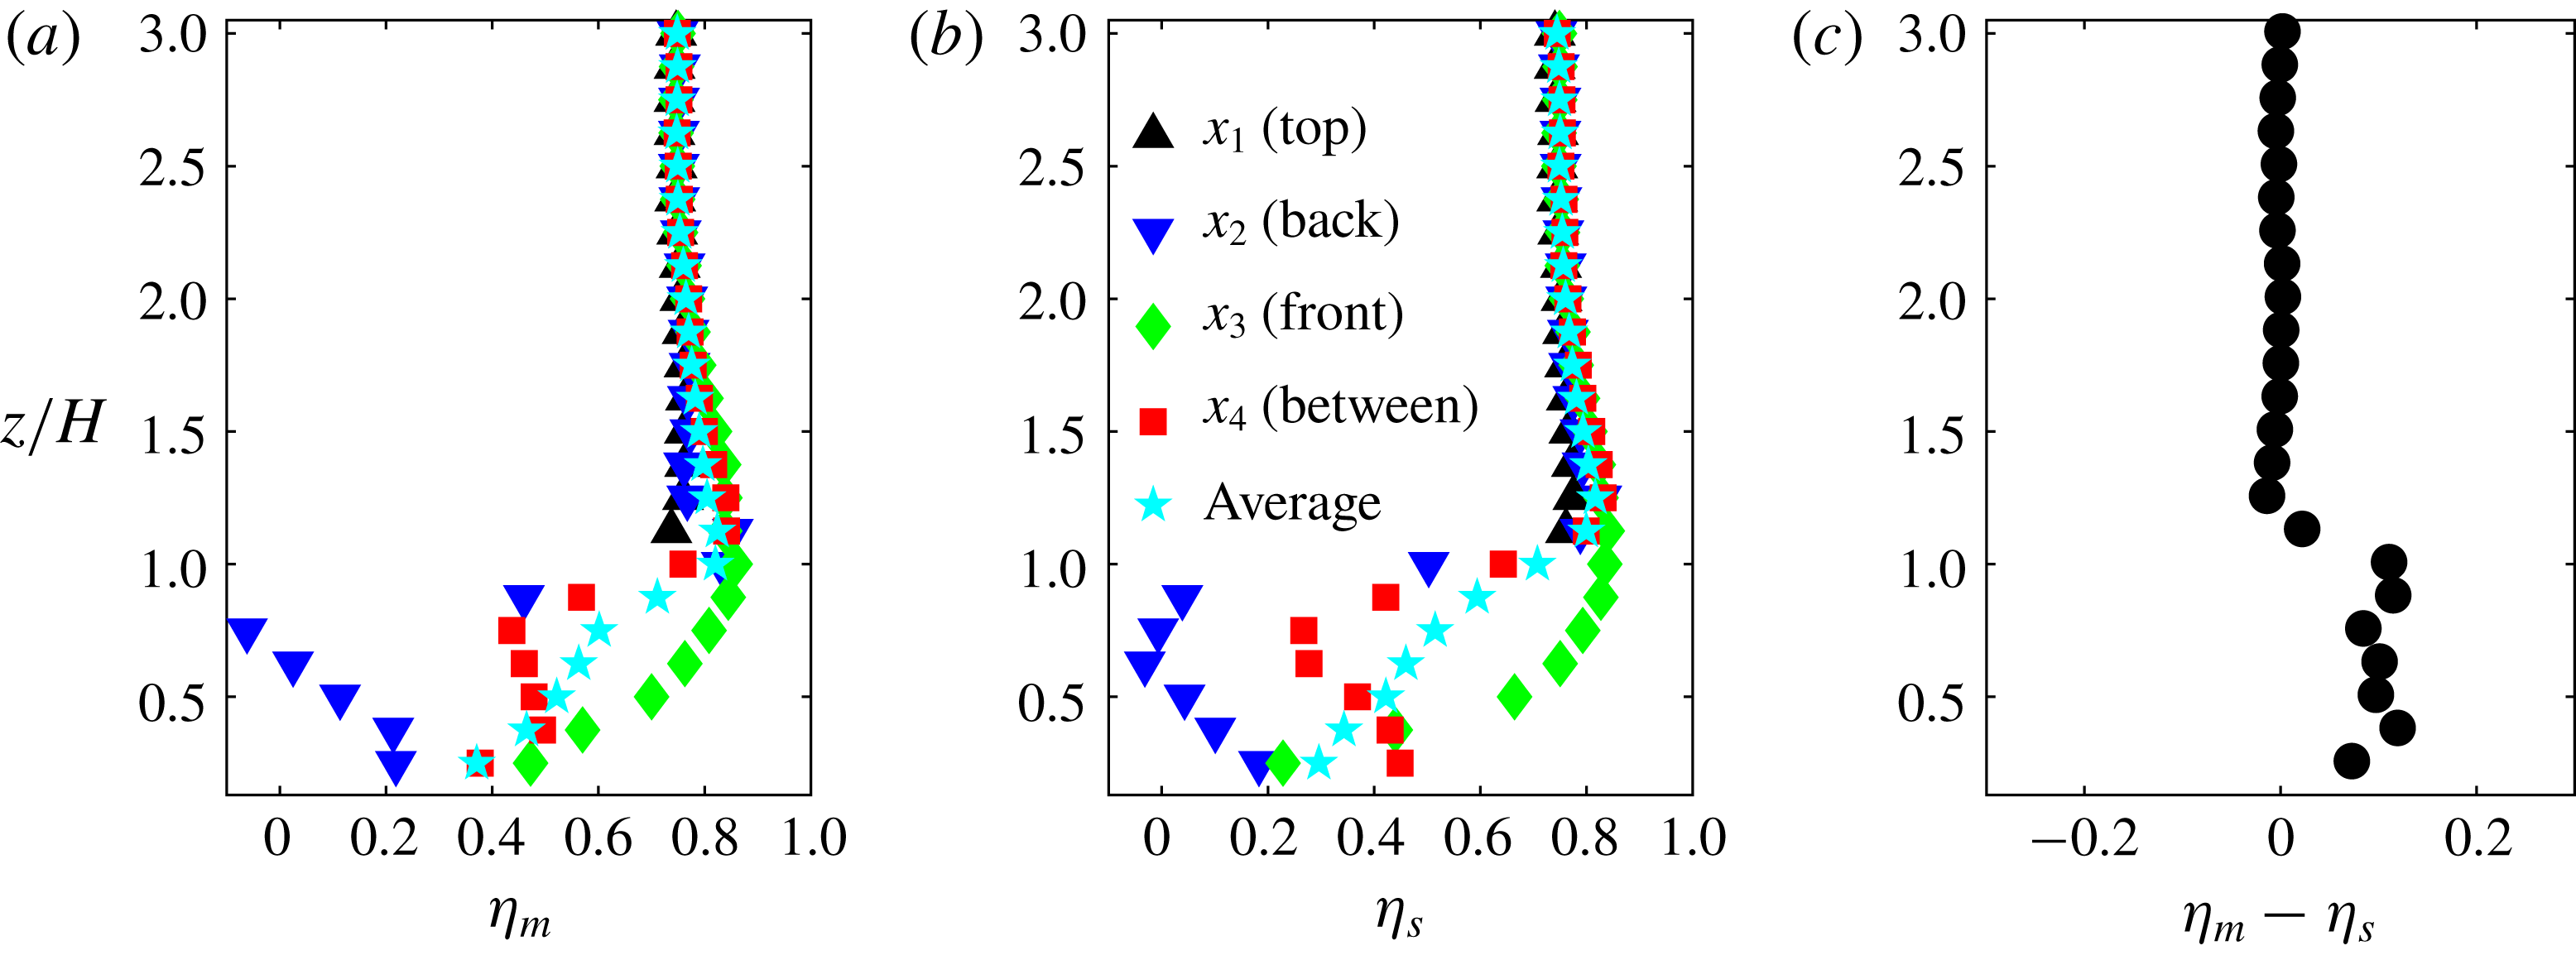
Reference Christen, van Gorsel and Vogt2007), except when buoyancy begins to play a significant role in turbulence generation (Li & Bou-Zeid Reference Li and Bou-Zeid2011). The generalizability of the similarity between turbulent transport of momentum and scalar observed above for case Cube25 to other cases is assessed through quadrant-analysis-based turbulent transport efficiencies, defined as
 $\unicode[STIX]{x1D702}=F_{total}/(F_{ejection}+F_{sweep})$
(Wyngaard & Moeng Reference Wyngaard and Moeng1992; Li & Bou-Zeid Reference Li and Bou-Zeid2011), where
 $F$
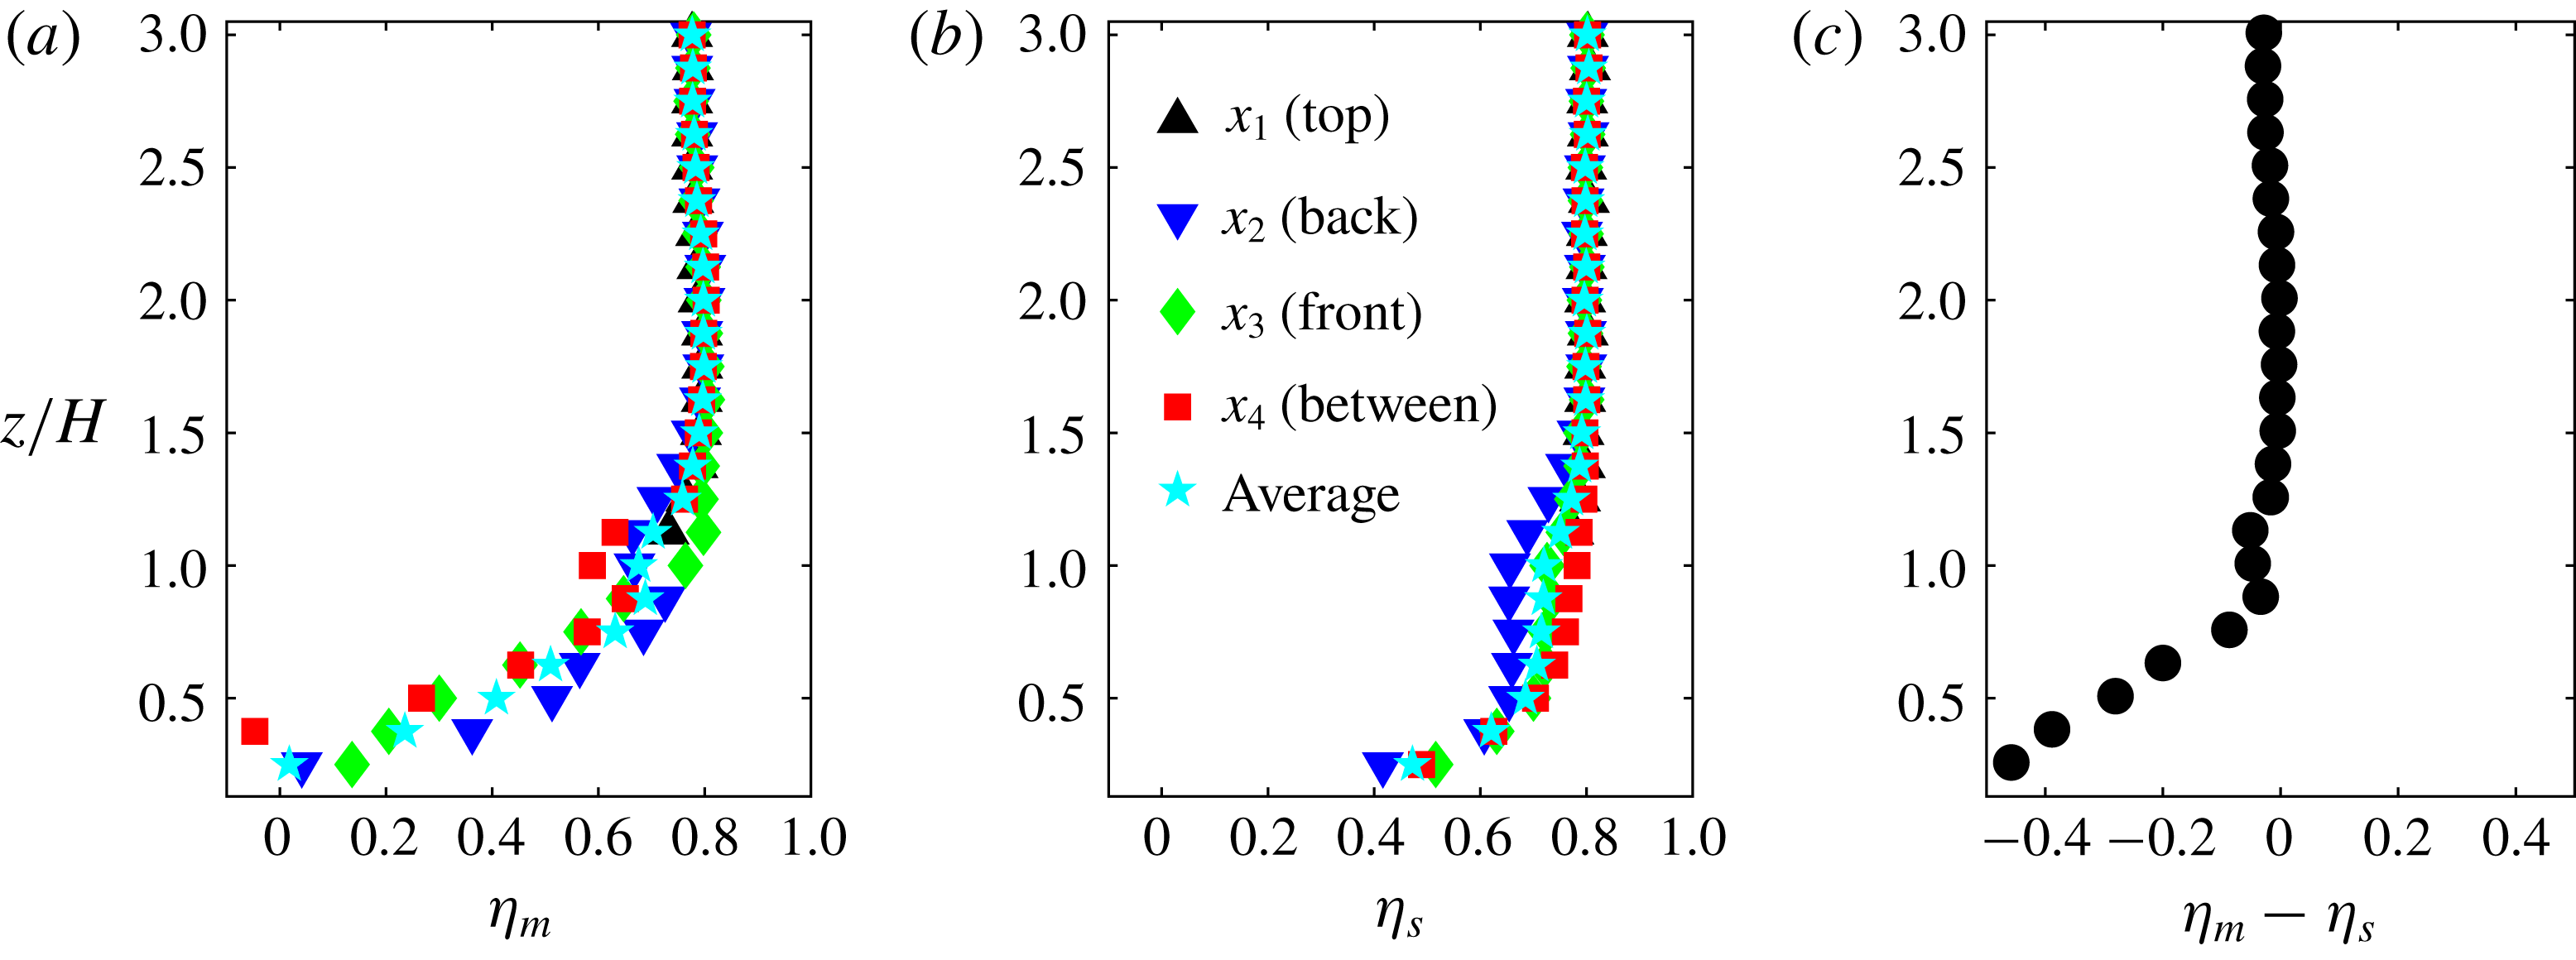
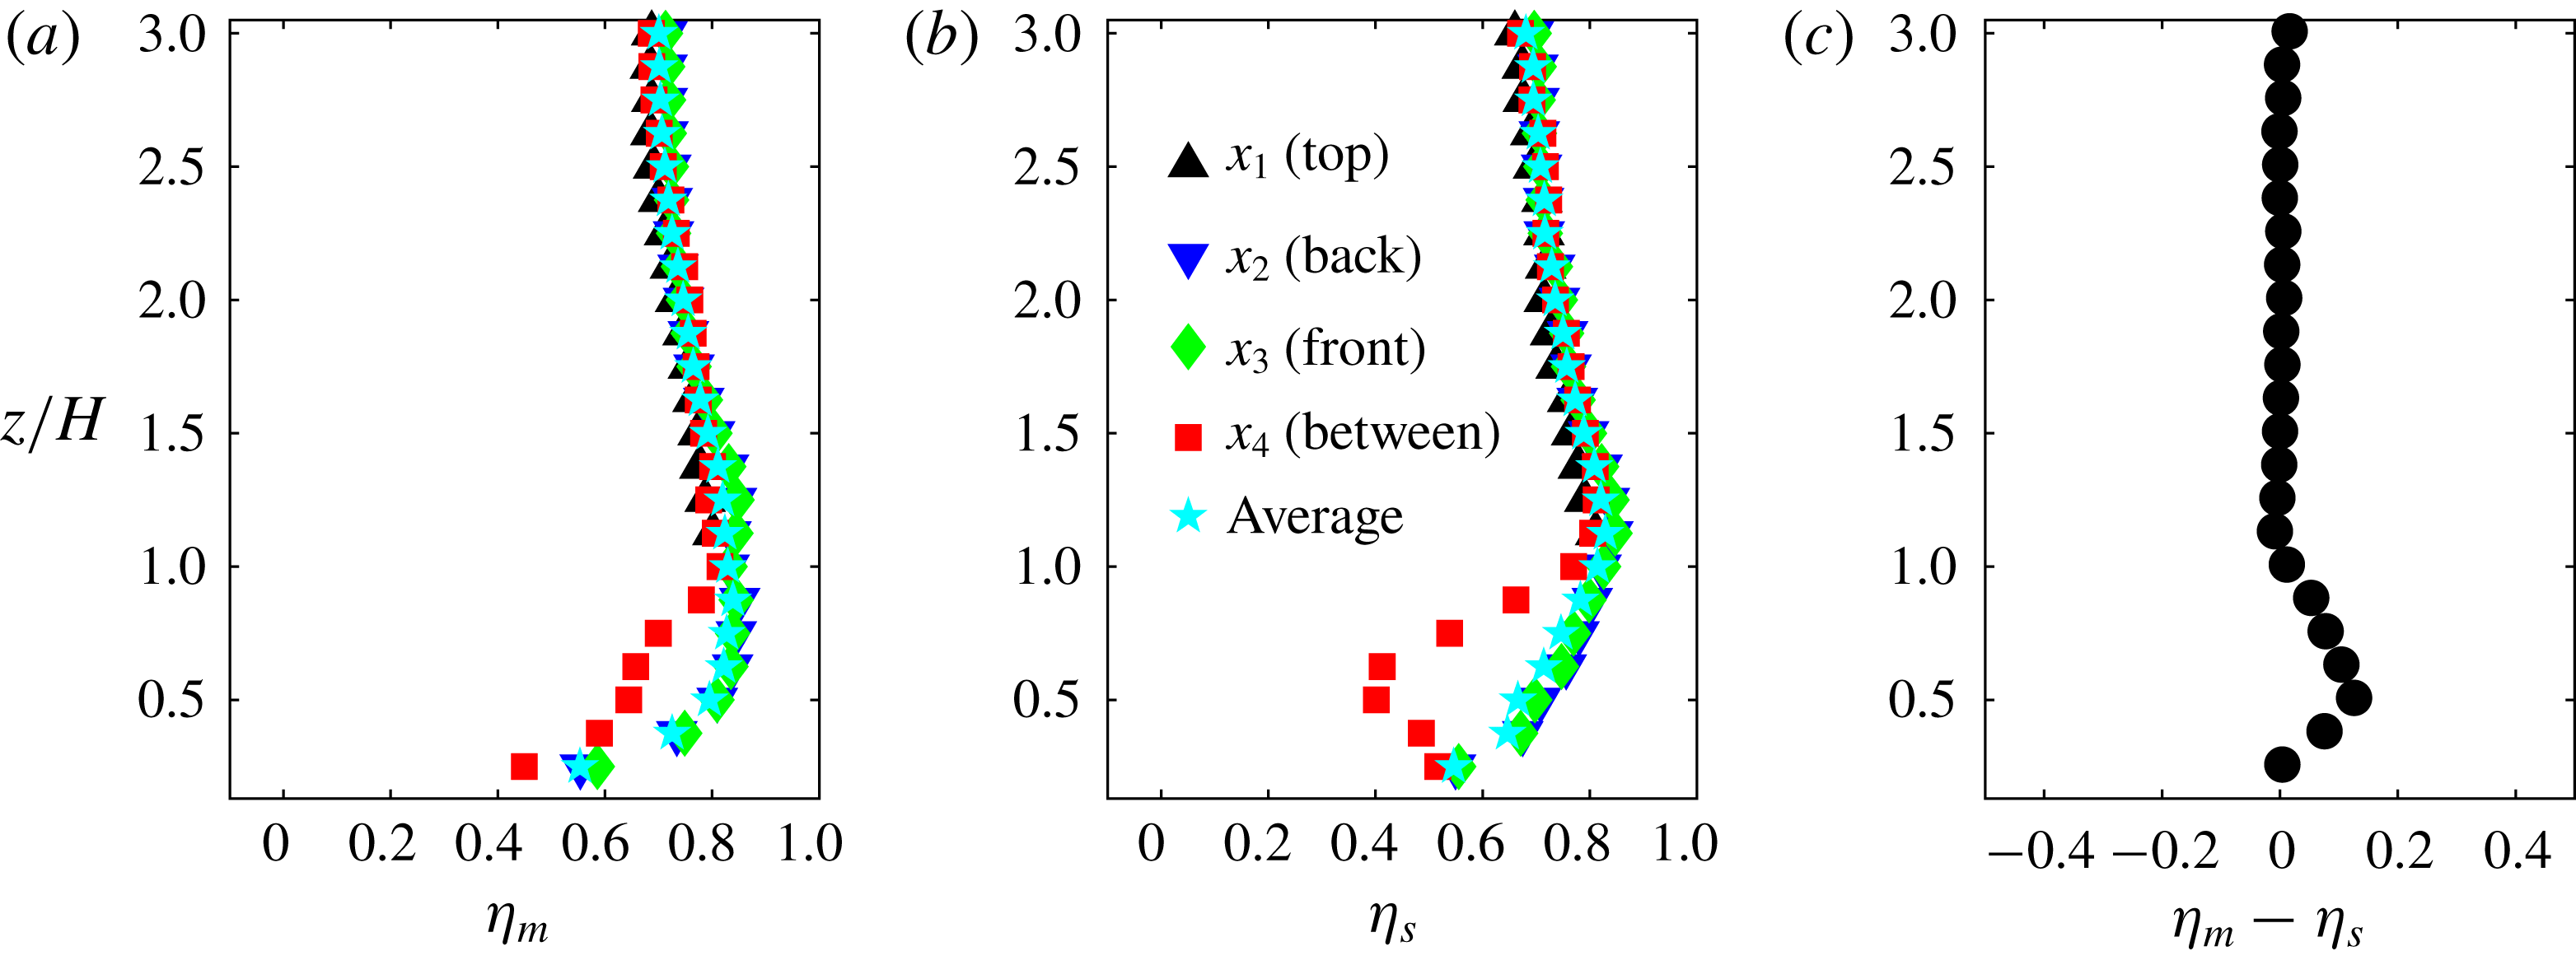
is the (total or from a single quadrant) flux of momentum or scalars. The results for cases Cube25, Slender06 and Wide32 are shown in figures 7–9. Figures 7–9(a,b) show the vertical profiles of efficiencies at each of the four horizontal locations
 $x_{1}$
to
 $x_{4}$
, as well as an average over these points, while figures 7–9(c) show the difference between
 $\unicode[STIX]{x1D702}_{m}$
and
 $\unicode[STIX]{x1D702}_{s}$
, averaged over the four points.
Above
 $z/H=1.25$
,
 $\unicode[STIX]{x1D702}_{m}-\unicode[STIX]{x1D702}_{s}$
approaches 0 and spatial variability is blended out at all points and across all cases shown in figures 7–9. Below that blending height, case Cube25 (figure 7) shows the most significant spatial variation of efficiencies across the four points;
 $\unicode[STIX]{x1D702}_{m}$
and
 $\unicode[STIX]{x1D702}_{s}$
for Slender06 (figure 8) vary much less while for Wide32 the efficiencies deviate appreciably only at
 $x_{4}$
. We need to note however that these locations and their relative distance are not all equivalent since their locations relative to the cuboids are not identical in all cases.
Turbulent transport efficiencies at
 $x_{1}$
–
 $x_{4}$
for the case of staggered cubes. (a) Momentum transport efficiency
 $\unicode[STIX]{x1D702}_{m}$
; (b) scalar transport efficiency
 $\unicode[STIX]{x1D702}_{s}$
; (c)
 $\unicode[STIX]{x1D702}_{m}-\unicode[STIX]{x1D702}_{s}$
averaged over points
 $x_{1}$
–
 $x_{4}$
.

Same as figure 7, but for case Slender06.

Same as figure 7, but for case Wide32.

Although there are some discrepancies between
 $\unicode[STIX]{x1D702}_{s}$
and
 $\unicode[STIX]{x1D702}_{m}$
at some locations, such as at
 $x_{2}$
and
 $x_{4}$
within the canopy sublayer of Cube25 and Wide32, the general trends for momentum and scalar efficiency remain similar for those cases. On the other hand, Slender06 displays more dissimilarity between momentum and scalar transport in the canopy sublayer as shown by the
 $\unicode[STIX]{x1D702}$
values (figure 8), with a higher transport efficiency for the scalar. While sweeps dominate the transport of the scalar in Slender06 (figure 18), both sweeps and ejections contribute approximately equally to the total momentum flux (figure 17), especially at points
 $x_{3}$
and
 $x_{4}$
. A physical explanation for this dissimilarity is that the penetration of high horizontal momentum sweeps downward is hindered by the blockage effect of the slender-shaped roughness element, which induces negative fluctuations in
 $u^{\prime }$
and thus increases inward interactions and reduces
 $\unicode[STIX]{x1D702}_{m}$
. Nevertheless, sweeps that are associated with cold (low
 $\unicode[STIX]{x1D703}^{\prime }$
) fluid, but not with a large positive
 $u^{\prime }$
, can still efficiently penetrate the canopy and transport the passive scalar. Overall, turbulent momentum and scalar transport are broadly similar for Cube 25 and Wide 32, but not for Slender06 that has a higher
 $\unicode[STIX]{x1D702}_{s}$
than
 $\unicode[STIX]{x1D702}_{m}$
.
It would be instructive to analyse further why the slender blocks induce more dissimilarity than the wider ones, but this is not a core goal of this paper and will not be pursued here. What we can conclude is that, as the general characteristics of turbulent flows transitions from wall-bounded-like to a mixing-layer-like regime,
 $u^{\prime }$
and
 $\unicode[STIX]{x1D703}^{\prime }$
exhibit more similar correlations with
 $w^{\prime }$
. For these mixing-layer-like flows, turbulent momentum and scalar transports are broadly similar but with a slightly more efficient momentum transport (
 $\unicode[STIX]{x1D702}_{m}>\unicode[STIX]{x1D702}_{s}$
). However, this similarity is reduced for wall-bounded-like flows and the more efficient exchange is now for scalars (
 $\unicode[STIX]{x1D702}_{m}<\unicode[STIX]{x1D702}_{s}$
) when measured using quadrant analysis (note that for the efficiency defined based on the correlation coefficient in figure 2, momentum transfer remained slightly more efficient than scalar transfer for the slender geometry). For all geometries, the results suggest a turbulent Schmidt or Prandtl number
 $\neq 1$
(results not shown here).
3.1.3 Velocity and passive scalar structures
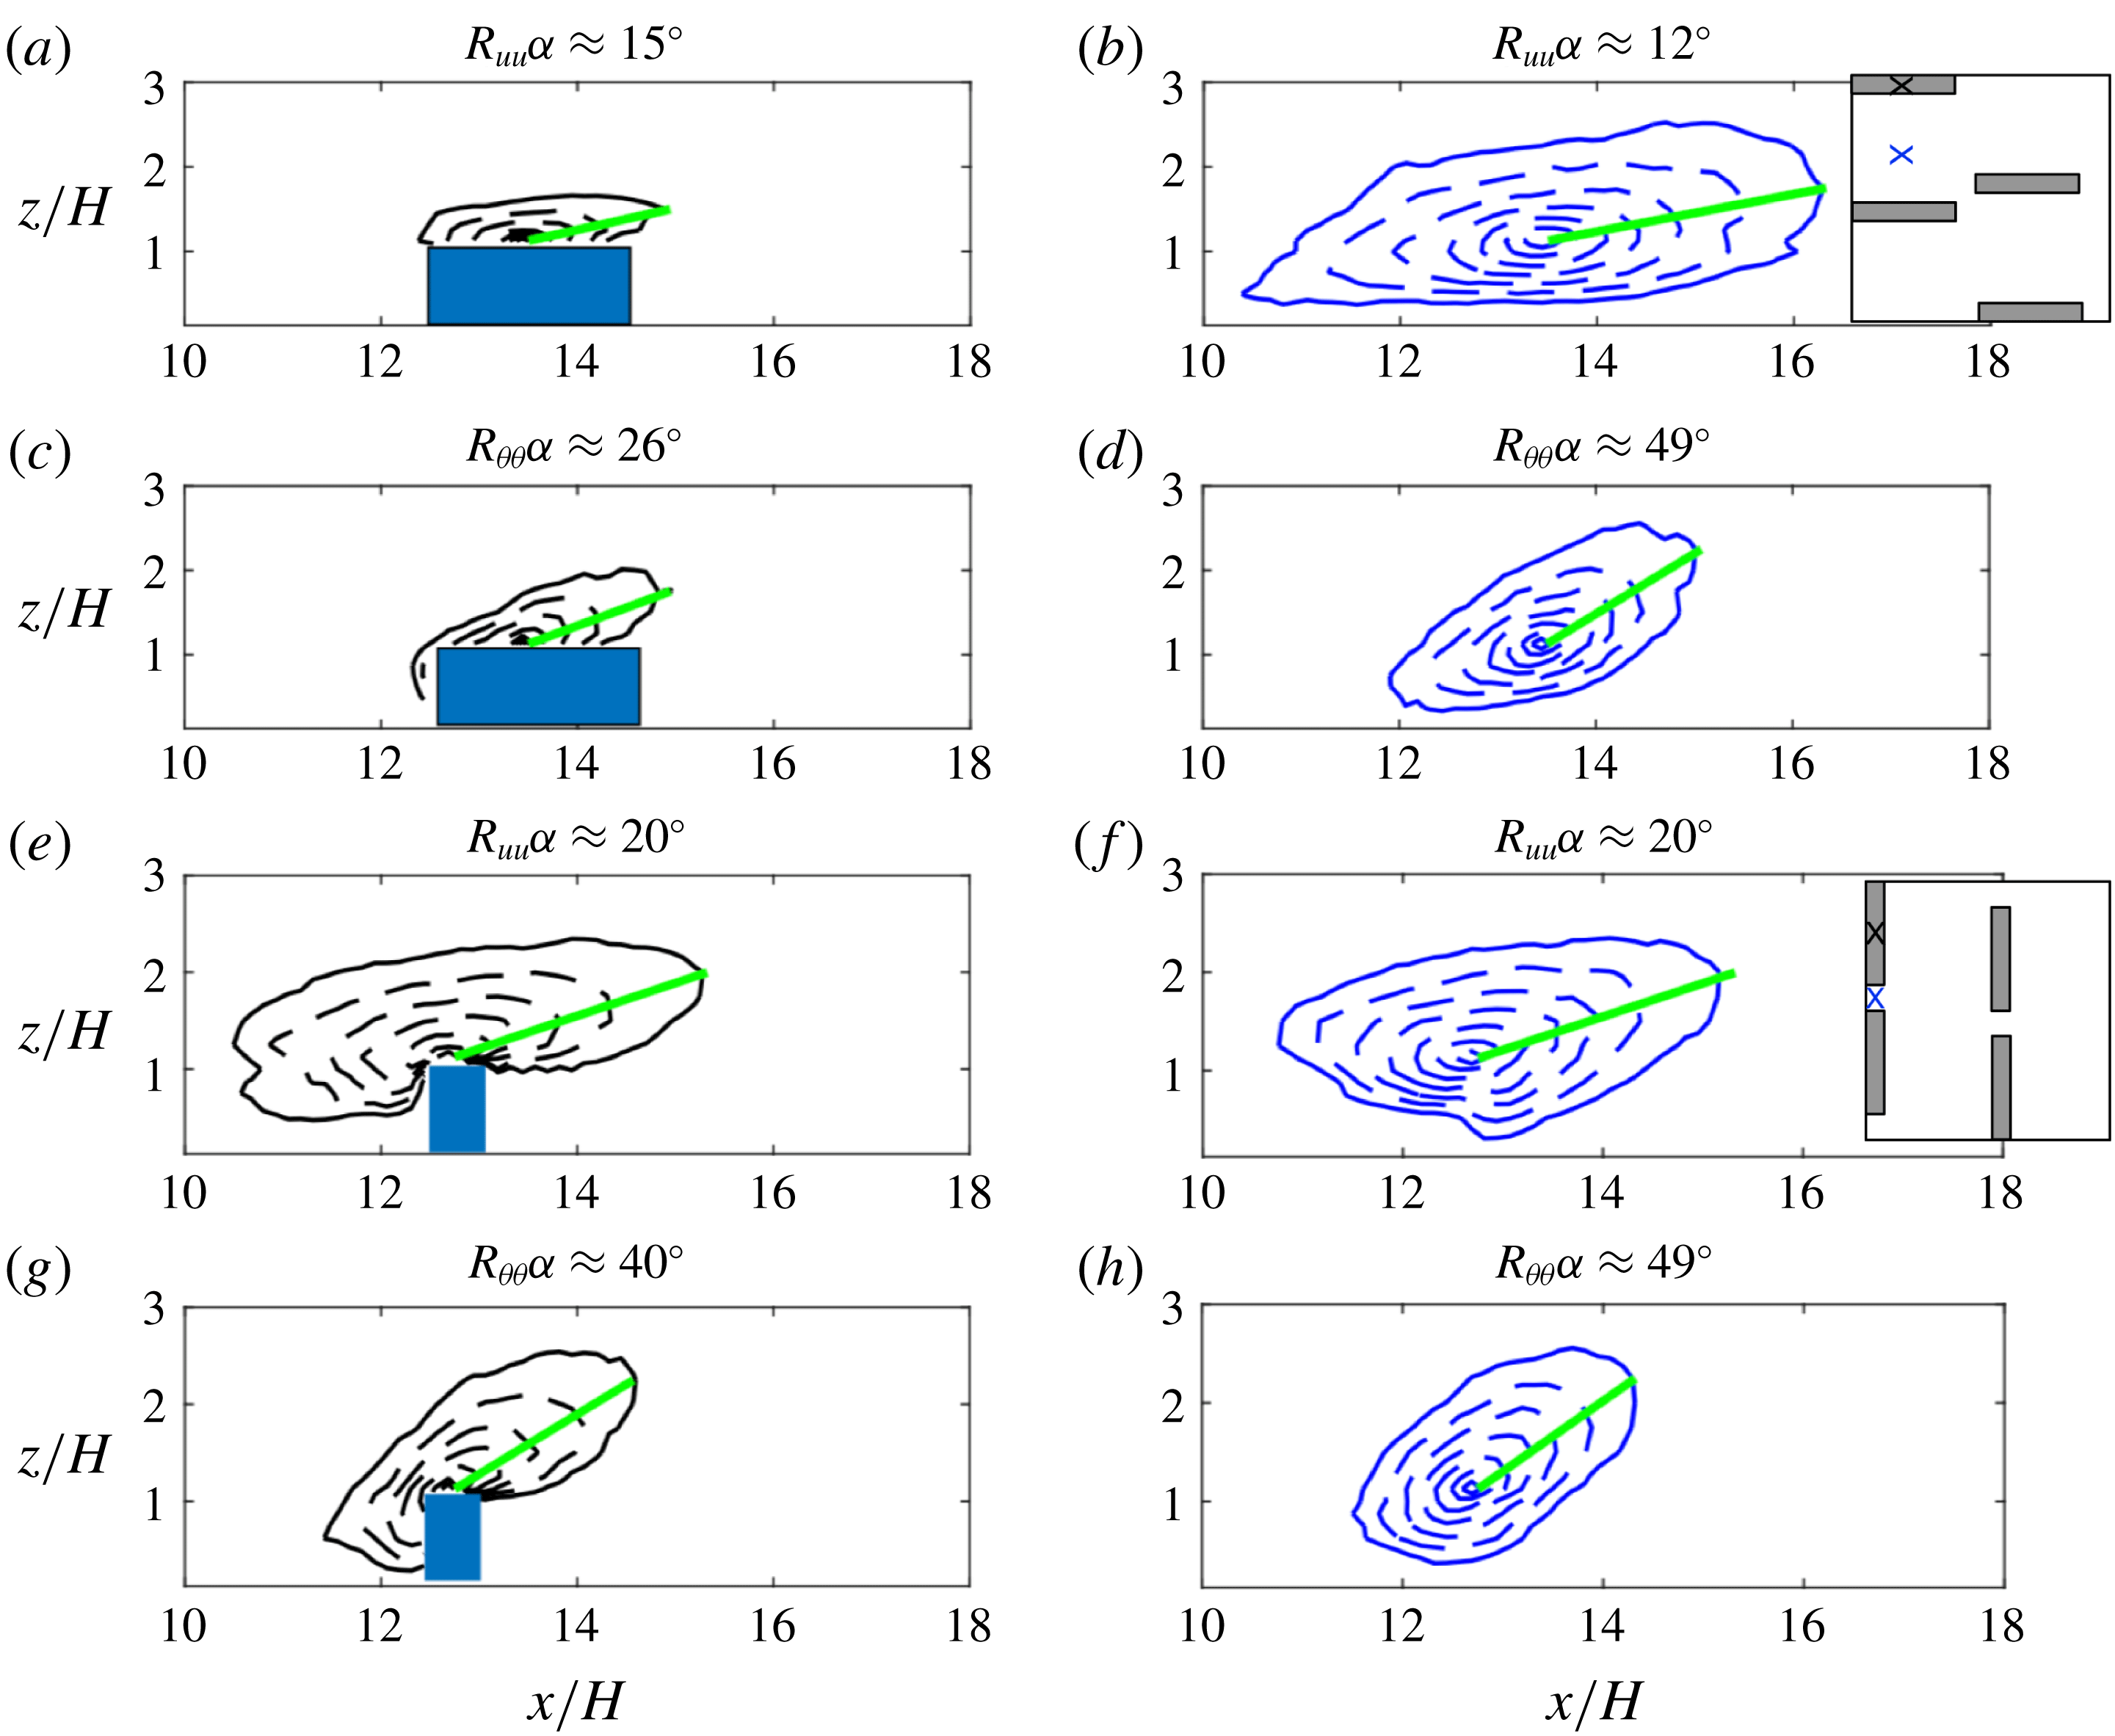
Two-point streamwise correlation for
 $u$
and
 $\unicode[STIX]{x1D703}$
for case Slender06: (a–d) and case Wide32: (e–h). The black (blue) crosses in the inset figures (in b,f) indicate the reference points
 $X_{0}$
in figures a,c,e,g (b,d,f,h). The black (blue) crosses are positioned at the middle of the top of the cuboids and between the cuboids respectively. The correlation contours are spaced uniformly with a step 0.1 from 1 (innermost) to 0.3 (outermost). The solid green line segments are drawn between
 $X_{0}$
and
 $X_{1}$
, where
 $X_{1}$
is on the furthest point on the correlation contour of 0.3. The angle
 $\unicode[STIX]{x1D6FC}$
is between the streamwise direction and the line segment
 $X_{0}X_{1}$
.

To understand how turbulent momentum and scalar transport behave as the flow regime transition illustrated in the previous sub-section occurs, we analyse the spatial correlations of turbulent quantities. The two-point streamwise correlation for a quantity
 $s$
at reference point
 $x$
and for a separation distance
 $X_{0}$
can be computed as
 $\overline{\unicode[STIX]{x1D70C}_{ss}}(X_{0},x)=\overline{s^{\prime }(X_{0})s^{\prime }(x)}/(s_{rms}(X_{0})s_{rms}(x))$
, where r.m.s. denotes the root mean square of the turbulent fluctuations. These correlations are shown in figure 10 for cases Slender06 and Wide32. The angle of inclination of the contours was calculated following the approach of Leonardi et al. (Reference Leonardi, Orlandi, Djenidi and Antonia2015), where
 $\unicode[STIX]{x1D6FC}$
is estimated as the angle between the horizontal direction and the segment
 $X_{0}X_{1}$
, indicated by the green solid line, the point
 $X_{1}$
being the furthest from
 $X_{0}$
on the contour
 $R_{uu}=0.3$
. The increased interactions between the roughness elements and the flow in the roughness sublayer are indicated by larger
 $\unicode[STIX]{x1D6FC}$
, especially
 $R_{uu}(x_{2})$
in figure 10(f) relative to figure 10(b). Compared to the two-dimensional bars studied in Leonardi et al. (Reference Leonardi, Orlandi, Djenidi and Antonia2015), the three-dimensional roughness geometry and different configurations also introduce spanwise variation in the correlation contours. The mixing-layer-like flow regime results in increased interactions between the surface and the roughness sublayer for both
 $u^{\prime }$
and
 $\unicode[STIX]{x1D703}^{\prime }$
. However, the increase is more pronounced for the velocity and the correlation contours
 $R_{\unicode[STIX]{x1D703}\unicode[STIX]{x1D703}}$
are less sensitive to the increase of
 $\unicode[STIX]{x1D706}_{f}$
than their velocity counterparts.
Nevertheless, the angles for
 $\unicode[STIX]{x1D703}^{\prime }$
are always larger than for
 $u^{\prime }$
. Even for a surface-layer-like flow regime of the slender geometry, where the coupling between canopy sublayer top and the roughness sublayer aloft is not as strong as that for the mixing-layer-like case, the effect of the roughness geometry on a passive scalar can extend further up. This result is also consistent with the lower frequency (larger scale) of the motions contributing to
 $R_{\unicode[STIX]{x1D703}w}$
than to
 $R_{uw}$
in figure 4, as well as with the wider range of scales that can effectively transfer scalars as deduced from the spectral analysis. It should be noted here that this analysis is restricted to a plane that crosses the buildings, and indicates longer coherence for the wide, more obstructive geometry. Most of the coherent structures for the slender geometry are in between the buildings as illustrated in figure 5 and would not be captured in this correlation coefficient analysis.
3.2 Dispersive transport
An important aspect that sets very rough walls apart is that dispersive stresses or fluxes, which arise from the spatial inhomogeneity of the time-averaged flow field, can be important contributors to total transport (Wilson & Shaw Reference Wilson and Shaw1977; Finnigan Reference Finnigan1985, Reference Finnigan2003). Any mean (time-averaged) quantity
 $\overline{\unicode[STIX]{x1D719}}$
can be decomposed into
 $\overline{\unicode[STIX]{x1D719}}=\langle \overline{\unicode[STIX]{x1D719}}\rangle +\overline{\unicode[STIX]{x1D719}}^{\prime \prime }$
, where the double prime represents the spatial deviation of the time-averaged variable from its time–space average. In the present paper, we consider
 $\langle \overline{\unicode[STIX]{x1D719}}\rangle$
representing the planar average of a time-averaged quantity over the volume of
 $\text{d}zL_{x}L_{y}$
(i.e. a planar average). The dispersive fluxes then arise from the spatial averaging of (2.2) and (2.3). As an example, the spatially local, time-averaged dispersive momentum stress is
 $\overline{u}_{i}^{\prime \prime }\overline{u}_{j}^{\prime \prime }(x,y,z)$
. Taking the volume averaging over
 $\text{d}zL_{x}L_{y}$
,
 $\langle \overline{u}_{i}^{\prime \prime }\overline{u}_{j}^{\prime \prime }\rangle (z)=\langle \overline{u}_{i}\overline{u}_{j}\rangle -\langle \overline{u}_{i}\rangle \langle \overline{u}_{j}\rangle$
. Physically, the dispersive stresses result from the transport by the mean (time-averaged) coherent flow structures, such as the persistent circulations that will form between buildings.
3.2.1 Dissimilarity between dispersive momentum and heat transport
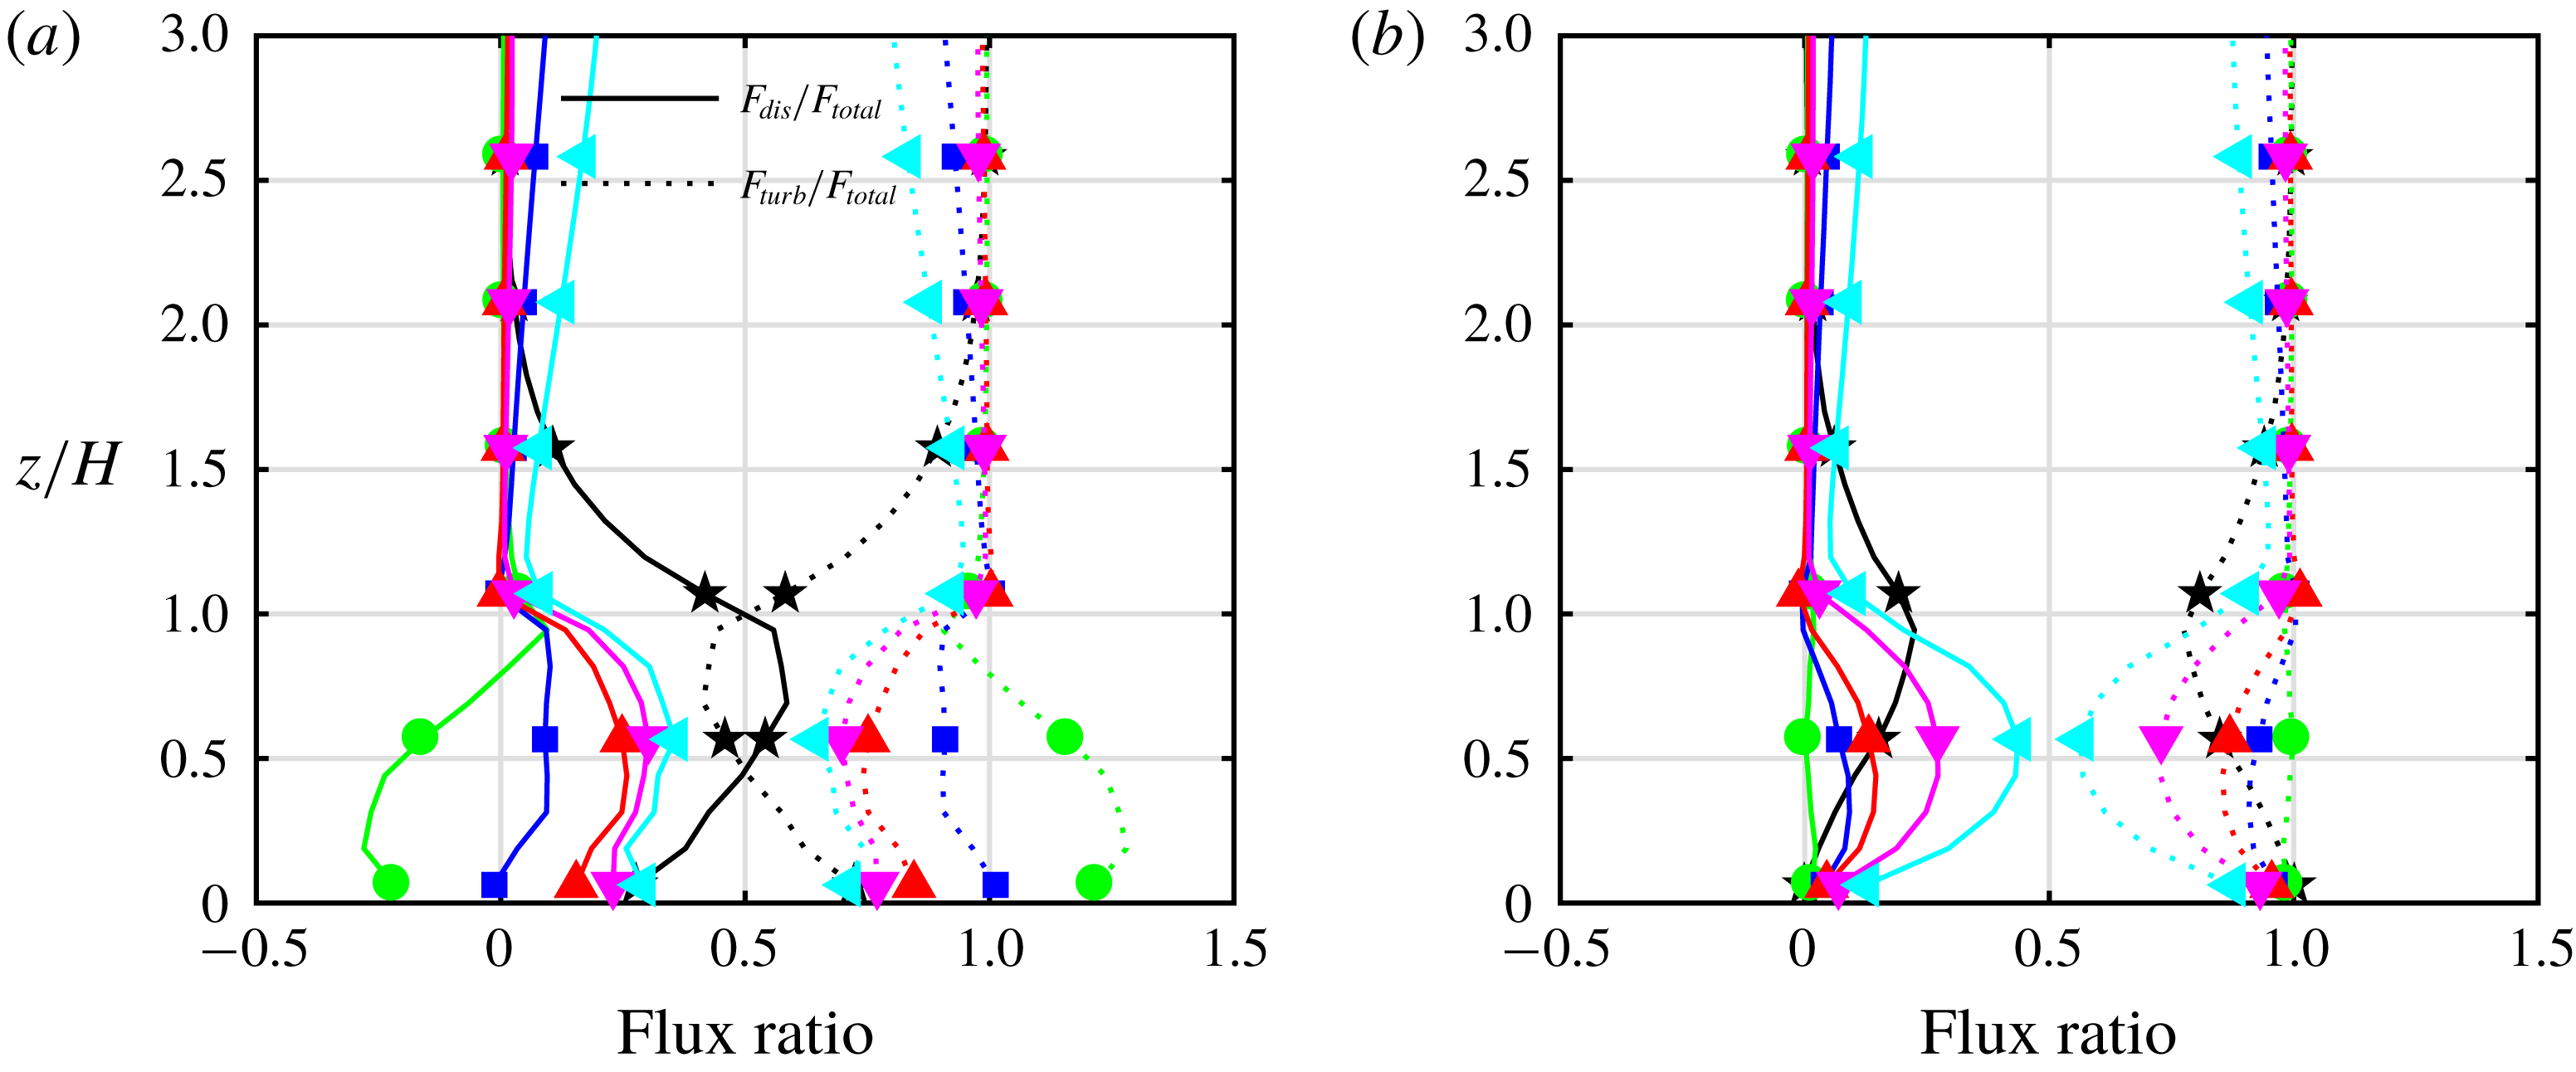
Figure 11 shows the ratios
 $F_{dis}/F_{total}=\langle \overline{u}^{\prime \prime }\overline{w}^{\prime \prime }\rangle /(\langle \overline{u}^{\prime \prime }\overline{w}^{\prime \prime }\rangle +\langle \overline{u^{\prime }w^{\prime }}\rangle )$
and
 $F_{turb}/F_{total}=\langle \overline{u^{\prime }w^{\prime }}\rangle /(\langle \overline{u}^{\prime \prime }\overline{w}^{\prime \prime }\rangle +\langle \overline{u^{\prime }w^{\prime }}\rangle )$
in (a) and their counterparts
 $\langle \overline{w}^{\prime \prime }\overline{\unicode[STIX]{x1D703}}^{\prime \prime }\rangle /(\langle \overline{w}^{\prime \prime }\overline{\unicode[STIX]{x1D703}}^{\prime \prime }\rangle +\langle \overline{w^{\prime }\unicode[STIX]{x1D703}^{\prime }}\rangle )$
and
 $\langle \overline{w^{\prime }\unicode[STIX]{x1D703}^{\prime }}\rangle /(\langle \overline{w}^{\prime \prime }\overline{\unicode[STIX]{x1D703}}^{\prime \prime }\rangle +\langle \overline{w^{\prime }\unicode[STIX]{x1D703}^{\prime }}\rangle )$
in (b) for all the cases with
 $\unicode[STIX]{x1D706}_{p}=0.12$
and for increasing
 $\unicode[STIX]{x1D706}_{f}$
(Slender06 to Wide32). Examples of previous studies on the momentum dispersive fluxes (Christen & Vogt Reference Christen and Vogt2004; Poggi et al.
Reference Poggi, Katul and Albertson2004; Martilli & Santiago Reference Martilli and Santiago2007; Coceal, Thomas & Belcher Reference Coceal, Thomas and Belcher2007b
; Poggi & Katul Reference Poggi and Katul2008; Leonardi et al.
Reference Leonardi, Orlandi, Djenidi and Antonia2015; Giometto et al.
Reference Giometto, Christen, Meneveau, Fang, Krafczyk and Parlange2016) and a few on dispersive scalar fluxes (Christen & Vogt Reference Christen and Vogt2004; Leonardi et al.
Reference Leonardi, Orlandi, Djenidi and Antonia2015) have demonstrated their importance within the canopy sublayer, as well as in the roughness sublayer. Similar to previous findings, our simulations also indicate that the dispersive fluxes are significant within the roughness arrays. The dispersive flux can contribute
 ${\approx}50\,\%$
of the total momentum or scalar flux (where the contribution of the subgrid-scale fluxes is included in the total) below the roughness elements height for some cases. It is noteworthy that there are no monotonic trends of how the dispersive fluxes vary with
 $\unicode[STIX]{x1D706}_{f}$
, reflecting the complexity of how the mean circulations change with changing geometry. The fractions of dispersive fluxes, in general, are the highest for the most eccentric geometries Slender06 and Wide32. Our results show that for
 $z/H=2{-}3$
dispersive fluxes for most cases are close to zero, broadly in agreement with Coceal et al. (Reference Coceal, Dobre, Thomas and Belcher2007a
) and Leonardi et al. (Reference Leonardi, Orlandi, Djenidi and Antonia2015). We performed our analysis for the time-averaged quantities over time spans of approximately
 $H/U_{b}=1200$
(
 $U_{b}$
is the bulk velocity) and longer than the
 $H/U_{b}=600$
suggested in Leonardi et al. (Reference Leonardi, Orlandi, Djenidi and Antonia2015), who found that such an averaging time is required for secondary non-persistent circulations in the roughness sublayer to meander and be transported away.
Contribution of
 $x$
–
 $y$
-averaged dispersive or turbulent (resolved
 $+$
subgrid-scale) fluxes to the total for (a) momentum and (b) scalar.
 $\star$
, Slender06; ○, Sf08; ▫, Sf12; ▵, Sf16; ▿, Sf24; ◃, Wide32.

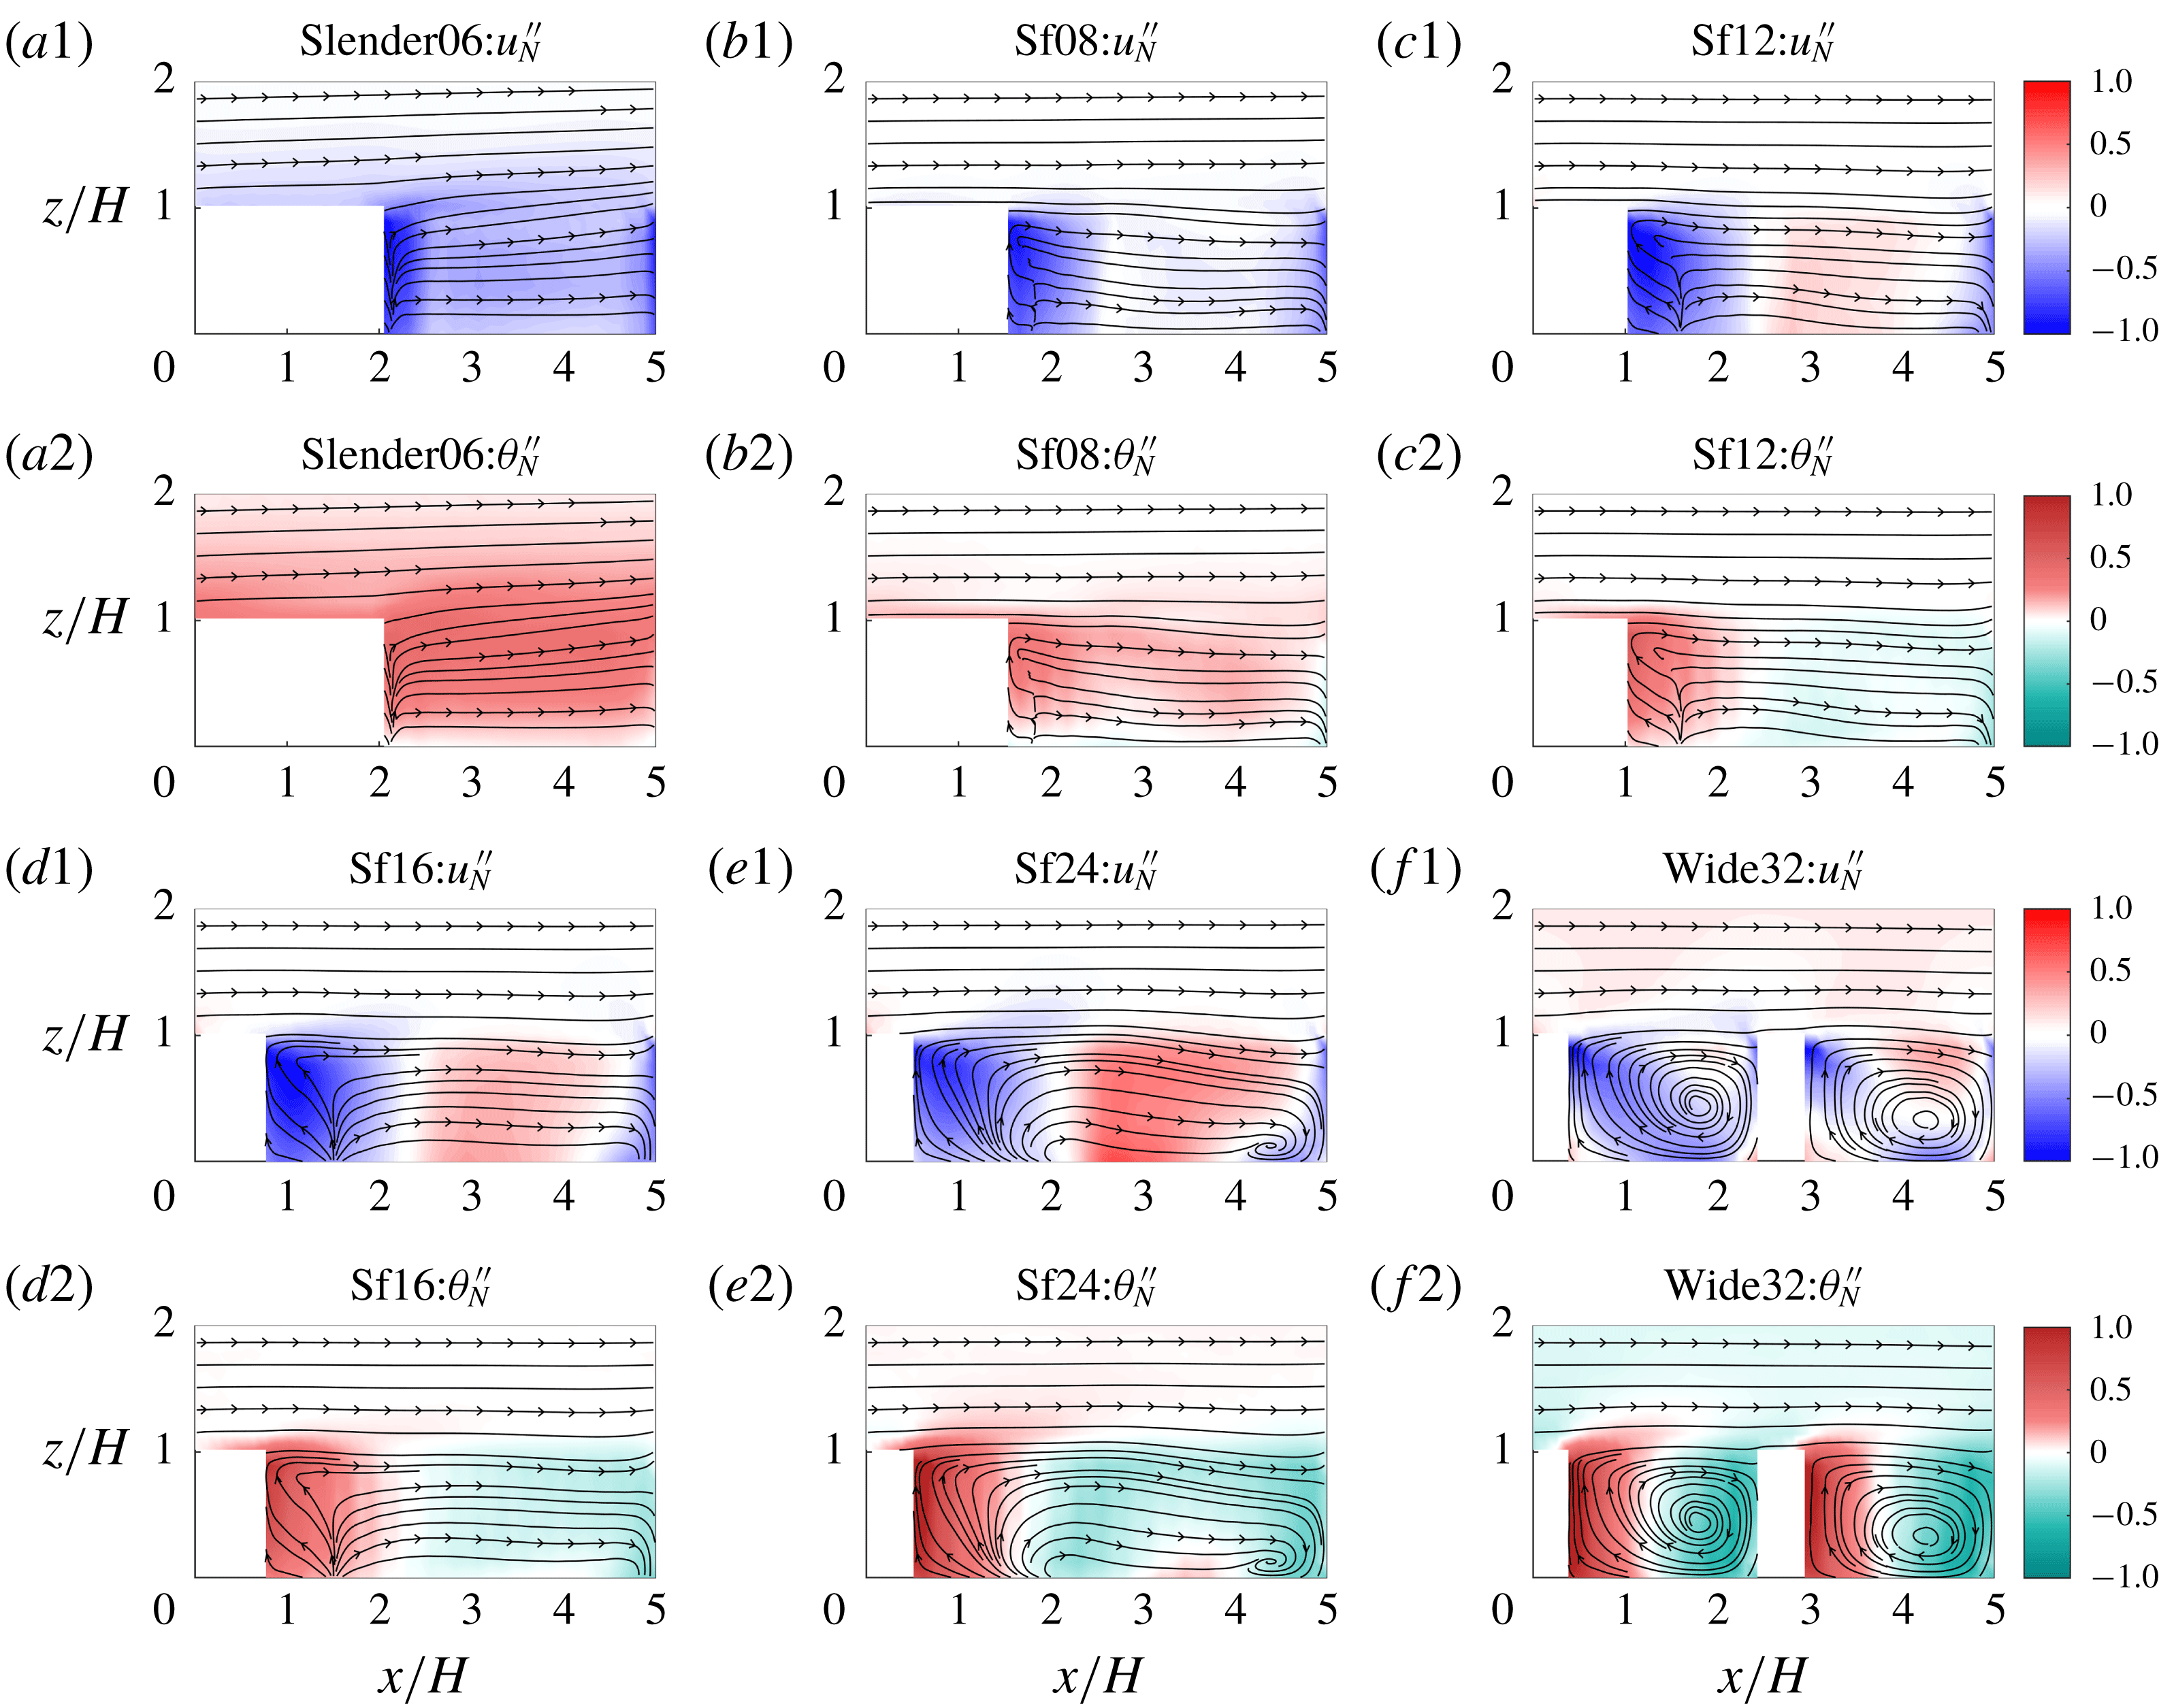
Both dispersive stress and scalar flux are important portions of the total fluxes especially within the canopy sublayer, and their dissimilarities are now studied in detail. Figure 12 shows
 $\overline{u}_{N}^{\prime \prime }=\overline{u}^{\prime \prime }/\langle u(z=H)\rangle$
and
 $\overline{\unicode[STIX]{x1D703}}_{N}^{\prime \prime }=\unicode[STIX]{x1D703}^{\prime \prime }/\unicode[STIX]{x0394}\unicode[STIX]{x1D703}$
, where
 $\unicode[STIX]{x0394}\unicode[STIX]{x1D703}=\langle \unicode[STIX]{x1D703}(z=H)-\unicode[STIX]{x1D703}(z=0.125H)\rangle$
for an
 $x$
–
 $z$
cross-section indicated by the blue line in figure 1. The pseudocolour plots and streamlines are phase averaged for all repeating units in the domain. Negative
 $\overline{u}_{N}^{\prime \prime }$
is due to loss of horizontal momentum
 $u$
in the wakes produced by the obstacle, as well as due to upstream blockage as the flow approaches a block. Positive
 $\overline{\unicode[STIX]{x1D703}}_{N}^{\prime \prime }$
, on the other hand, are prominent only in the lee of obstacles and result from all three canyon surfaces (ground and walls) being kept at a higher temperature. As
 $\unicode[STIX]{x1D706}_{f}$
increases, in figures 12(b1) to (f1) and 12(b2) to (f2) the most pronounced momentum–scalar distinction can be found upstream of the obstacle where the mean recirculation pattern results in ‘counter-gradient’ dispersive momentum transport (fluid slowed by the pressure field generated by the obstacle being advected downwards) but ‘down-gradient’ scalar transport (cooler or lower concentration fluid transported downwards). This difference emerges from the non-local action of pressure on momentum (the fluid’s streamwise velocity has to decrease as it approaches the windward face even before it contacts that face), but its absence from the dynamics of scalars (the fluid has to ‘touch’ the surface to uptake scalars). The sign of the dispersive scalar fluxes in that region is thus the same as the total flux, while there is partial cancellation of dispersive stresses for momentum. As
 $\unicode[STIX]{x1D706}_{f}$
increases, the region that contributes to ‘down-gradient’ dispersive flux enlarges, especially from Slender06 to Sf24. Case Slender06 generates a mean flow that is fundamentally different from the other geometries since flow separation and the emergence of a (resolved) recirculation zone behind the obstacle only starts with case Sf08. In addition, upstream of the obstacle, a downward flow appears in case Sf08, resulting in downward transport of colder air (green region near
 $x/H=5$
). However, such downward flow upstream of the building is absent in Slender06.
Normalized dispersive stress and flux for all cases: colour scale indicates
 $\overline{s}_{N}^{\prime \prime }=\overline{s}^{\prime \prime }/\unicode[STIX]{x0394}s$
for
 $s=u$
or
 $\unicode[STIX]{x1D703}$
. Lines with arrows are the
 $\overline{u}$
–
 $\overline{w}$
streamlines.

Due to the asymmetry of the obstacles in the
 $x$
and
 $y$
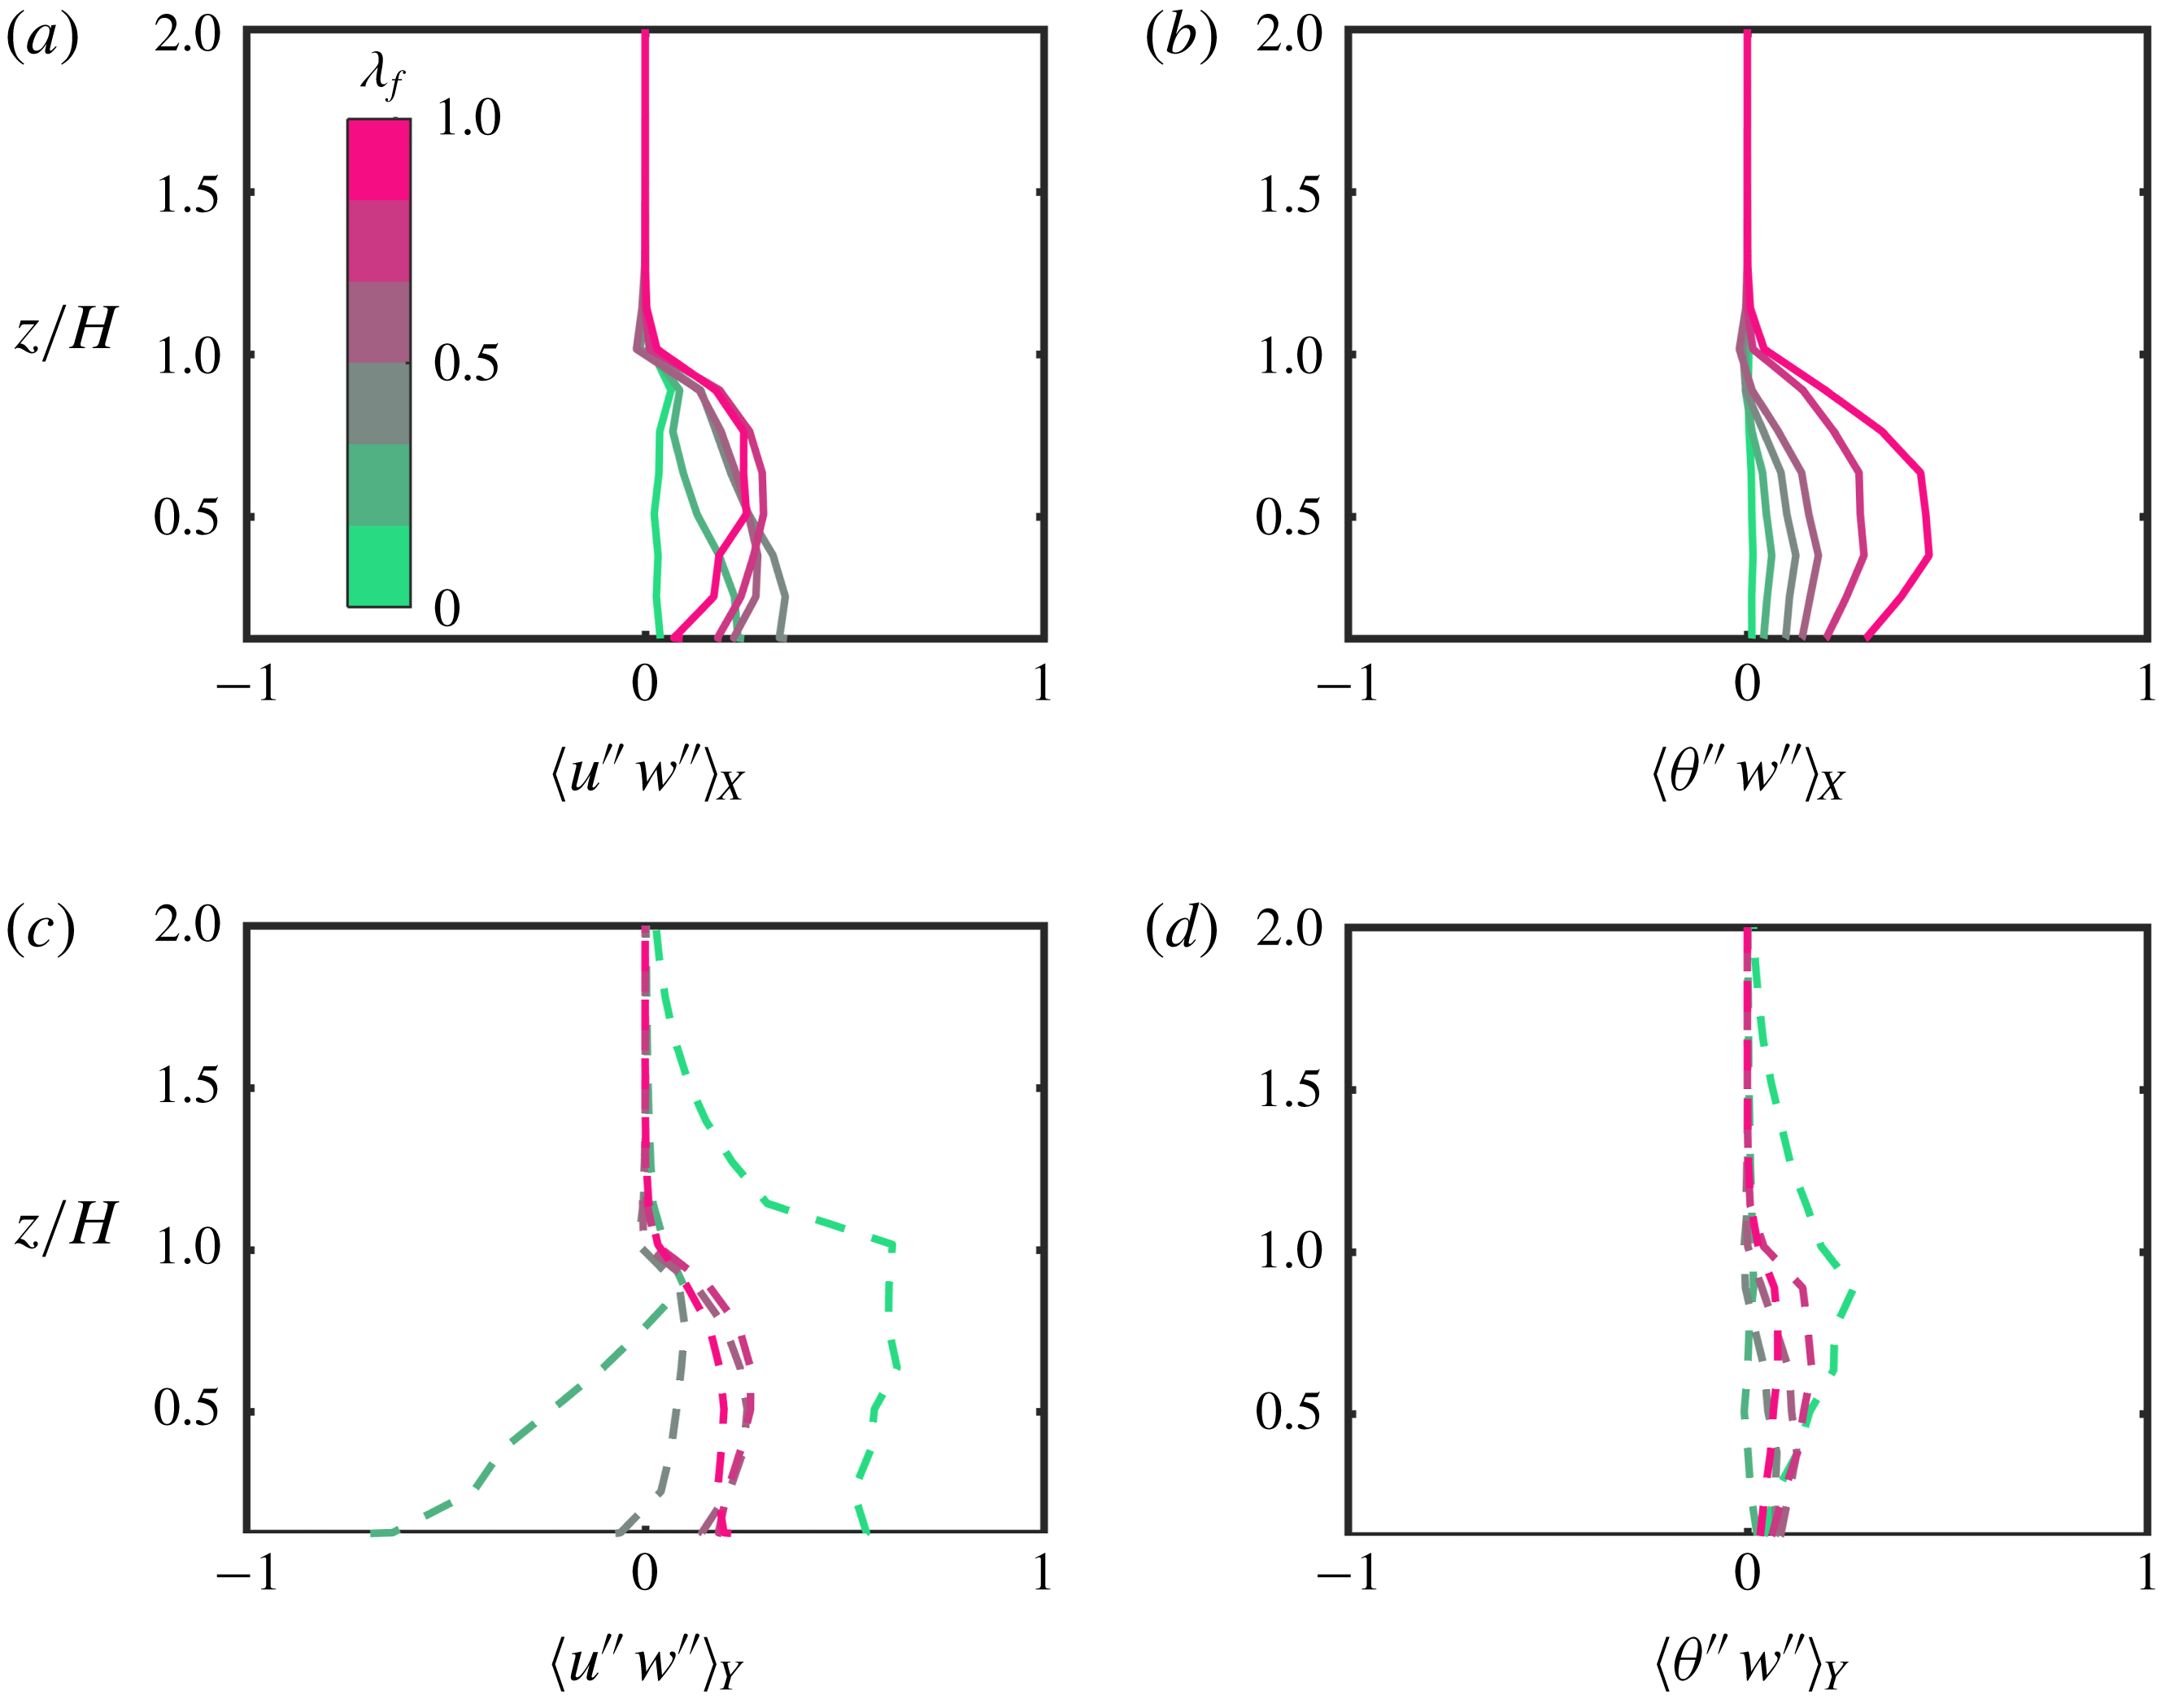
directions, isolating the spatially coherent characteristics of the dispersive fluxes in each direction can inform us of the direction-specific variabilities of the temporally averaged quantities. To probe this aspect, we first define the deviation of a temporally averaged quantity,
 $\overline{\unicode[STIX]{x1D719}}$
, from a direction-specific spatial average
 $\langle \overline{\unicode[STIX]{x1D719}}\rangle _{i}$
:
 $$\begin{eqnarray}\overline{\unicode[STIX]{x1D719}}_{i}^{\prime \prime }=\overline{\unicode[STIX]{x1D719}}-\langle \overline{\unicode[STIX]{x1D719}}\rangle _{i},\end{eqnarray}$$
where
 $\langle \rangle _{i}$
denotes the average over the
 $i$
th direction. The direction-specific dispersive fluxes averaged in the same direction
 $\langle \overline{s}_{i}^{\prime \prime }\overline{w}_{i}^{\prime \prime }\rangle _{i}$
physically represent the magnitude of spatial covariance, or the dispersive contribution linked to variability, in the
 $i$
-direction alone. These fluxes will vary in the other horizontal direction, but can then be averaged in that direction; for simplicity, we denote the planar-averaged direction-specific dispersive fluxes as
 $\langle s^{\prime \prime }w^{\prime \prime }\rangle _{i}$
. The results are shown in figure 13 normalized by the total flux
 $(\langle \overline{s}^{\prime \prime }\overline{w}^{\prime \prime }\rangle +\langle \overline{s^{\prime }w^{\prime }}\rangle )$
, where
 $s$
is
 $u$
or
 $\unicode[STIX]{x1D703}$
. We reiterate that, compared to the regular dispersive fluxes, direction-specific dispersive fluxes inform us about how the spatial variability in each direction contributes to the spatial covariance. Therefore, it is noteworthy that the dissimilarities between the dispersive transport of momentum and scalar are observed in both
 $x$
and
 $y$
directions. Figure 13(b) clearly depicts a monotonically increasing
 $\langle \unicode[STIX]{x1D703}^{\prime \prime }w^{\prime \prime }\rangle _{X}$
with
 $\unicode[STIX]{x1D706}_{f}$
, but the ‘cancellation’ effect leads to non-monotonic variation of
 $\langle u^{\prime \prime }w^{\prime \prime }\rangle _{X}$
with
 $\unicode[STIX]{x1D706}_{f}$
(figure 13
a). An equally important aspect of the results is that the
 $x$
-variability is more important than the
 $y$
-variability for the wider geometries, and the reverse is true for slender ones, as expected. For the
 $y$
-specific dispersive momentum stress, Slender06 stands out as the case that is completely dominated by this component (figure 13
c). This also applies to scalar fluxes, although there is less variation with geometry. This underlines the role of the long streamwise rolls that form in between the obstacles in case Slender06 (depicted in figure 5) and that seem to be significantly weakened even by the slight widening of the obstacles in Sf08.
Normalized direction-specific dispersive stress and flux for all cases: colour scale indicates
 $\unicode[STIX]{x1D706}_{f}$
, subscripts
 $X$
or
 $Y$
indicate direction-specific fluxes in the streamwise or spanwise direction (both subsequently planar averaged). (a,c) Streamwise and spanwise direction-specific normalized momentum stresses, respectively; (b,d) streamwise and spanwise direction-specific scalar fluxes, respectively.

3.2.2 Effects of geometry on dispersive transport efficiency
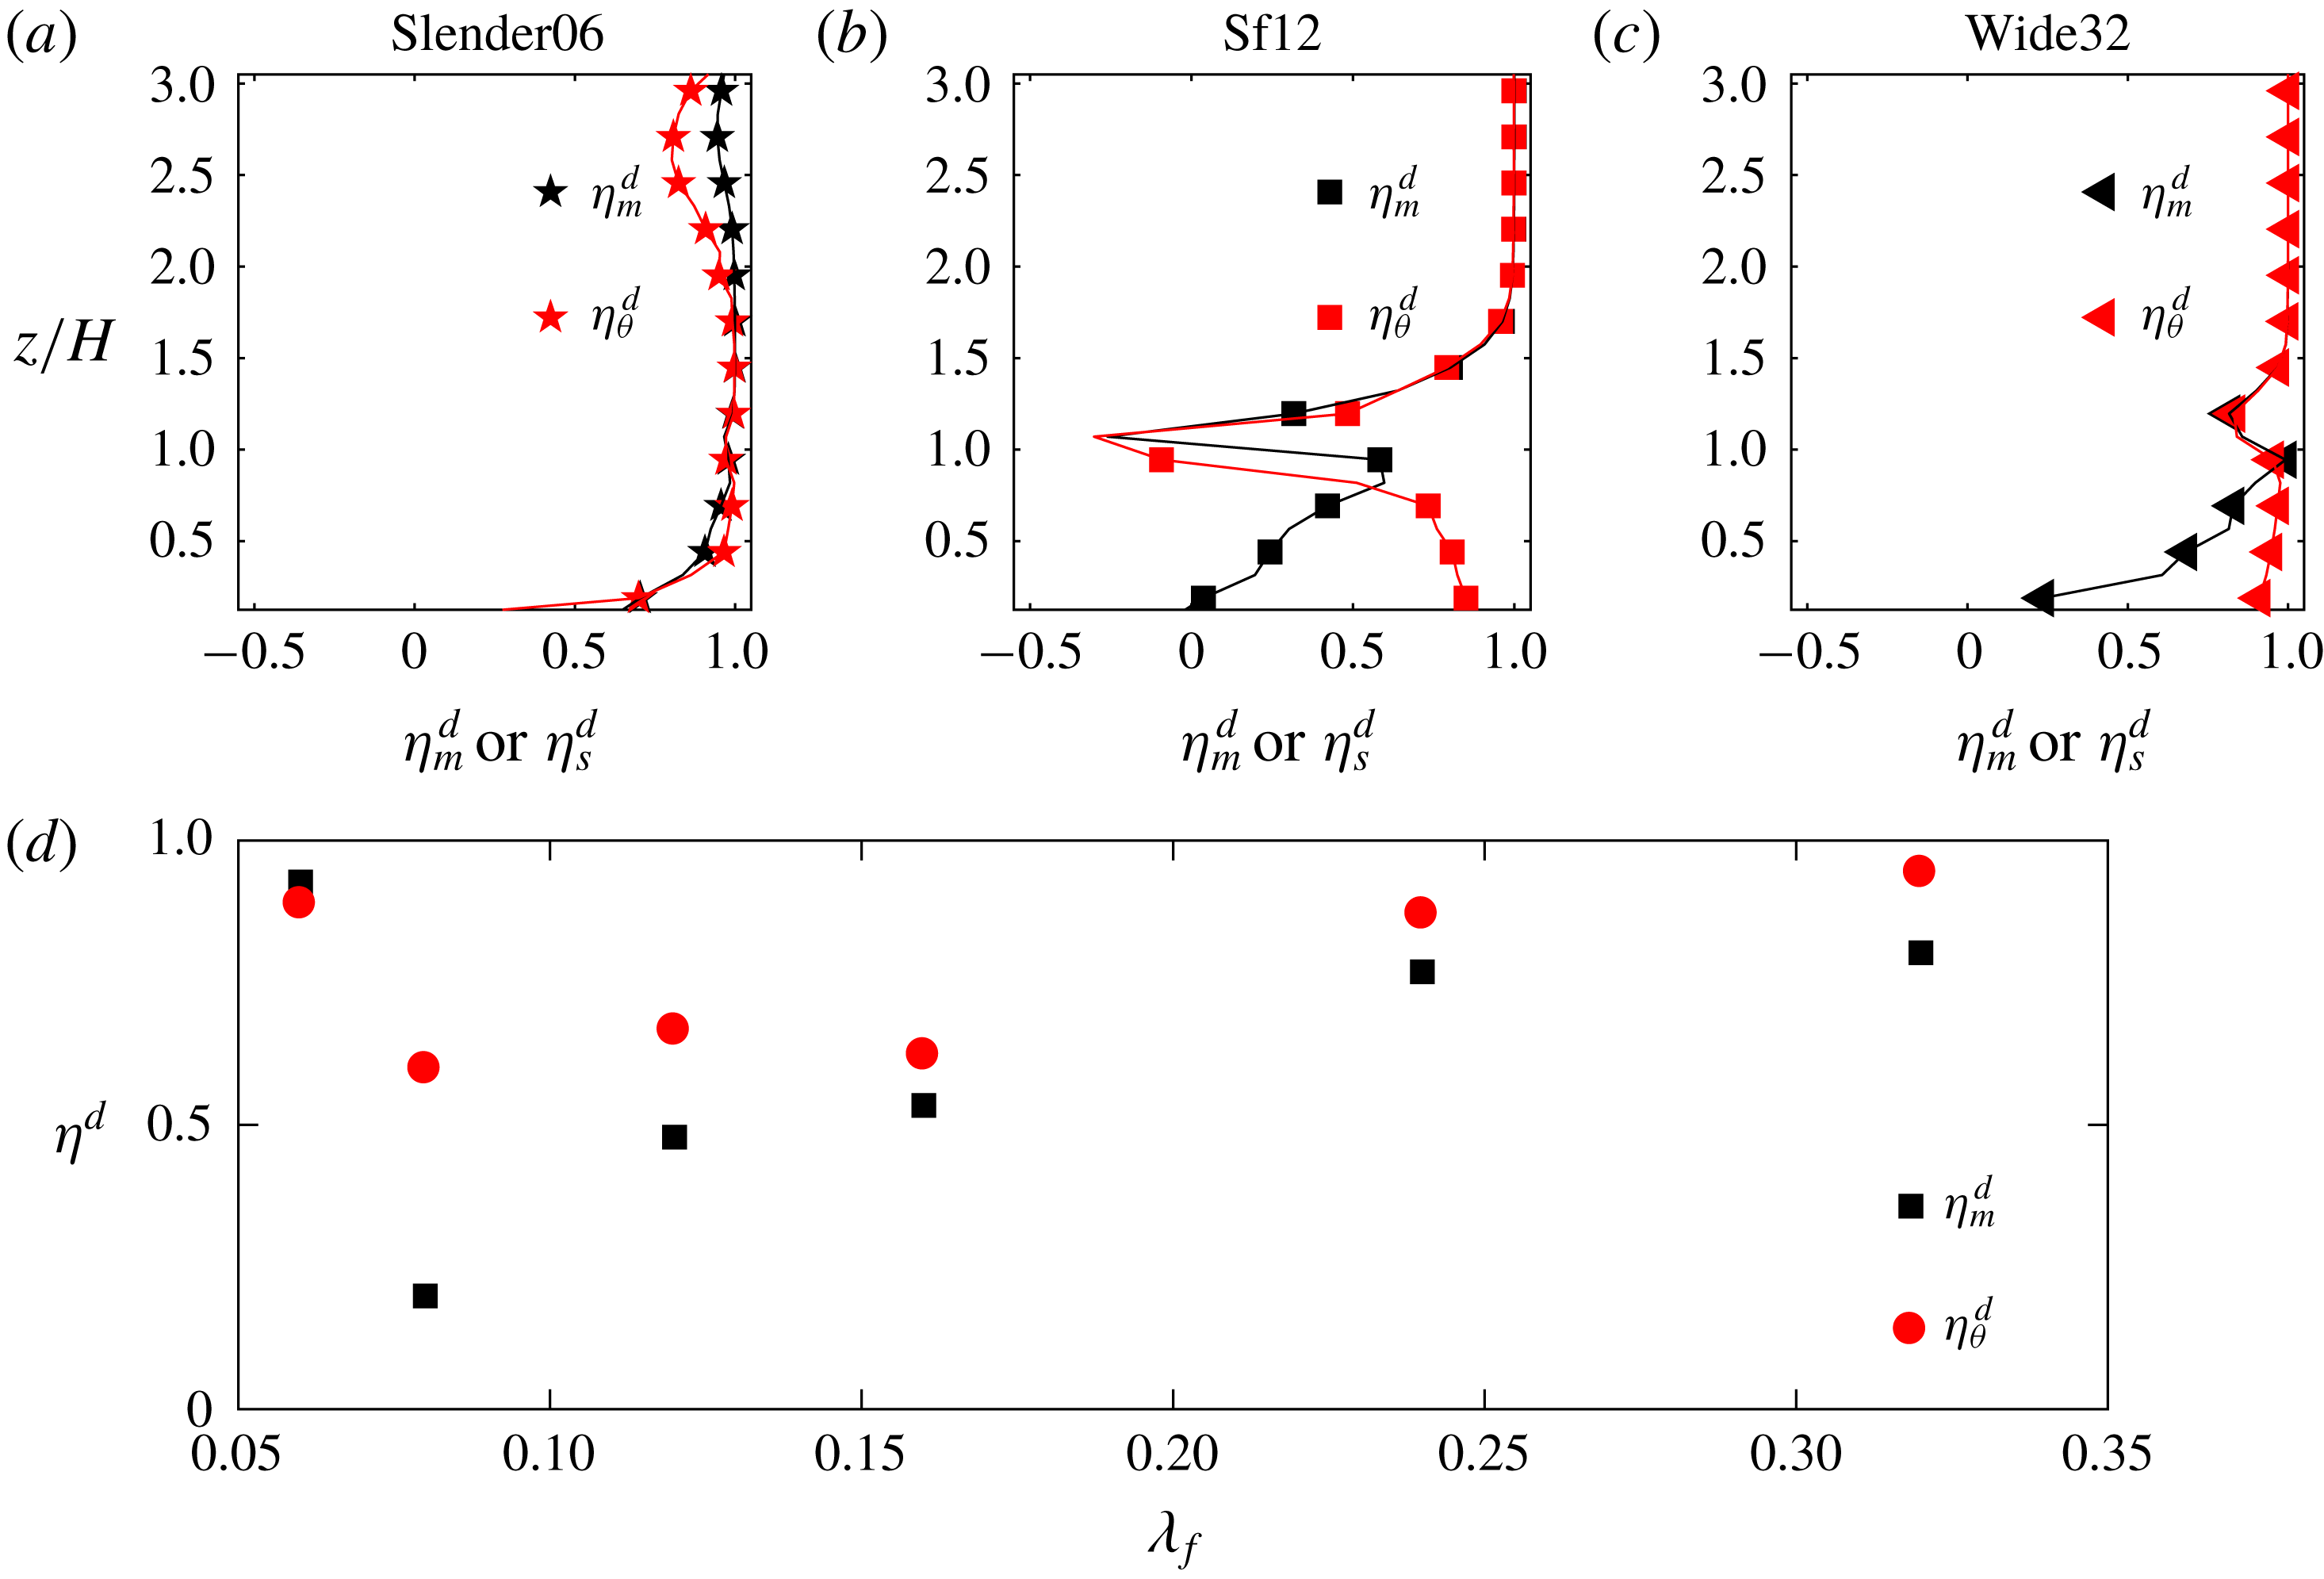
The effects of different geometries on the dispersive fluxes can be further studied using the approach of quadrant analysis, but now applied to
 $\overline{u}^{\prime \prime }$
,
 $\overline{w}^{\prime \prime }$
and
 $\overline{\unicode[STIX]{x1D703}}^{\prime \prime }$
(Pokrajac et al.
Reference Pokrajac, Campbell, Nikora, Manes and McEwan2007; Poggi & Katul Reference Poggi and Katul2008) in a similar way to applying it to turbulent fluctuations. Instead of indicating the presence of turbulent events, each quadrant event reveals the spatially coherent structures of the time-averaged quantities. An equivalent dispersive transport efficiency can be defined as the ratio of the total flux
 $\langle \overline{u}^{\prime \prime }\overline{w}^{\prime \prime }\rangle (z)=\sum _{i}^{4}F_{i}$
to the sum of the two
 $F_{i}$
contributions producing down-gradient fluxes. Here
 $F_{i}$
is the dispersive flux contribution of the
 $i$
th quadrant
 $F_{i}(z)=(L_{x}L_{y})^{-1}\int _{A}I_{i}(x,y,z)\overline{u}^{\prime \prime }(x,y,z)\overline{w}^{\prime \prime }(x,y,z)\text{d}\,A$
, where
 $I_{i}$
is an indicator function of the quadrant event and
 $A$
is extent of the horizontal domain. The same sign convention as the turbulent fluctuating components is applied to
 $\overline{u}^{\prime \prime }$
,
 $\overline{w}^{\prime \prime }$
and
 $\overline{\unicode[STIX]{x1D703}}^{\prime \prime }$
. The transport efficiency for momentum (
 $\unicode[STIX]{x1D702}_{m}^{d}$
) and scalars (
 $\unicode[STIX]{x1D702}_{\unicode[STIX]{x1D703}}^{d}$
) for the dispersive fluxes is hence defined as
 $\unicode[STIX]{x1D702}=\sum _{i}F_{i}/\langle F_{2}+F_{4}\rangle$
. For instance, when
 $u^{\prime \prime }<0$
and
 $w^{\prime \prime }>0$
, we denote it as a dispersive ‘sweep’, which indicates a persistent spatial feature. Similarly, we can also define a direction-specific dispersive transport efficiency for
 $\langle \overline{s}_{X}^{\prime \prime }\overline{w}_{X}^{\prime \prime }\rangle$
and
 $\langle \overline{s}_{Y}^{\prime \prime }\overline{w}_{Y}^{\prime \prime }\rangle$
as
 $\unicode[STIX]{x1D702}_{X}^{d}$
and
 $\unicode[STIX]{x1D702}_{Y}^{d}$
, respectively.
Dispersive transport efficiencies for different cases: (a)
 $\star$
, Slender06; (b) ▫, Sf12; (c) ▵, Wide32; (d)
 $\unicode[STIX]{x1D702}_{m}^{d}$
and
 $\unicode[STIX]{x1D702}_{\unicode[STIX]{x1D703}}^{d}$
averaged for
 $0\leqslant z\leqslant 2H$
.

Figure 14(a–c) indicates that there is distinct dissimilarity between the vertical distribution of
 $\unicode[STIX]{x1D702}_{\unicode[STIX]{x1D703}}^{d}$
and
 $\unicode[STIX]{x1D702}_{m}^{d}$
, related to the physical differences that arise from the role of pressure discussed above. In general,
 $\unicode[STIX]{x1D702}_{m}^{d}<\unicode[STIX]{x1D702}_{s}^{d}$
, except for case Slender06 shown in figure 14(d). This is in stark contrast to the turbulent transport efficiencies shown in figure 7 where the slender case was the one showing a lower turbulent momentum transport efficiency. As
 $\unicode[STIX]{x1D706}_{f}$
increases, a non-monotonic trend is observed for the difference between ‘efficiency’ of dispersive transport of momentum and the passive scalar, with the most eccentric geometries again showing the highest transport efficiencies. The high efficiency in Slender06 can be understood as a result of the absence of the ‘cancellation’ effect as discussed in the previous paragraph, and of the stronger dispersive variability in the lateral direction as indicated in figure 13(c) and by the long structures depicted in figure 5. The lower pressure drag associated with the small
 $\unicode[STIX]{x1D706}_{f}$
in Slender06 prevents the formation of a recirculation zone and no ‘counter-gradient’ dispersive momentum flux at the leading edge is present. With increasing
 $\unicode[STIX]{x1D706}_{f}$
, the
 $y$
-direction dispersive fluxes drop, even becoming negative for the Sf08 momentum flux (figure 13
c) due to strong ‘counter-gradient’ fluxes at the leading edge. As
 $\unicode[STIX]{x1D706}_{f}$
continues to increase, the influence of the
 $y$
-direction variability is minimized and the
 $x$
-direction dominates, resulting in a monotonic increase in the efficiency as the ‘down-gradient’ dispersive momentum fluxes in the recirculation region increase. Therefore, a number of competing factors, such as the differences in spatial variabilities in
 $x$
and
 $y$
directions for different geometries, collectively influence the non-monotonic behaviour of dispersive fluxes as
 $\unicode[STIX]{x1D706}_{f}$
increases.
Dispersive transfer of scalar is less impacted by the change of geometry due to the absence of cancellation effect. However, with larger recirculation regions (from cases Sf08 to Wide32), the efficiency and magnitude of both the dispersive momentum and scalar fluxes are enhanced. The complex flow dynamics and non-monotonic changes with
 $\unicode[STIX]{x1D706}_{f}$
underline the need for more detailed investigation to relate the universal features of dispersive transport of momentum and scalar to the topological characteristics of the surface, and to construct a model for dispersive fluxes. However, since this is not one of the central research questions of this study, we have to leave it to future investigations.
4 Conclusion
We use LES to compare and contrast the transport of momentum and passive scalars, by turbulent and dispersive fluxes, over very rough surfaces consisting of three-dimensional cuboidal roughness elements. The focus is on the canopy and roughness sublayers, since above these layers the flow reverts to a canonical wall-bounded flow regime. The effect of the frontal blockage of the roughness geometry on the fluxes is also investigated.
The influence of different three-dimensional roughness elements alters the general turbulent flow characteristics. We observe a general transitioning behaviour from a canonical wall-bounded flow type to a mixing-layer-like one or ‘obstructed shear flow’, when the frontal area ratio
 $\unicode[STIX]{x1D706}_{f}$
increases. This ratio encodes the flow blockage by the roughness elements, and the preponderance of free-shear wakes behind the roughness elements. This is particularly illustrated by the decrease in the shear length scale and the enhanced penetration of low-frequency eddies (associated with large scales) into the canopy layer as
 $\unicode[STIX]{x1D706}_{f}$
increases. This transition causes a monotonic and significant increase in the momentum transport efficiency as the flow becomes more mixing layer like, while on the contrary the transport efficiency for scalars measured by the correlation coefficient changes more mildly and non-monotonically with increasing
 $\unicode[STIX]{x1D706}_{f}$
. This is mainly a result of the distinct contributions from large-scale motions in the roughness sublayer, which are able to increase the interaction between the canopy sublayer and the roughness sublayer more effectively for momentum than for scalars as the geometry is modified to increase flow obstruction. Turbulent transports of momentum and passive scalar are found to be broadly similar in general, as evidenced by a quadrant analysis, with a marginally higher averaged turbulent momentum transfer efficiency. The unique exception is case Slender06, where the difference in turbulent momentum and scalar transports becomes more substantial.
A distinct feature of flows over very rough surfaces is that dispersive fluxes can be significant, particularly for the most eccentric geometries (Slender06 and Wide32) where they amount to
 ${\approx}50\,\%$
of the total flux. The dispersive momentum and scalar fluxes show more pronounced differences than their turbulent counterparts. Directional analysis of dispersive fluxes also confirm such differences in both the streamwise and spanwise directions, the latter displaying a higher sensitivity to the underlying surface topology. The differences between momentum and scalar dispersive fluxes are traced back to the non-local action of pressure in the momentum dispersive contributions, and the absence of a pressure counterpart for scalar transport. Thus, the geometry has a larger influence on the momentum fluxes than on the scalar fluxes, as indicated by more pronounced changes in momentum dispersive transport efficiency. The most pronounced discrepancies between momentum and scalars are noted for the more symmetric geometries, while the most eccentric ones display comparable transport efficiencies. In particular, Slender06 again emerges as the exception, displaying the strongest scalar–momentum similarity for the dispersive part. This unique behaviour of Slender06 is shown to be related to the dominance of dispersive variability in the cross-stream direction; however, more research is needed to fully elucidate how the asymmetry of roughness elements influences the spatial coherence of the dispersive fluxes.
Although we only simulated flows with constant scalar concentration boundary conditions, the results about dis(similarity) between turbulent and dispersive fluxes and between momentum and scalars should hold for flux or mixed boundary conditions as well. On the other hand, if the scalar concentration influences buoyancy (e.g. with large temperature fluctuations), the active role of the scalars will then have a strong impact on the dynamics (Li & Bou-Zeid Reference Li and Bou-Zeid2011) and the present results will be altered. This study demonstrates that the (dis)similarity between momentum and scalar transport in three-dimensional very rough surfaces can be complicated by the spatial variability of the roughness elements and the specific topology of the underlying geometry. However, the present findings, especially the significance of the scalar dispersive flux contributions over dense canopy, can inform the interpretation of experimental measurements, which are often pointwise data where dispersive fluxes cannot be estimated: such measurement in the canopy and roughness sublayers are missing nearly half of the total fluxes. This can be overcome by collecting data (e.g. using movable hotwires or particle image velocimetry) at various spatial locations to be able to assess the dispersive contributions. In addition, in the dense canopy sublayer, the mechanistic difference (arising from the pressure term) in generating dispersive momentum and scalar fluxes need to be incorporated in model development. Current parameterizations either neglect dispersive fluxes or do not distinguish them from turbulent fluxes, but, as our analyses show, their physics are quite distinct and this difference is not the same for momentum and scalars.
Acknowledgements
This work was supported by the NOAA-Princeton Cooperative Institute for Climate Science and by the U.S. National Science Foundation’s Sustainability Research Network Cooperative Agreement 1444758 and grant 1664091. The simulations were performed on the supercomputing clusters of the National Center for Atmospheric Research through projects P36861020 and UPRI0007. The authors would like to thank the anonymous reviewers for their constructive comments.
Appendix A. Resolution test
Comparisons of horizontally averaged quantities. (a)
 $\langle u/u_{\ast }\rangle$
, (b)
 $\langle (\unicode[STIX]{x1D703}_{0}-\unicode[STIX]{x1D703})/(\unicode[STIX]{x1D703}_{0}-\unicode[STIX]{x1D703}_{1})\rangle$
, where
 $\unicode[STIX]{x1D703}_{0}=\unicode[STIX]{x1D703}(z=0.125H)$
and
 $\unicode[STIX]{x1D703}_{1}=\unicode[STIX]{x1D703}(z=\unicode[STIX]{x1D6FF})$
, (c)
 $\langle u^{\prime }w^{\prime }/u_{\ast }^{2}\rangle$
, (d)
 $\langle \unicode[STIX]{x1D703}^{\prime }w^{\prime }/u_{\ast }\unicode[STIX]{x1D703}_{1}\rangle$
.

Comparison of the dispersive fluxes contributions for different simulation set-ups for (a) momentum, (b) scalar.

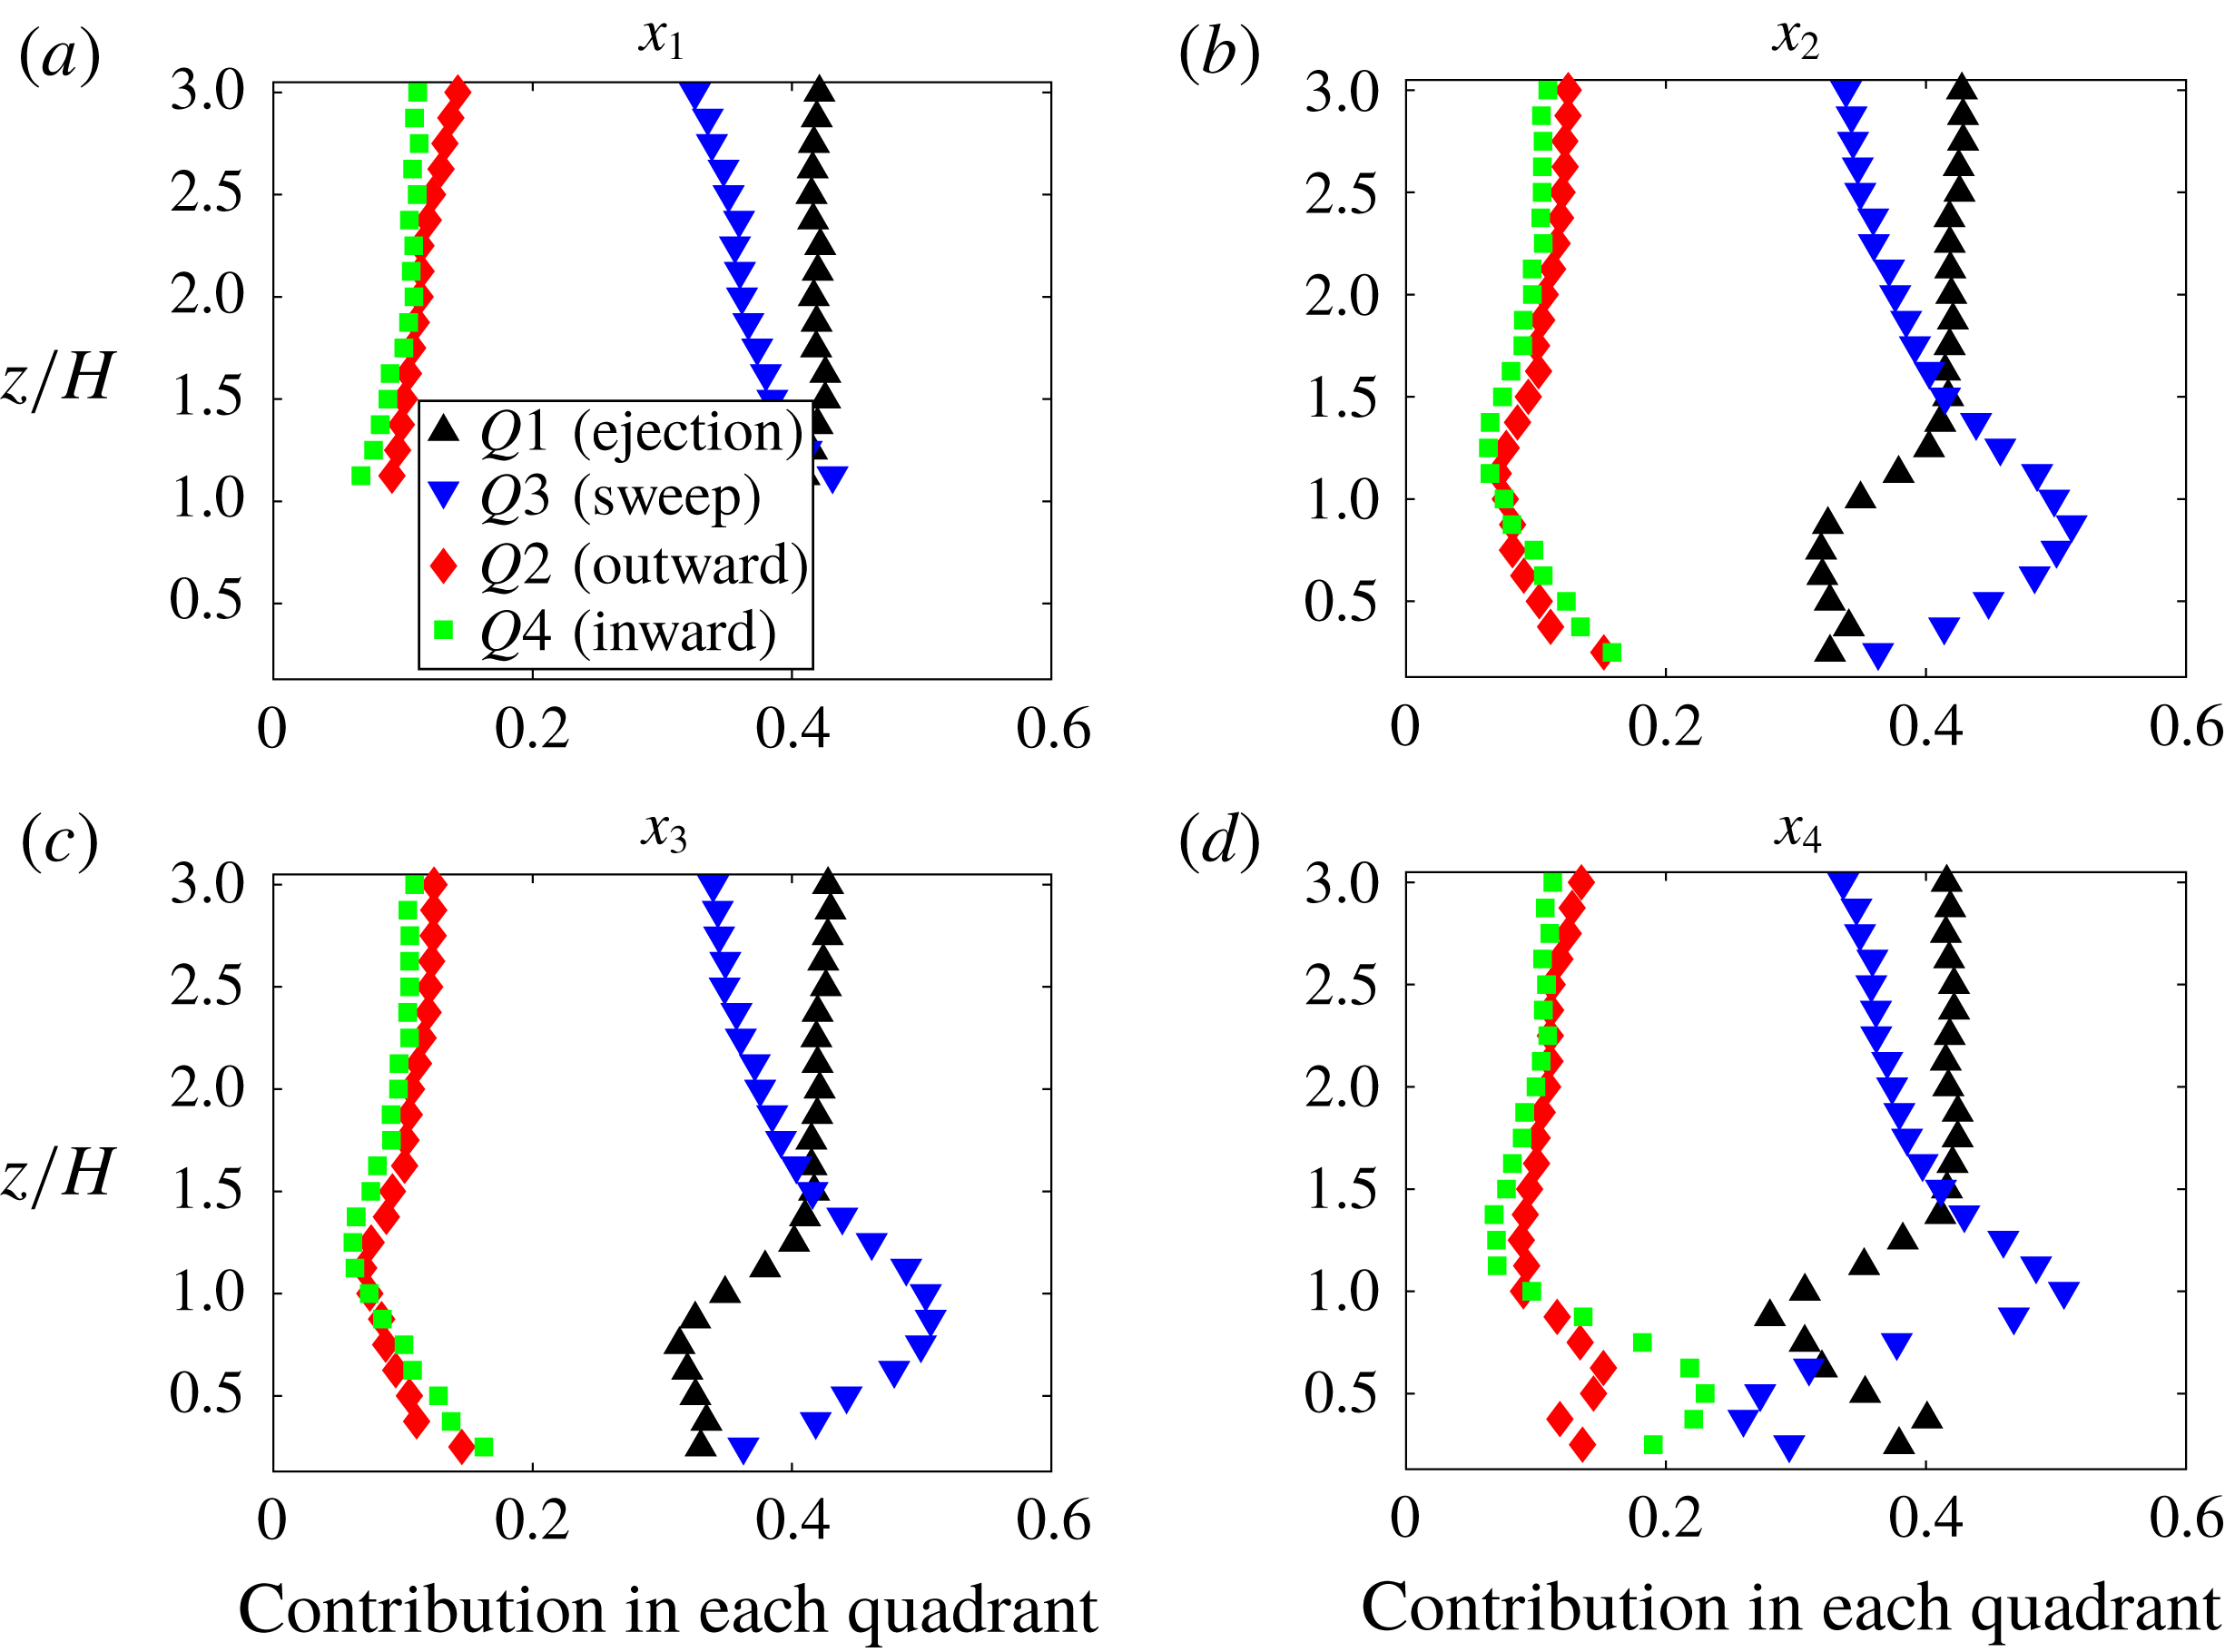
Contribution to total flux for momentum for Slender06. (a–d) points
 $x1$
–
 $x4$
indicated in figure 1. Ejections are black ▵; sweeps are blue ▿; outward interactions are red ♢; and inward interactions are green ▫.

Contribution to total flux for scalar for Slender06 (a–d) points
 $x1$
–
 $x4$
indicated in figure 1. Ejections are black ▵; sweeps are blue ▿; outward interactions are red ♢; and inward interactions are green ▫.

A sensitivity test is carried out to examine the effect of the number of points used in representing the obstacles. It was found previously by Tseng et al. (Reference Tseng, Meneveau and Parlange2006) that at least 6 points per dimension of the obstacle are required to represent a solid in LES (they used a similar approach and LES code to the ones we are using here). Therefore, we doubled the resolutions for the case Wide32 listed in table 1. In addition, a test case with all other parameters maintained the same as Wide32 except for
 $L_{x}/\unicode[STIX]{x1D6FF}$
, which was doubled to 6.25, was also conducted. Figure 15 shows the comparison between the original simulation, the higher resolution case and the case with longer domain length, where
 $\unicode[STIX]{x1D703}_{1}$
is
 $\langle \unicode[STIX]{x1D703}\rangle$
at
 $z=\unicode[STIX]{x1D6FF}$
and
 $\unicode[STIX]{x1D703}_{0}$
is
 $\langle \unicode[STIX]{x1D703}\rangle$
at
 $z=1/8H$
. Both test cases were run for approximately 30 eddy turnover times and are averaged for the last 15 eddy turnover times. We compute the height-averaged relative mean square error defined as
 $r_{e}^{n}=\langle \sqrt{(q_{n}-q_{0})^{2}}/q_{0}\rangle _{z}$
, where
 $q_{n}$
is some quantity for comparison in case
 $n$
(
 $n=1$
being doubled
 $L_{x}$
and
 $n=2$
being the case of double resolution in all directions) and
 $q_{0}$
is that same quantity from the initial set-up of case Wide32. The value of
 $r_{e}^{1}$
in percentage for (a–d) are 1.7, 1.5, 15 and 27 %;
 $r_{e}^{2}$
in percentage for (a–d) are 1.7, 2.0, 5.5 and 4.2 %.
 $r_{e}^{2}$
are all within 6 % compared to case Wide32, which shows that we achieve good grid convergence. The larger deviation seen in case of doubled
 $L_{x}$
in the second-order moments is due to the fact that in the larger domain the streamwise roll are less persistent and the convergence to a linearly decreasing stress (as expected) is faster. However, for
 $z/H<2$
, the deviation in the case of doubled
 $L_{x}$
is small, likely because of the dominance of the small-scale wall-attached eddies.
Figure 16 shows the percentage of dispersive momentum and scalar flux to total flux for these three cases. Good agreements between the three cases confirm that the differences observed between dispersive momentum and scalar fluxes are robust, especially for the roughness sublayer, which is the focus of this study.
Appendix B. Quadrant analysis at different points
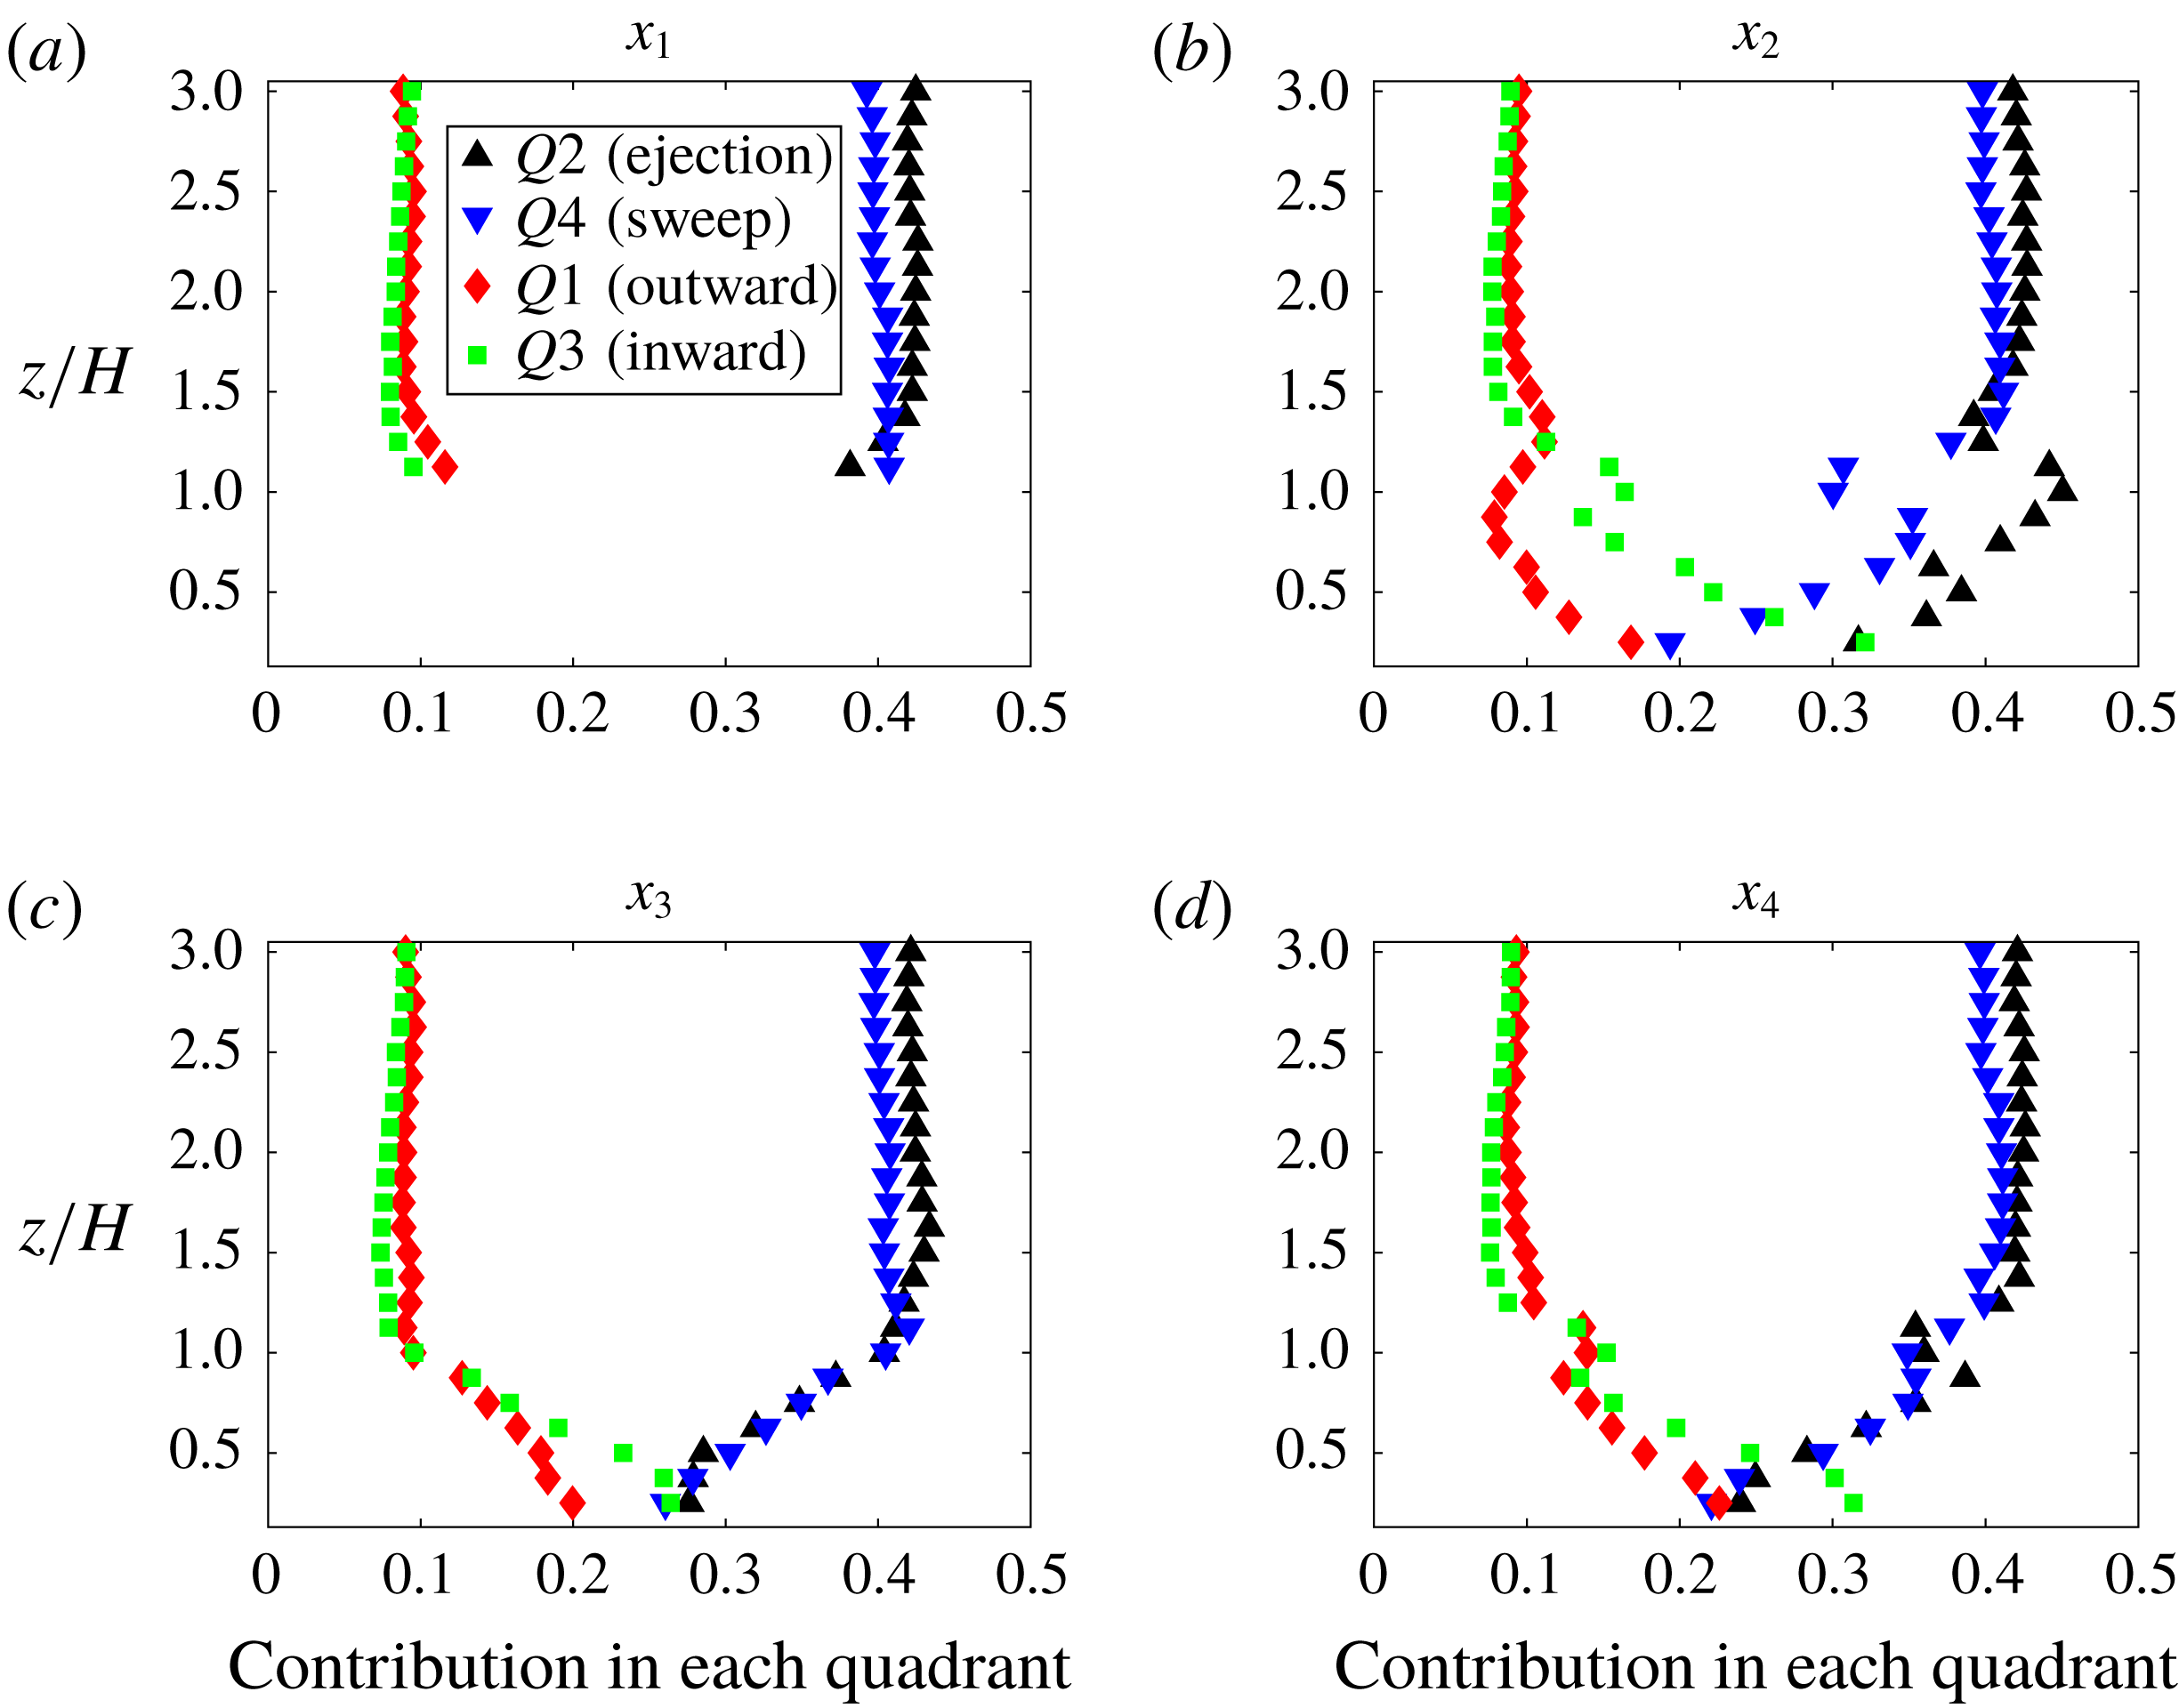
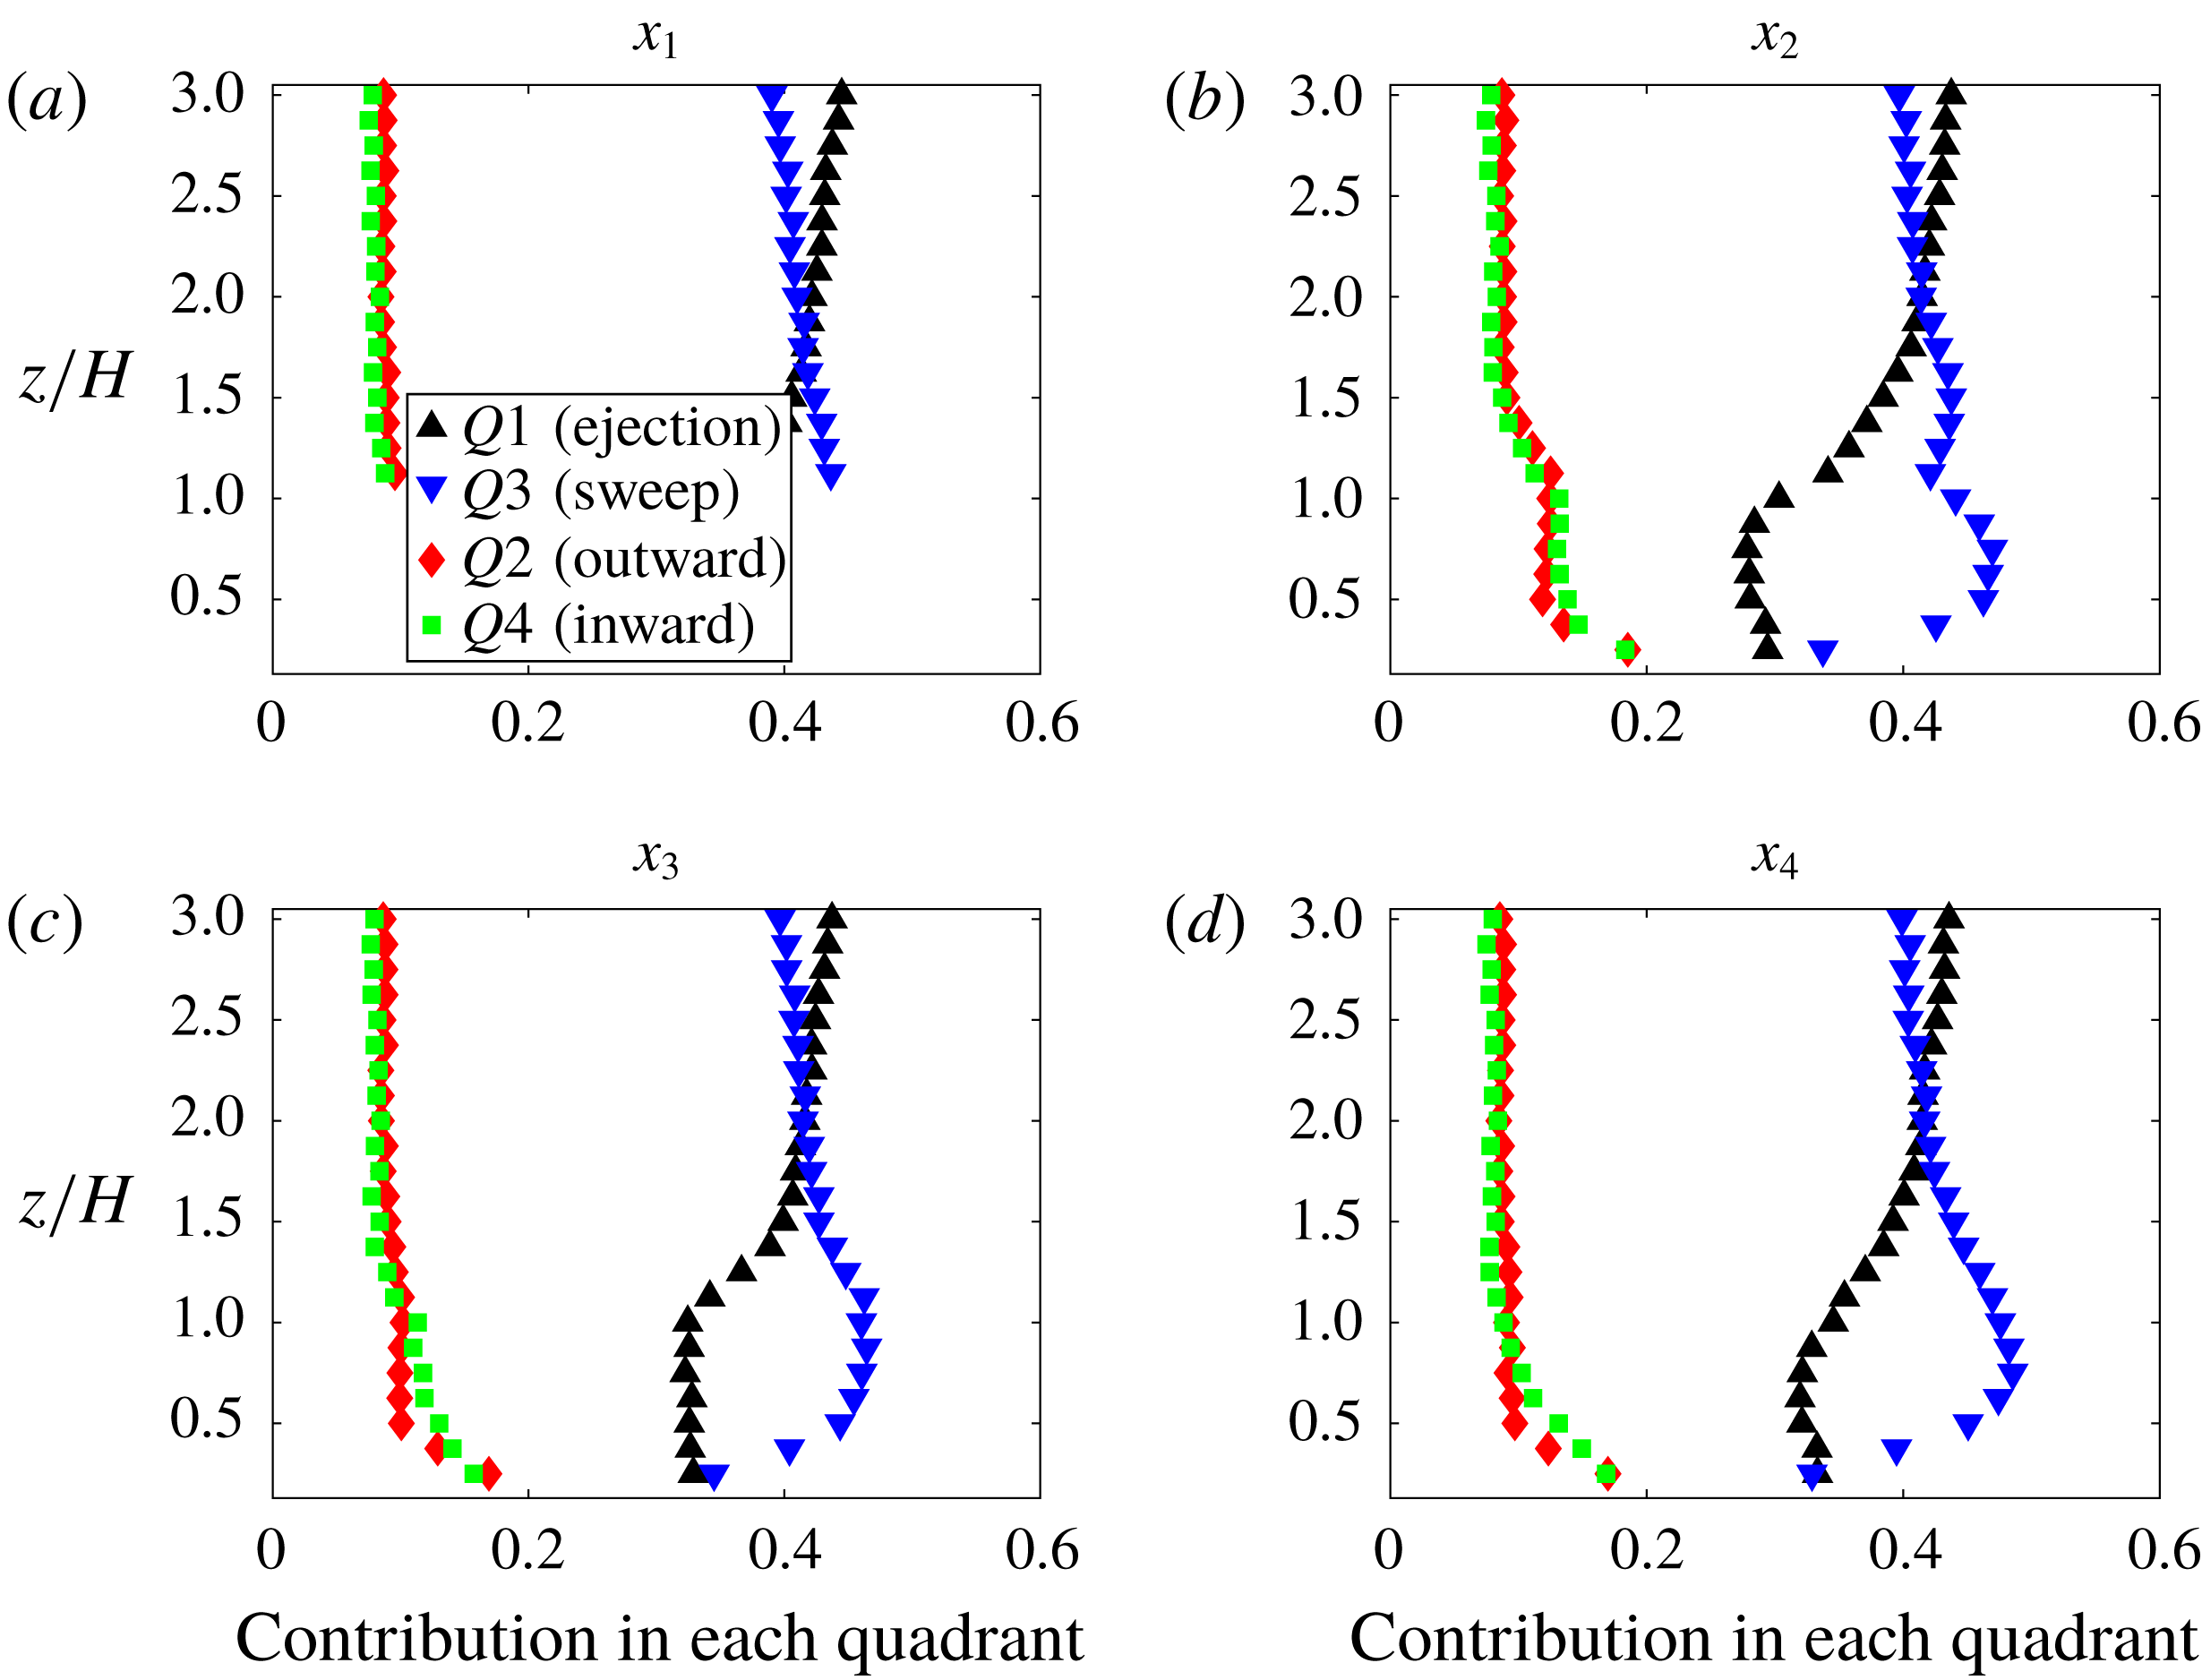
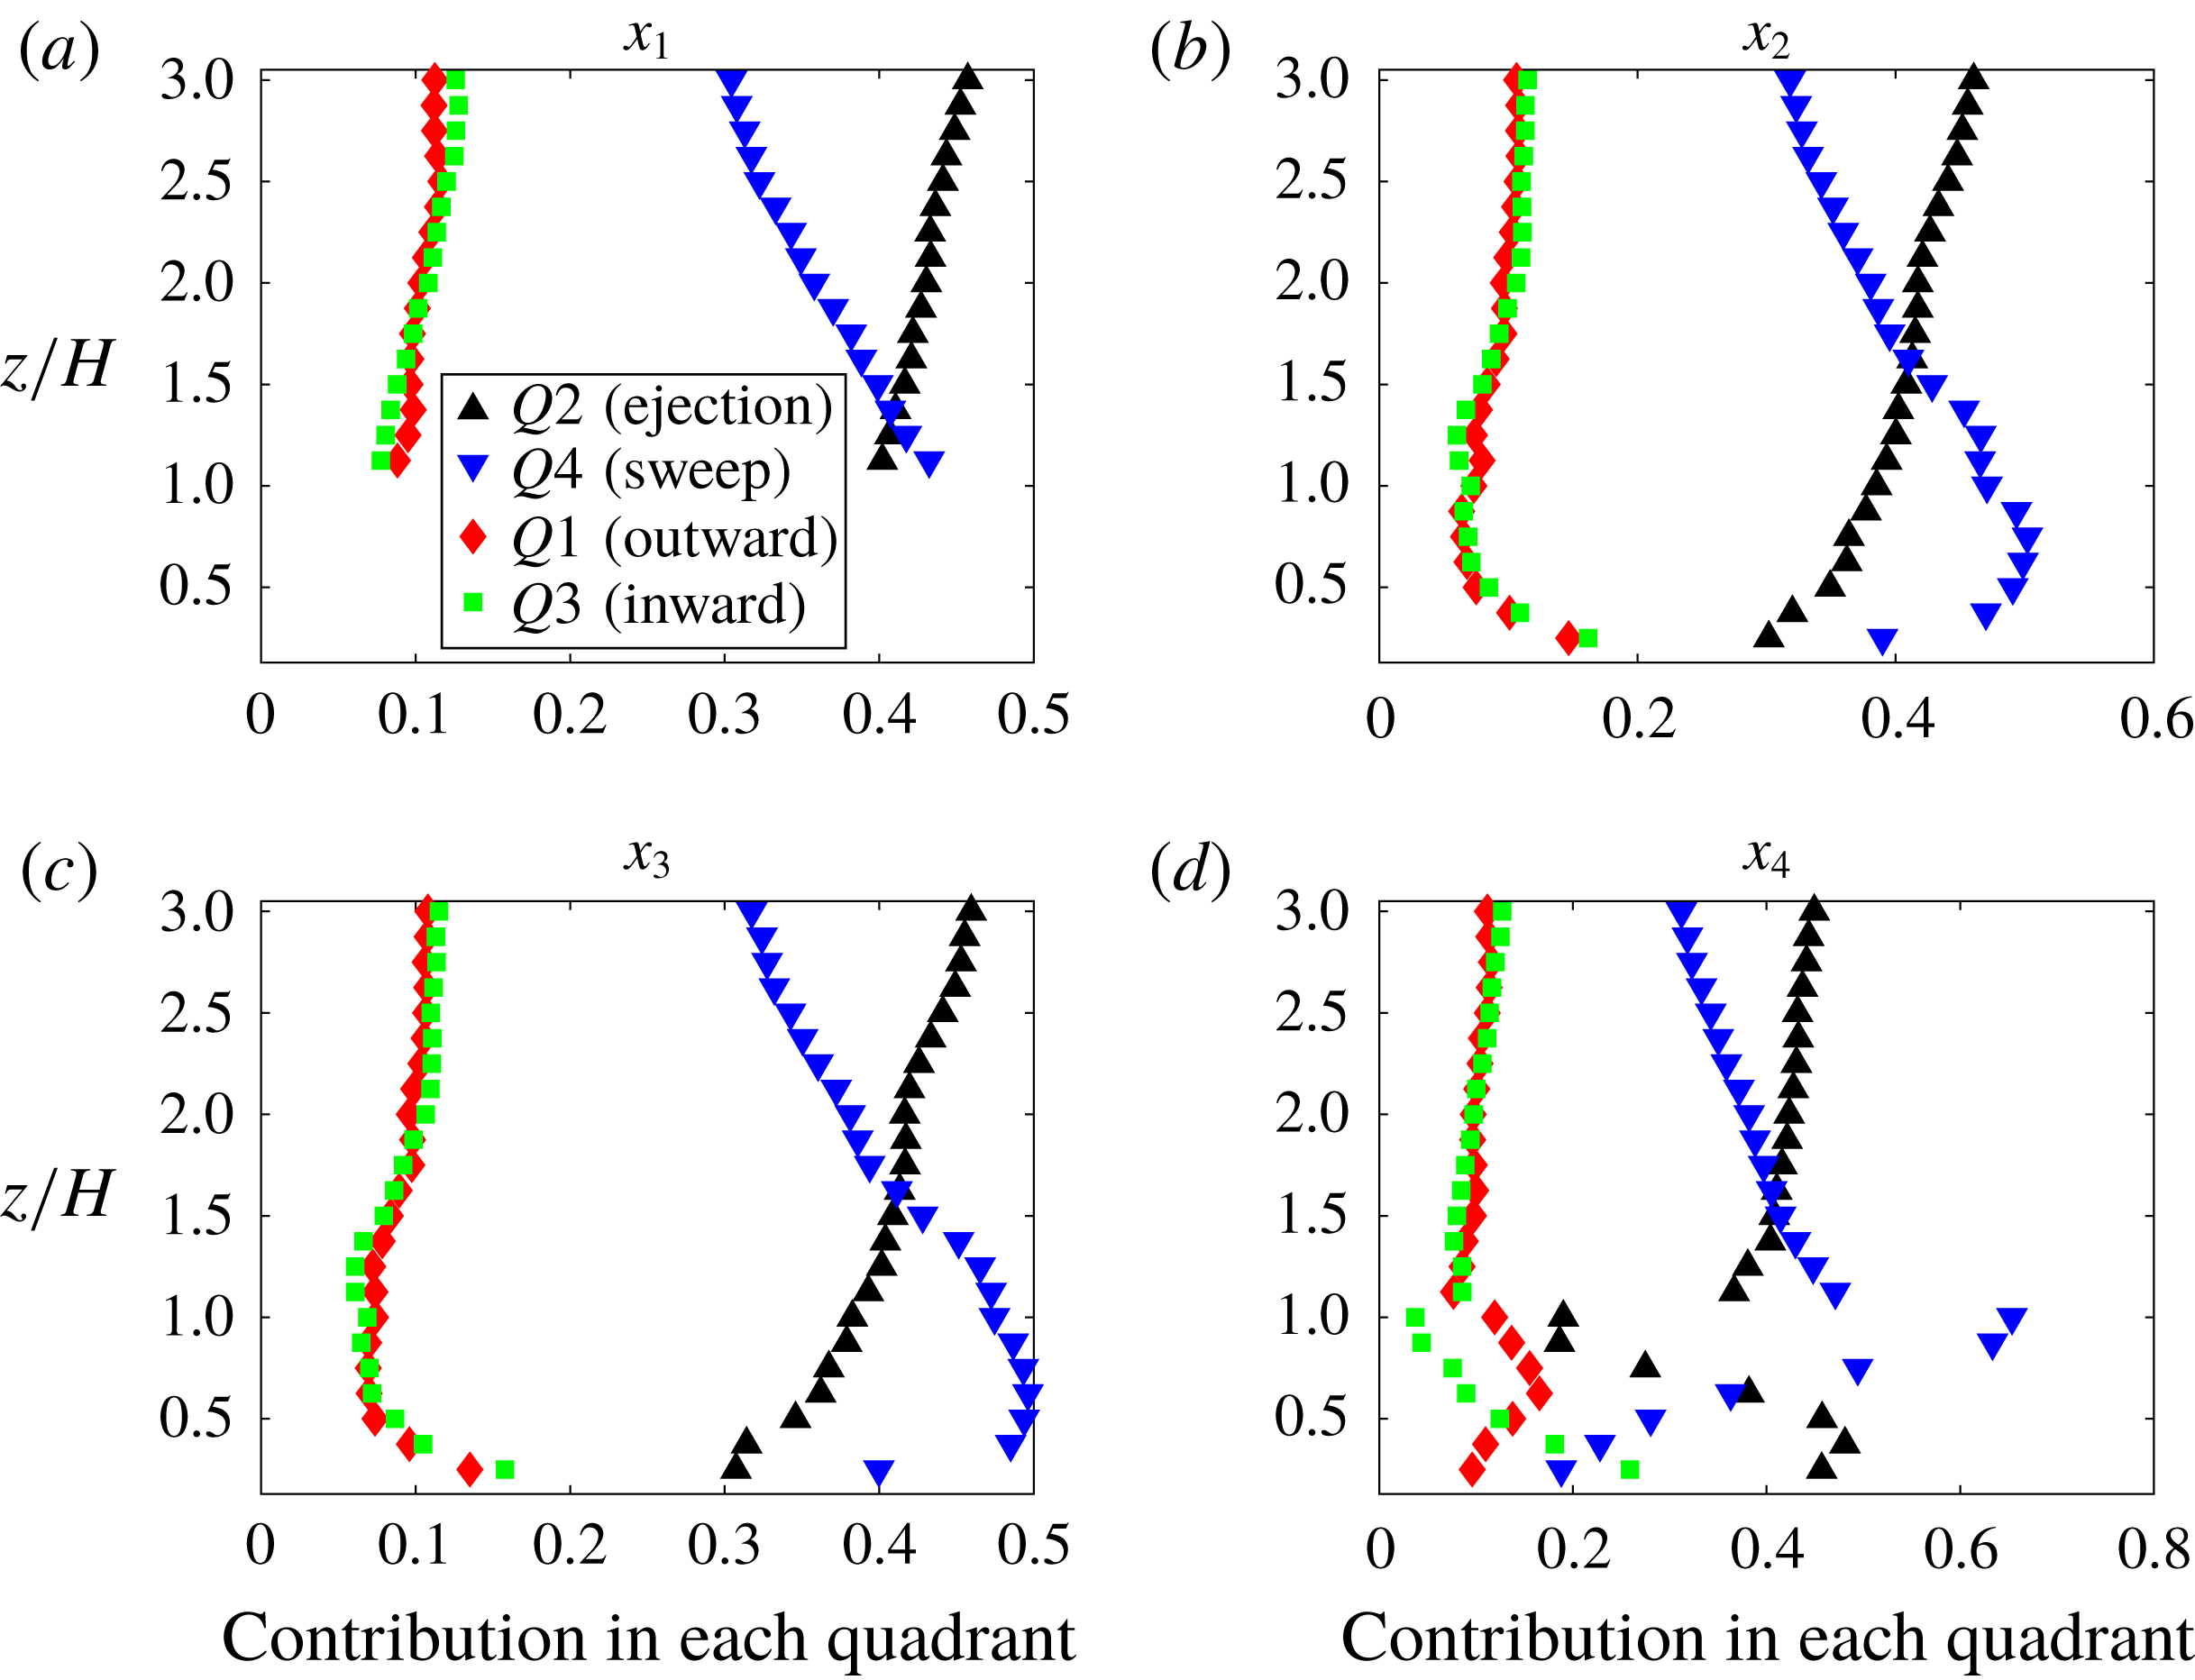
Quadrant analyses similar to results in figure 6 are presented here for Slender06 in figures 17 and 18; Wide32 in figures 19 and 20.
Contribution to total flux for momentum for Wide32 (a–d) points
 $x1$
–
 $x4$
indicated in figure 1. Ejections are black ▵; sweeps are blue ▿; outward interactions are red ♢; and inward interactions are green ▫.

Contribution to total flux for scalar for Wide32 (a–d) points
 $x1$
–
 $x4$
indicated in figure 1. Ejections are black ▵; sweeps are blue ▿; outward interactions are red ♢; and inward interactions are green ▫.