

Recent educational research argues that students learn more during class time that is spent working actively rather than listening more passively to an instructor-delivered lecture. However, despite these positive findings, political science classrooms tend to rely on teacher-centered rather than student-centered activities that promote active learning (Archer and Miller Reference Archer and Miller2011). In our experience, this is partly due to instructors’ uncertainty about how to form active-learning teams in ways that are fair, fast, and generate balance on student characteristics across the groups. Heterogeneity within groups has been found to improve student outcomes, and it enables each team to draw on a more diverse set of skills, experiences, and knowledge from its members.
Here, we seek to lower instructors’ costs of implementing group activities, enabling them to focus on structuring the content of activities with confidence that their procedure scales to large classes, large groups, or classes that change rapidly as students join or drop out during the term. We accomplish this by deploying research tools that already may be familiar to many instructors and that allow us to incorporate substantial information about students. For those unfamiliar with our approach, this article describes the necessary steps and offers supplementary support. Our method for quickly creating heterogeneous groups easily can incorporate almost as many student attributes as there are students.
Below, we describe recent pedagogical findings about small-group learning and detail common strategies for creating such groups. We then introduce our approach in the context of an actual project that we assigned in class, an exercise applying a policy-making model (Kingdon Reference Kingdon2003) to the Patient Protection and Affordable Care Act (ACA) legislation in a medium-sized undergraduate course in American politics. Here, we explicate the three lines of R code that create heterogeneous groups. We then demonstrate that our approach generates teams that are considerably more heterogeneous than if we allocate students purely at random—but with virtually no additional work on the part of the instructor. Our approach generates well-balanced allocations across teams regardless of whether we consider a single discrete measure (e.g., student gender or semester of enrollment) or a larger set of measures with a variety of distributional forms. Ultimately, a clear, scalable, and successful procedure will allow instructors to confidently design more team-based work for political science classes of all sizes.
TEAM-BASED LEARNING AND ITS CHALLENGES
When compared to lectures, small projects that involve active student teams increase test scores in political science (Centellas and Love Reference Centellas and Love2012) and also improve achievement, attitude, and persistence in statistical methods and cognate courses (Kalaian and Kasim Reference Kalaian and Kasim2012a). Inquiry into the effects of group work in science and math courses emerged decades ago (Springer, Stanne, and Donovan Reference Springer, Elizabeth Stanne and Donovan1999), and this field of research continues to grow (Kalaian and Kasim Reference Kalaian and Rafe M.2012b). Similarly, collaborative learning has been promoted by teachers of English and medicine for many years (Bruffee Reference Bruffee1984). Recently, political scientists have found that small-group discussions increase participation overall but also remedy classroom inequalities. Small-group discussions can diminish how strongly prior academic success determines participation, and they can promote more equitable participation by students of varying ethnicities (Pollock, Hamann, and Wilson Reference Pollock, Hamann and Wilson2011). These benefits may be especially salient in extremely large classes that expose students to unfamiliar political concepts for the first time (Truby, Weiss, and Rousseau 2014).
We recognize several barriers to conducting successful in-class exercises centered around student interaction in teams. This article focuses on the challenge of constructing adequately heterogeneous groups with minimal effort, and it provides practical advice to meet this challenge. At the same time, we note that team-based exercises also generate important questions related to assessment (e.g., “How do I score absentees?”), integration (e.g., “How do I balance presenting new material with practice applying previously learned skills?”), and classroom seating arrangements, especially in large classes. A particularly vexing issue in team-based work can be how to monitor or address variations in motivation (e.g., “How do I get students to engage with the project and each other?”). Nilson (Reference Nilson2010) suggests an array of pedogical strategies, ranging from assessing individuals at random to allowing team members to “fire” slackers.
Designing appropriate activities can be challenging. In our experience with successful in-class exercises, there is a fine line between using skills that students have acquired in class and stretching into uncharted territory. Even with assignments that are self-contained so as to be completed in a class period, we have found success with assignments that require students to use web-based resources (e.g., thomas.loc.gov for legislative history and sda.berkeley.edu for survey data analysis) or the websites of government entities or nonprofit organizations (e.g., the Social Security Administration or the Kaiser Family Foundation). There are several resources for team-based participatory projects in political science and research methods such as data analysis, statistical estimation, and inference (Doherty Reference Doherty2011; Gelman and Nolan Reference Gelman and Nolan2002). We discuss one of our own exercises in a subsequent section of this article.
ALTERNATIVE STRATEGIES FOR CREATING TEAMS
Even after activities have been designed, an instructor still must create balanced learning teams quickly and successfully. In fact, creating balance across teams (and, thus, heterogeneity within teams) can improve student outcomes, even for students of high ability (Heller and Hollabaugh Reference Heller and Hollabaugh1992). One possible approach is to quickly create student pairs or to have students pair off themselves (Gelman and Nolan Reference Gelman and Nolan2002). Although this approach is efficient for classroom management and for short exercises, it typically relies on where students choose to sit and with whom they choose to work. Thus, quick pairs may not carry the benefits of a diverse-group design. They may be particularly limited when group projects extend well beyond a single class period (Rivera and Simons Reference Rivera and Simons2008) and groups are “project learning teams” or “long-term learning teams” (Rothgeb Reference Rothgeb2013, 336).
In creating heterogeneous learning teams that are balanced across the class, how many student attributes can be reasonably incorporated? How can instructors be sure they are not subconsciously stacking some groups in undesirable ways (e.g., by putting strong or well-liked students together)? Recent work suggests quickly creating teams by having students line up according to a single variable and then count off (Truby, Weiss, and Rousseau 2014), but this approach incorporates only a single measure and could produce the same teams for several exercises. When an instructor wants heterogeneity along several dimensions, or different groups for exercises in different class meetings, or both, these strategies may not suffice.
We may want teams that embody heterogeneous mixes of student abilities, years, and demographics, but how can we ensure that our procedure successfully creates such groups? First, laborious, by-hand procedures for creating teams may hold promise for producing well-mixed groups, but they are likely to fall short in replicability across several class assignments, in scalability to larger classes and more student attributes, and in avoiding unconscious instructor biases. Second, the simple random allocation of students to groups can be repeated across class assignments, easily scaled to large classes, and is likely to avoid instructor biases. However, as we show below, such random allocations do not produce mixed groups as well as procedures that explicitly take into account student covariates. Therefore, we propose a procedure that uses freely available software to improve heterogeneity of groups and to incorporate several student attributes.
We may want teams that embody heterogeneous mixes of student abilities, years, and demographics, but how can we ensure that our procedure successfully creates such groups?
CREATING BALANCED TEAMS USING RESEARCH SOFTWARE
Our strategy satisfies certain core guidelines for team formation: groups should not be selected by students, groups should be heterogeneous, and groups should be constructed transparently (Michaelsen et al., 2008). Specifically, we adapt a method developed for creating homogeneous groups within which a set of experimental treatments can be assigned. To do so, we exploit a software implementation in R (Moore and Schnakenberg Reference Moore and Schnakenberg2014; R Core Team 2014).
Our Approach
In the design of randomized experiments, assigning treatments within homogeneous groups yields experiments with better balance between treatment conditions and more precision in the estimation of treatment effects (Moore Reference Moore2012). Here, we leverage the fact that distributing different treatment assignments within homogeneous groups parallels distributing a homogeneous characteristic (i.e., being a member of a certain team) to a heterogeneous group.
In an undergraduate course on the American welfare state, students take provisions of a substantial piece of legislation,Footnote 1 work in teams to understand the provisions, analyze them using Kingdon’s (Reference Kingdon2003) policy-making model, conduct contextualizing research, and write a short memo in class. On completion of the project, students have read an actual piece of congressional legislation, communicated about its meaning and significance, identified key theoretical concepts that describe the policy-making episode and the resulting policy, and crafted a succinct statement with the benefit of the informal editing and iteration inherent in team-based composition.
Shortly before the course meeting, we downloaded the course roster—which recently included 38 students—opened R, and loaded the blockTools library.Footnote 2 With three lines of code, we created groups for the team-based project. The first line reads the data. The second line creates 10 groups incorporating the only demographic data available on these students—their semester as reported by the registrar (numbered 1 through 8 and labeled “semester” in the example below). The third line randomly mixes similar students across the groups:
x <- read.table(“Roster.txt”, header = TRUE)
b <- block(x, id.vars = “name”, block.vars = “semester”, n.tr = 10)
a <- assignment(b)
If we needed to remix the groups for some reason, recalling the third line would do so. We then created a table in LATEX, defining the column names along the way, and dropped the table into our presentation slides to display the groups to the students in class moments later:
outTeX(a, namesCol = paste(‘Group’, 1:10, sep = ‘’))
We could have created a .csv file just as easily by simply replacing the letters TeX with CSV. Table 1 shows a set of sample anonymized team assignments similar to those we brought to class.
Sample Groups for Team-Based Project, 38 Students Balanced by Semester

Although these teams were from one to four members smaller than those sometimes recommended (Michaelsen et al. 2008), we found them to be large enough to marshal sufficient intellectual resources to learn from and succeed in the activities.
Evaluating Our Teams
After creating the groups, we can evaluate the success of the procedure by examining the diversity of our teams on semester of enrollment. Our core question throughout is: “Did our procedure produce groups that were more balanced by semester than we would expect from a random allocation of students, ignoring their semester?” As demonstrated here using our actual class data, the procedure did produce teams that were much better balanced. Using data from another class as well as simulated data, the next section of this article demonstrates that this advantage still holds when an instructor includes more student measures.
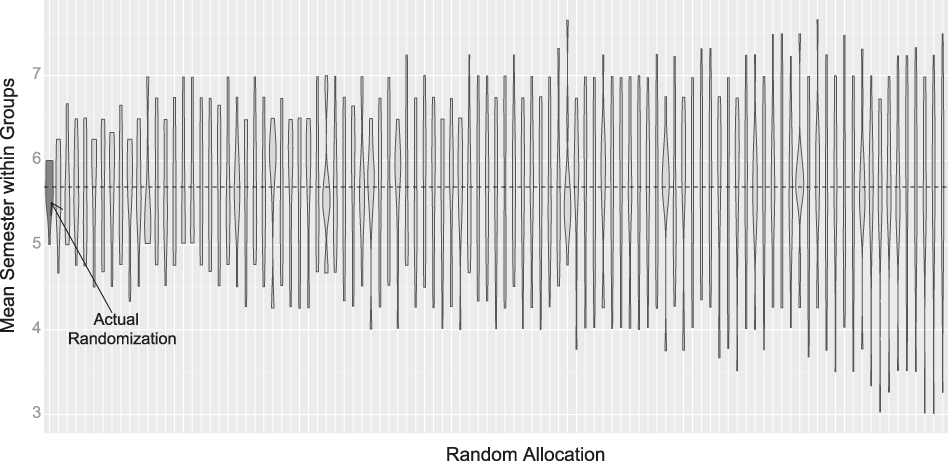
We begin by evaluating the teams as created.Footnote 3 If the teams were well-balanced, we should observe similar mean semesters across the 10 teams. In fact, we do: every team’s average semester was between five and six, a range equal to one. The more variation we observe in team averages, the less evenly composed they were. To contextualize the group averages we obtained, we compared them to those we observe under 1,000 random allocations of our 38 students to teams. Of the 1,000 random allocations, only 4 had ranges of group averages of one or less. For our implemented randomization and the first 100 random allocations, figure 1 displays the group means. The actual randomization had the smallest range of means and compared favorably to the next-tightest range displayed (about 1.6)—as well as to the least-balanced groups displayed on the right side of the figure, with a range of 4.25. An F-test yielded no evidence against the null hypothesis of equal means across the actual groups, producing a test statistic of less than 0.1.
Of course, when we actually implemented a team-based exercise in class, we encountered real-world hurdles, which we overcame by using a mix of formal and commonsense informal solutions.
Distributions of Group Means for Randomization Using our Procedure (Dark Gray) and 100 Random Allocations that Ignore Semester
Our procedure yields groups with the least spread in group means. Allocations are sorted by their ranges; the dotted black line is the overall mean semester of about 5.7
Of course, when we actually implemented a team-based exercise in class, we encountered real-world hurdles, which we overcame by using a mix of formal and commonsense informal solutions. First, some students did not attend the class meeting; therefore, certain groups were smaller than expected. In the extreme case, one student was left with no team members and therefore was assigned quickly (i.e., in class and without analysis of the group distributions of students’ semesters of enrollment) to another undersized team. Second, because two students shared a last name, we created a variable appending the first initial to the last name after reading the roster. We then used that variable as our identification variable to create the teams. Third, a colleague encountered another complication wherein the lecture class was divided into “labs” of different sizes. In this case, to obtain teams of equal size across labs, the instructor created separate groups for each lab, thereby generating fewer teams in smaller labs. To accomplish this, we simply would use a different value of the n.tr argument, calling the block( ) function separately for each lab, as shown here:
b <- block(x, id.vars = “name”, block.vars = “semester”, n.tr = 3)
for a lab with three groups, or:
b <- block(x, id.vars = “name”, block.vars = “semester”, n.tr = 4)
for a lab with four groups. Finally, for long-term learning teams, students who change labs or join a course after teams are created must be integrated. As in the case of absentees for single-meeting teams, these students may need to be added to undersized teams with less formal consideration for their background measures.
Despite spontaneous adjustments in the policy-making application, the distribution across groups still compared favorably to what we would expect had we randomly allocated four students to each team, ignoring their semester of enrollment. As implemented, the teams retained the excellent balance of the originally formed teams; that is, an F test of different means in at least two groups and a Kruskal-Wallis (KW) test of different medians in at least two groups both yielded p-values greater than 0.999.
INCORPORATING BINARY AND CONTINUOUS COVARIATES
In our application, the roster we used incorporated only one discrete, ordered category into the team design. This section demonstrates that whether we use binary or continuous measures or one or many measures, our procedure continues to produce more balance across the teams than would be expected from a simple random allocation of the students that ignored their background data. We now consider a running example with a classroom of 24 students to be divided into 6 teams of 4 students each.
Designs with One Binary Measure
Suppose we have one binary measure for each student (e.g., gender). If we use complete randomization to create the groups, some groups may have four men and others four women. If students are drawn from a large pool of half men and half women, we would expect that about  ${2 \over {{2^4}}} \approx 13\%$ of all randomly created groups would have all men or all women. Creating a single team of 4 from an evenly divided class of 24 students many times, we would expect about
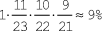 $1 \cdot {{11} \over {23}} \cdot {{10} \over {22}} \cdot {9 \over {21}} \approx 9\%$ of randomly created groups to be all men or all women.
Dividing our hypothetical class into six groups, an instructor would want to avoid outcomes such as “one team is all men” and ensure that all six teams are divided evenly, with two men and two women in each team. However, we still want to use a straightforward, random procedure. To what degree can we avoid this problem and improve heterogeneity within our small random groups while also retaining the advantages of a scalable, randomized procedure?
Incorporating the gender data into our procedure yields far fewer undesirable divisions than purely random allocation. We simulate 1,000 class divisions under both purely random allocation and the technique we employed previously. When we incorporate the covariate into the procedure, 100% of the 1,000 classes have all six teams evenly divided between men and women. By contrast, only about 2% of the 1,000 random allocations have all groups equally divided.
It is possible that the random allocation was not as unfavorable as these results suggest—perhaps a few of the classes were perfectly divided but we still avoided having groups of all men or all women. Unfortunately, this was not the case. About 39% of our purely random allocations had at least one group composed of all men or all women.
Designs with Two Covariates
Suppose that we collect a second measure for each student—for example, whether he or she is a first- or second-year student. Now we have two binary measures for each student that we can incorporate into the design. To do so, we need only add this covariate into the block.vars argument of block( ), as in the following:
b <- block(..., block.vars = c(“gender”, “year”), ...)
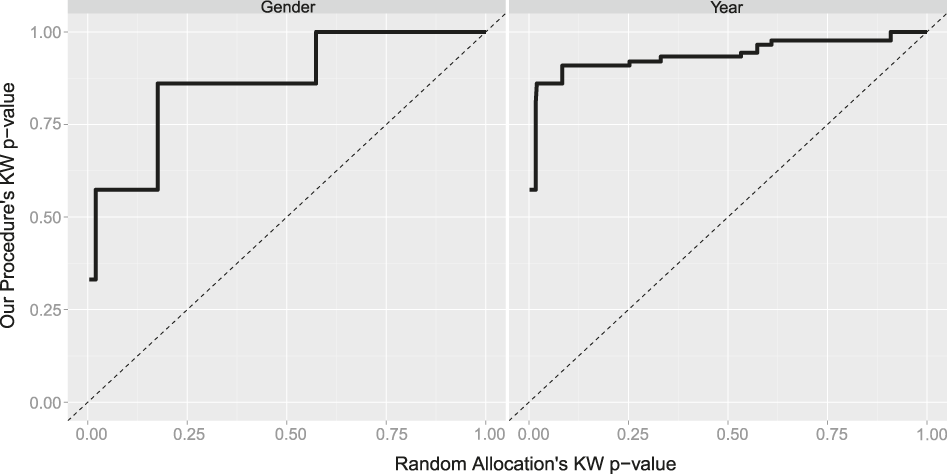
When we divide our class of 24 into teams, we again obtain better balance on both measures across groups than if we randomly allocated students. Figure 2 shows the quantile-quantile (QQ) plots of the KW p-values for the two binary variables. At every quantile, the p-value from our procedure is greater than that for the corresponding random allocation, which indicates better balance from our procedure.
QQ Plots of Balance on Two Binary Variables: Gender and Year
Axes display ranked KW p-values; if procedures were equivalent, the thick solid line would correspond to dotted y = x. Instead, our procedure produces better balance at all points in the distribution
When we used only gender, our procedure balanced it perfectly. Introducing a second covariate that is treated as if it is as important as the first means that we may give up some balance on gender to gain balance across the groups on year. Indeed, when we incorporated only gender, 100% of the 1,000 classes had all six groups evenly divided between men and women. After adding year to the procedure, about 42% of the 1,000 classes have all six teams evenly divided between men and women. The left panel in figure 2 reflects this value via the fraction of its y-values equal to 1. However, this loss of balance on gender is still much better than what we obtain when we randomly allocated students to teams: only about 1% of the 1,000 classes have all groups equally divided between men and women. If instructors value balance on gender substantially more than balance on year, our procedure allows them to give that variable more weight directly. For example, the argument weight can be specified as follows:
b <- block(..., block.vars = c(“gender”, “year”), weight = c(.8, .2)).
Designs with More Continuous Measures
When there is additional relevant information about students, we can incorporate it into team design as well. Alternative strategies for creating groups often are limited by how many student attributes can be incorporated (Christodoulopoulos and Papanikolaou 2007) or by how much time is required to incorporate more attributes. Conversely, our technique incorporates many factors just as easily as a few. There is no difficulty in scaling up the number or type of attributes; we need only to add these factors to the block.vars argument of the block( ) command, as described above. Indeed, the block( ) command is quite flexible. For example, an instructor can tailor the balancing algorithm by providing covariate weights, by calculating team heterogeneity in several ways, or by setting allowable ranges for differences on given characteristics.
To move beyond the sometimes-sparse data provided by a registrar, an instructor may need to survey the students directly. A colleague who teaches an undergraduate political methodology course asks students about prior experience in math and statistics, computer skills, anxiety about the course, and gender, and then incorporates those factors using our procedure to create teams. Given the nature of the course, this instructor weights mathematical experience and computational skills more highly than other variables. If implementing our procedure with equal variable weights sacrifices too much balance on an important variable, the instructor can adjust the weights and reallocate the students. The instructor can do this in good faith because the goal is to implement heterogeneous groups on several dimensions, not to estimate a population parameter.
While here we seek to leverage research tools to improve teaching, the relationship may be reciprocal: that is, learning new skills to improve teaching may expose instructors to techniques that enhance their research.
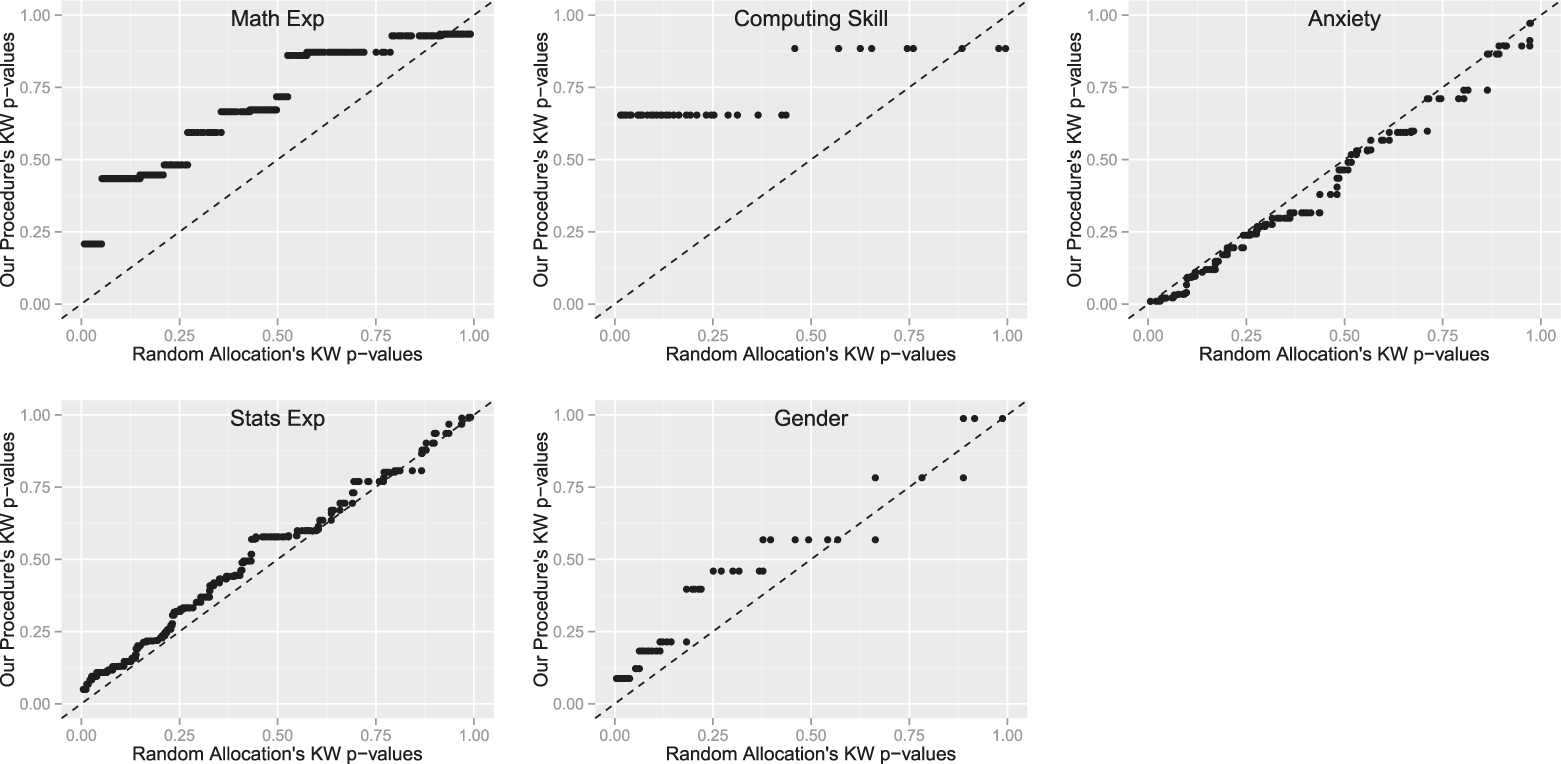
Using the largest lab in this methodology class of 41 students as an example, figure 3 illustrates the advantage of applying our procedure with several variables to assign teams. Each panel compares balance across groups from 1,000 random allocations to the balance from 1,000 assignments that incorporate math experience, computing skill, anxiety about the course, statistics experience, and gender, which are allotted weights of 0.5, 0.2, 0.1, 0.1, and 0.1, respectively. In each QQ plot panel in figure 3, points above y = x indicate better balance on a variable in the assignments that use the covariates. As expected, given these relative weights, we observe the most improvement over random allocation in mathematics experience and computing skill; however, statistics experience and gender also appear to be better balanced than would be expected from random allocation.
QQ Plots of Balance on Five Variables from Political Methodology Course
Axes display ranked KW p-values; points above dotted y = x indicate better balance on a characteristic when all characteristics are included in the assignment procedure
Beyond this application, we simulated other data representing quantities with a variety of distributional forms. Specifically, we drew variables from normal, log-normal, and binomial distributions to simulate, for example, a pretest score out of 100, the number of miles a student travels from home to school, and a count of correct answers from a 10-question political knowledge survey. We added these variables to our simulated measures of gender and year and find the same pattern of results on these five variables as when we assigned the political methodology class to teams. That is, as measured by the KW or F p-value, the teams created by taking into account the characteristics are better balanced at every quantile than the purely random allocations. As in the two-variable case, treating all five variables equally can sacrifice some balance on any one, but our procedure outperforms random allocation. Specifically, on the gender measure, about 19% of the 1,000 classes have all six teams evenly divided between men and women using our procedure. By contrast, under random allocation, only about 2% of the 1,000 classes have all groups equally divided between men and women.
DISCUSSION
Although we focus on creating teams for in-class exercises, political scientists also have developed templates for team-based learning outside of the classroom through conducting exit polls (Berry and Robinson Reference Berry and Robinson2012) and debates (Boeckelman, Deitz, and Hardy 2008), writing research papers (King Reference King2006), engaging in simulations (Asal and Blake Reference Asal and Blake2006), and mobilizing voters (Bennion Reference Bennion2006). We agree with other scholars that lectures can be replaced productively by other ways of spending class time (Bligh Reference Bligh1998; Cooper and Robinson Reference Cooper and Robinson2000). At the same time, we note that lectures may outperform some versions of active learning (e.g., debates) on some measures of student outcomes (Omelicheva and Avdeyeva Reference Omelicheva and Avdeyeva2008). Lectures also can satisfy particular intellectual and motivational goals, such as introducing newer scholarship or political events into a textbook-based course (Svinicki and McKeachie Reference Svinicki and McKeachie2011). By keeping reasonably low the implementation costs of engaging modes of learning (Glazier Reference Glazier2011), our goal is to encourage instructors to use or experiment with team-based work. Concrete, scalable techniques for implementing team-based work can encourage this experimentation.
Our strategy for encouraging experimentation uses a common research tool for nonresearch ends (Jackson Reference Jackson2013; Moore and Reeves Reference Moore and Reeves2011). By integrating research tools and social-scientific research results into the classroom, both scholarship and pedagogical practice stand to gain (King and Sen Reference King and Sen2013). While here we seek to leverage research tools to improve teaching, the relationship may be reciprocal: that is, learning new skills to improve teaching may expose instructors to techniques that enhance their research.
ACKNOWLEDGMENTS
The author thanks Jacob Montgomery and Hadi Sahin for helpful comments on previous drafts, and Joseph DeLorenzo, Taeyong Park, Chris Pope, Hadi Sahin, and Joel Sievert for assistance in implementing the team-based activities described in this article.