



1. Introduction
It is basic textbook knowledge that turbulent flow realisations are not repeatable whereas statistics over many realisations of a turbulent flow are (Tennekes & Lumley Reference Tennekes and Lumley1972). This well-known empirical observation suggests the presence of some kind of chaotic attractor. The pioneering work of Lorenz has shown the presence of chaos and strange attractors and their resulting high sensitivity to initial conditions in nonlinear systems with a small number of degrees of freedom (Lorenz Reference Lorenz1963; Sparrow Reference Sparrow2012). Deissler (Reference Deissler1986) demonstrated that similar extreme sensitivity to initial conditions is also present in fully developed turbulent solutions of the Navier–Stokes equation which is a nonlinear system with a very large number of degrees of freedom, in fact asymptotically infinite with increasing Reynolds number. High sensitivity to initial conditions is at the root of non-repeatability and therefore uncertainty. Uncertainty is present in a wide range of nonlinear systems with many degrees of freedom such as turbulent flows, magnetohydrodynamics (Ho, Armua & Berera Reference Ho, Armua and Berera2020) and plasma physics (Cheung & Wong Reference Cheung and Wong1987) and is also at the core of the problem of atmospheric predictability (Lorenz Reference Lorenz1963; Leith Reference Leith1971). It may not be enough, however, to simply rely on the general concepts of chaos and strange attractors (and bifurcations) if one wants to understand uncertainty. This paper's motivation is to understand uncertainty and its growth in the case of Navier–Stokes turbulence in some physically concrete terms.
The solutions of the Navier–Stokes equation are velocity and pressure fields which evolve in time. The uncertainty of a time-dependent velocity field  $\boldsymbol {u}^{(1)} (\boldsymbol {x},t)$ is measured by its difference from a velocity field
 $\boldsymbol {u}^{(2)} (\boldsymbol {x},t)$ with near-identical initial conditions: the velocity difference between these two fields at time
 $t$ is
 $\Delta \boldsymbol {u}\equiv \boldsymbol {u}^{(2)}-\boldsymbol {u}^{(1)}$. Based on this velocity-difference field, the average uncertainty in the system is measured in terms of its kinetic energy as
 $\langle E_{\varDelta }\rangle \equiv \langle |\Delta \boldsymbol {u}|^{2}/2\rangle$, where
 $\langle \boldsymbol{\cdot } \rangle$ represents spatial average (over
 $\boldsymbol {x}$). In the presence of a strange attractor, its chaotic nature is expected to lead to exponential growth of the difference between two fields initially very close together (Deissler Reference Deissler1986; Ruelle Reference Ruelle1981), i.e.
 \begin{equation} \frac{{\rm d}}{{\rm d}t}\left\langle E_{\varDelta}\right\rangle=2\lambda\left\langle E_{\varDelta}\right\rangle, \end{equation}
where  $\lambda$ is the maximal Lyapunov exponent.
To evaluate the Lyapunov exponent in the case of statistically stationary homogeneous turbulence, Ruelle (Reference Ruelle1979) argued that when the two fields  $\boldsymbol {u}^{(1)}$ and
 $\boldsymbol {u}^{(2)}$ differ initially only at the very smallest scales, then
 $\lambda ^{-1}$ should be the Kolmogorov time scale
 $\tau _{\eta }$, i.e.
 $\lambda ^{-1} \sim \tau _{\eta }\equiv (\nu /\varepsilon )^{1/2}$ where
 $\nu$ is the fluid's kinematic viscosity and
 $\varepsilon$ is the turbulence dissipation rate. Kolmogorov equilibrium
 $\varepsilon \sim U^{3}/L$ for statistically stationary homogeneous turbulence implies
 $\lambda \sim \tau _{\eta }^{-1} \sim (L/U)^{-1} {Re}^{1/2}$ in terms of the large eddy turnover time
 $L/U$ and the Reynolds number
 ${Re}=UL/\nu$ where
 $U$ is the root-mean-square (r.m.s.) turbulence velocity and
 $L$ the integral length scale. Intermittency corrections have been considered in the form
 $\lambda \sim (L/U)^{-1} {Re}^{a}$ where
 $a=0.459$ instead of
 $0.5$ (Crisanti et al. (Reference Crisanti, Jensen, Vulpiani and Paladin1993) derived this correction on the basis of a multi-fractal model). Whilst this correction agrees with numerical observations from the shell model (Aurell et al. Reference Aurell, Boffetta, Crisanti, Paladin and Vulpiani1997), neither
 $a=0.459$ nor
 $a=0.5$ agree with observations from direct numerical simulations (DNS) of Navier–Stokes statistically stationary homogeneous turbulence (Boffetta & Musacchio Reference Boffetta and Musacchio2017; Berera & Ho Reference Berera and Ho2018). In fact, the DNS results of Mohan, Fitzsimmons & Moser (Reference Mohan, Fitzsimmons and Moser2017) suggest that
 $\lambda \tau _{\eta }$ increases with Reynolds number, i.e.
 $a>0.5$, suggesting that time scales smaller than
 $\tau _{\eta }$ may be at play. Understanding the growth of uncertainty in some physically concrete terms, as stated previously, must also involve shedding some light on the scalings of the maximal Lyapunov exponent which clearly remains an open question. In fact, the question may be even more widely open as a superfast uncertainty growth may have been observed at very early times in some DNS results (Li et al. Reference Li, Ho, Berera and Feng2020). Such superfast growth is not ruled out by the rigorous constraint on the uncertainty growth derived from the Navier–Stokes equation by Li (Reference Li2014):
 $\langle E_{\varDelta }(t)\rangle /\langle E_{\varDelta }(0)\rangle \leq \exp (\sigma \sqrt {{Re}}\sqrt {t}+\sigma _{1}t)$ where
 $\sigma$ and
 $\sigma _{1}$ are the coefficients depending on the perturbations.
The difference between the velocity fields  $\boldsymbol {u}^{(1)}$ and
 $\boldsymbol {u}^{(2)}$ may be expected to grow in a way that develops differences over length scales
 $l$ larger than the very smallest scales. When this happens, one may assume (1.1) to remain valid but with a maximal Lyapunov exponent which reflects the characteristic time at length scale
 $l$, i.e.
 $\lambda ^{-1} \sim \tau _{l}\equiv E_{l}/\varepsilon$ where
 $E_l$ is the kinetic energy characterising length scale
 $l$ (Lorenz Reference Lorenz1969). It may then be natural to expect
 $\langle E_{\varDelta }\rangle \sim E_l$ (Aurell et al. Reference Aurell, Boffetta, Crisanti, Paladin and Vulpiani1997) which leads to a linear growth of
 $\langle E_{\varDelta }\rangle$ from (1.1) and
 $\lambda ^{-1} \sim E_{l}/\varepsilon$. A linear growth has been widely reported in numerical experiments using the eddy-damped quasi-normal Markovian (EDQNM) closure (Leith & Kraichnan Reference Leith and Kraichnan1972), shell models (Aurell et al. Reference Aurell, Boffetta, Crisanti, Paladin and Vulpiani1997) and DNS (Boffetta & Musacchio Reference Boffetta and Musacchio2017; Berera & Ho Reference Berera and Ho2018).
There have already been some attempts at understanding uncertainty in physically concrete terms. Boffetta et al. (Reference Boffetta, Celani, Crisanti and Vulpiani1997) investigated the growth of uncertainty in two-dimensional decaying homogeneous turbulence and found that the uncertainty growth is ruled by the error located in the positions of vortices. Mohan et al. (Reference Mohan, Fitzsimmons and Moser2017) found that much or most of the uncertainty is concentrated near vortex tubes in three-dimensional statistically stationary homogeneous turbulence and considered the possibility of local instability mechanisms reminiscent of pairing instabilities of corotating vortices as in mixing layers. Clark et al. (Reference Clark, Armua, Freeman, Brener and Berera2021, Reference Clark, Armua, Ho and Berera2022) investigated the dependence of uncertainty on spatial dimension (between two and eight) in DNS and in an EDQNM model of statistically stationary homogeneous turbulence. They found a critical dimension  $d_{c}\approx 5.88$ which is close to the dimension of maximum enstrophy production and above which the turbulence uncertainty is no longer ruled by chaoticity. From these results, Clark et al. (Reference Clark, Armua, Ho and Berera2022) speculated that vortex stretching and strain self-amplification, which are responsible for enstrophy generation, may also be important for uncertainty generation. The present paper is an effort in the direction of understanding uncertainty growth in terms of vortex stretching and compression dynamics and statistics.
In the following section we derive, from the Navier–Stokes equations, the evolution equation for the uncertainty energy  $\langle E_{\varDelta }\rangle$ in the case of periodic/homogeneous turbulence. This uncertainty equation involves three different mechanisms: internal production resulting from interactions between the strain rate and the velocity-difference field, dissipation of the velocity-difference field and external force input. We use three different DNS of forced periodic/homogeneous turbulence to study these mechanisms and in § 3 we present their numerical set-ups. Our DNS results and their analysis are presented in § 4 and we conclude in § 5.
2. Theoretical analysis of the uncertainty
In the first part of this section we derive the evolution equation for the uncertainty energy  $\langle E_{\varDelta }\rangle$ and in the second part we discuss the production of uncertainty energy.
2.1. Evolution equation of uncertainty
The reference field  $\boldsymbol {u}^{(1)}$ and the perturbed field
 $\boldsymbol {u}^{(2)}=\boldsymbol {u}^{(1)}+\Delta \boldsymbol {u}$ are both governed by the incompressible Navier–Stokes equations
 \begin{equation} \left. \begin{gathered} \frac{\partial}{\partial t}u^{(m)}_{i}+u^{(m)}_{j}\frac{\partial}{\partial x_{j}}u^{(m)}_{i}={-}\frac{\partial}{\partial x_{i}}p^{(m)}+\nu\frac{\partial^{2}}{\partial x_{j}\partial x_{j}}u^{(m)}_{i}+f^{(m)}_{i},\\ \frac{\partial}{\partial x_{i}}u^{(m)}_{i}=0, \end{gathered} \right\} \end{equation}
where  $p$ is the pressure-to-density ratio,
 $\boldsymbol {f} = (f_1, f_2, f_3)$ is the force per unit mass field and the number
 $m=1$ or
 $2$ in the superscript parentheses indicates whether the velocity/pressure field is the reference or the perturbed one. The equation for
 $\Delta \boldsymbol {u}\equiv \boldsymbol {u}^{(2)}-\boldsymbol {u}^{(1)}$ follows and is
 \begin{align} \left. \begin{gathered} \frac{\partial}{\partial t}\Delta u_{i}+u^{(1)}_{j}\frac{\partial}{\partial x_{j}}\Delta u_{i}+\Delta u_{j}\frac{\partial}{\partial x_{j}}\Delta u_{i}+\Delta u_{j}\frac{\partial}{\partial x_{j}}u^{(1)}_{i}={-}\frac{\partial}{\partial x_{i}}\Delta p+\nu\frac{\partial^{2}}{\partial x_{j}\partial x_{j}}\Delta u_{i}+\Delta f_{i},\\ \frac{\partial}{\partial x_{i}}\Delta u_{i}=0, \end{gathered} \right\} \end{align}
where  $\Delta p \equiv p^{(2)}-p^{(1)}$ and
 $\Delta \boldsymbol {f} \equiv \boldsymbol {f}^{(2)}-\boldsymbol {f}^{(1)}$ are the pressure and forcing differences, respectively. The divergence-free property of
 $\boldsymbol {u}^{(m)}$ implies that
 $\Delta \boldsymbol {u}$ is also divergence-free. Multiplying both sides of (2.2) with
 $\Delta u_{i}$, summing over
 $i=1,2,3$ and using incompressibility we obtain
 $$\begin{align}
&\frac{\partial}{\partial
t}E_{\varDelta}+\frac{\partial}{\partial
x_{j}}\left(u^{(1)}_{j}
E_{\varDelta}\right)+\frac{\partial}{\partial
x_{j}}\left(\Delta u_{j}E_{\varDelta}\right)+\Delta
u_{i}\Delta u_{j}\frac{\partial}{\partial
x_{j}}u^{(1)}_{i}\nonumber\\ &\quad ={-}\frac{\partial}{\partial
x_{i}}\left( \Delta u_{i}\Delta
p\right)+\nu\frac{\partial}{\partial
x_{j}}\left(\frac{\partial E_{\varDelta}}{\partial
x_{j}}\right)-\nu\frac{\partial \Delta u_{i}}{\partial
x_{j}}\frac{\partial \Delta u_{i}}{\partial x_{j}}+\Delta
f_{i}\Delta u_{i}. \end{align}$$
The second and third terms on the left-hand side of (2.3), as well as the first and second terms on the right-hand side, are in flux form. In the case of periodic/homogeneous turbulence, these four terms average to zero when a spatial average is applied to them, and therefore (2.3) leads to
 \begin{equation} \frac{{\rm d}}{{\rm d} t}\left\langle E_{\varDelta}\right\rangle =\left\langle P_{\varDelta}\right\rangle-\left\langle\varepsilon_{\varDelta}\right\rangle+\left\langle F_{\varDelta}\right\rangle, \end{equation}
where
 \begin{equation} P_{\varDelta}={-}\Delta u_{i}S_{ij}^{(1)}\Delta u_{j},\quad \varepsilon_{\varDelta}=\nu\frac{\partial \Delta u_{i}}{\partial x_{j}}\frac{\partial \Delta u_{i}}{\partial x_{j}}, \quad F_{\varDelta}=\Delta f_{i}\Delta u_{i} \end{equation}
and  $S_{ij}^{(1)}=(\partial u_{i}^{(1)}/\partial x_{j}+\partial u_{j}^{(1)}/\partial x_{i})/2$ is the reference field's strain rate tensor.
In periodic/homogeneous turbulence the average uncertainty energy evolves via (i) dissipation of uncertainty which always reduces uncertainty because the dissipation rate  $\varepsilon _{\varDelta }$ is always positive, (ii) external input/output of uncertainty with rate
 $F_{\varDelta }$ which depends on the force-difference field
 $\Delta \boldsymbol {f}$ and (iii) internal production of uncertainty via the production rate
 $P_{\varDelta }$. In the absence of external force difference (i.e.
 $\Delta \boldsymbol {f} = 0$), uncertainty can only grow because of internal production in which case
 $\langle P_{\varDelta }\rangle$ should be positive and greater than
 $\langle \varepsilon _{\varDelta }\rangle$.
Note that both fields  $\boldsymbol {u}^{(1)}$ and
 $\boldsymbol {u}^{(2)}$ can be taken as the reference field and we therefore must have
 $\langle P_{\varDelta }\rangle =-\langle \Delta u_{i}S_{ij}^{(1)}\Delta u_{j}\rangle =-\langle \Delta u_{i}S_{ij}^{(2)}\Delta u_{j}\rangle$ in periodic/homogeneous turbulence. Indeed, defining
 $\Delta S_{ij}=(\partial \Delta u_{i}/\partial x_{j}+\partial \Delta u_{j}/\partial x_{i})/2$, we have
 $S^{(2)}_{ij}=S^{(1)}_{ij}+\Delta S_{ij}$ and
 $\langle P_{\varDelta }\rangle =-\langle \Delta u_{i}S_{ij}^{(1)}\Delta u_{j}\rangle =-\langle \Delta u_{i}S_{ij}^{(2)}\Delta u_{j}\rangle -\langle \Delta u_{i}\Delta S_{ij}\Delta u_{j}\rangle$. Given that
 $\Delta \boldsymbol {u}$ is divergence-free, we also have
 $\Delta u_{i}\Delta S_{ij}\Delta u_{j}=\tfrac {1}{2}(({\partial }/{\partial x_{j}})(\Delta u_{j}E_{\varDelta })+({\partial }/{\partial x_{i}})(\Delta u_{i}E_{\varDelta }))$ which implies
 $\langle \Delta u_{i}\Delta S_{ij}\Delta u_{j}\rangle =0$ for periodic/homogeneous turbulence. Hence,
 $\langle P_{\varDelta }\rangle =-\langle \Delta u_{i}S_{ij}^{(1)}\Delta u_{j}\rangle =-\langle \Delta u_{i}S_{ij}^{(2)}\Delta u_{j}\rangle$.
2.2. Production of uncertainty
To consolidate the interpretation of  $P_{\varDelta }$ as internal production rate of uncertainty, we write
 \begin{equation} E_{\varDelta} + E_{{corr}}= E_{{tot}}, \end{equation}
where  $E_{{tot}}=E^{(1)}+E^{(2)}=(|\boldsymbol {u}^{(1)}|^{2}+|\boldsymbol {u}^{(2)}|^{2})/2$ and
 $E_{{corr}}=\boldsymbol {u}^{(1)}\boldsymbol{\cdot }\boldsymbol {u}^{(2)}$. Here
 $\langle E_{{tot}}\rangle$ represents the average total kinetic energy of the reference and the perturbed velocity fields. Its rate of change follows from (2.1) and is
 \begin{equation} \frac{{\rm d}}{{\rm d} t}\left\langle E_{{tot}}\right\rangle={-}\sum_{m=1}^{2}\left\langle\varepsilon^{(m)}\right\rangle+\sum_{m=1}^{2}\left\langle F^{(m)}\right\rangle, \end{equation}
where
 \begin{equation} \varepsilon^{(m)}\equiv\nu\frac{\partial u_{i}^{(m)}}{\partial x_{j}}\frac{\partial u_{i}^{(m)}}{\partial x_{j}}, \quad F^{(m)}\equiv f_{i}^{(m)}u_{i}^{(m)}. \end{equation}
If the two velocity fields  $\boldsymbol {u}^{(1)}$ and
 $\boldsymbol {u}^{(2)}$ are so perfectly correlated that they are identical, then
 $E_{{corr}} = E_{{tot}}$ and
 $E_{\varDelta }=0$. If, however, these two velocity fields are totally uncorrelated, then
 $\langle E_{{corr}}\rangle = 0$ and
 $\langle E_{\varDelta }\rangle = \langle E_{{tot}}\rangle$. The average internal production rate of uncertainty
 $\langle P_{\varDelta }\rangle$ is an internal transfer rate between
 $\langle E_{{corr}}\rangle$ and
 $\langle E_{\varDelta }\rangle$, i.e. a transfer rate from correlation to decorrelation if it is positive and from decorrelation to correlation if it is negative. Indeed, from (2.6), (2.7) and (2.4), we have
 \begin{equation} \frac{{\rm d}}{{\rm d} t}\left\langle E_{{corr}}\right\rangle={-}\left\langle P_{\varDelta}\right\rangle-\left\langle\varepsilon_{{corr}}\right\rangle+\left\langle F_{{corr}}\right\rangle, \end{equation}
where
 \begin{equation} \varepsilon_{{corr}}=\nu\frac{\partial u_{i}^{(1)}}{\partial x_{j}}\frac{\partial u_{i}^{(2)}}{\partial x_{j}}, \quad F_{{corr}}=f_{i}^{(1)}u_{i}^{(2)}+f_{i}^{(2)}u_{i}^{(1)}, \end{equation}
so that  $\langle P_{\varDelta }\rangle$ appears with opposite signs in (2.4) and in (2.9) and is absent from (2.7). If the two flows are identical, i.e.
 $\boldsymbol {u}^{(1)}=\boldsymbol {u}^{(2)}$, then
 $P_{\varDelta }=\varepsilon _{\varDelta }=F_{\varDelta }=0$, and if they are totally uncorrelated, then
 $\langle P_{\varDelta } \rangle = \langle \varepsilon _{{corr}} \rangle = \langle F_{{corr}} \rangle = 0$.
According to (2.4), the evolution of the average uncertainty energy depends on the reference field via its strain rate tensor in the uncertainty production term. The incompressible Navier–Stokes evolution of the strain rate tensor is given by
 \begin{equation} \frac{\partial}{\partial t}S_{ij}+u_{k}\frac{\partial}{\partial x_{k}}S_{ij}={-}S_{ik}S_{kj}- \frac{1}{4}\big(\omega_{i}\omega_{j}-\delta_{ij}\left|\boldsymbol{\omega}\right|^{2}\big)-P_{ij}+\nu\frac{\partial^{2}}{\partial x_{j}\partial x_{j}}S_{ij}+F_{ij}, \end{equation}
where  $\boldsymbol {\omega } \equiv \boldsymbol {\nabla }\times \boldsymbol {u}$ is the vorticity,
 $\delta _{ij}$ is the Kronecker delta,
 $P_{ij} \equiv \partial ^{2}p/\partial x_{i}\partial x_{j}$ is the pressure Hessian tensor and
 $F_{ij} \equiv (\partial f_{i}/\partial x_{j}+\partial f_{j}/\partial x_{i})/2$. The first and second terms in the right-hand side of (2.11) represent strain self-amplification and vortex-stretching, respectively. They enhance the flow's strain rate once and where it is non-negligibly present, whereas the pressure Hessian induces its initial growth where it is negligibly small but contributes less to its further development (Paul, Papadakis & Vassilicos Reference Paul, Papadakis and Vassilicos2017). Therefore, the internal production of uncertainty can be related to the strain self-amplification and vortex-stretching as speculated by Clark et al. (Reference Clark, Armua, Ho and Berera2022) in their conclusion, but also to the pressure Hessian. In (2.11)
 $F_{ij}$ represents the influence of the external forcing on the strain rate tensor. If the external forcing and its spatial gradients are not zero but there is no force difference in the system, i.e.
 $\Delta \boldsymbol {f}=0$ and, therefore,
 $F_{\varDelta }=0$, then there is no direct external generation or depletion of uncertainty in (2.4) but the external forcing does nevertheless influence the strain rate tensor's evolution because of
 $F_{ij}$ in (2.11) and thereby indirectly influences the evolution of the internal production of uncertainty in (2.4).
The presence of the strain rate tensor in the internal uncertainty production reveals the critical and opposing roles of compression and stretching motions in the generation and reduction of uncertainty. Using the principal axes of  $S^{(1)}_{ij}$ (or
 $S^{(2)}_{ij}$) as a local orthonormal reference frame, we can write
 \begin{equation} P_{\varDelta}={-}\left(\varLambda^{(1)}_{1}\Delta w_{1}^{2}+\varLambda^{(1)}_{2}\Delta w_{2}^{2}+\varLambda^{(1)}_{3}\Delta w_{3}^{2}\right) , \end{equation}
where  $\varLambda ^{(1)}_{1}$,
 $\varLambda ^{(1)}_{2}$ and
 $\varLambda ^{(1)}_{3}$ are the eigenvalues of
 $S^{(1)}_{ij}$ and
 $\Delta w_{1}$,
 $\Delta w_{2}$ and
 $\Delta w_{3}$ are the components of the velocity-difference vector projected on the corresponding principal axes. Incompressibility forces
 $S_{ij}^{(1)}$ to be traceless, i.e.
 $\varLambda ^{(1)}_{1}+\varLambda ^{(1)}_{2}+\varLambda ^{(1)}_{3}=0$. Defining the order of eigenvalues as
 $\varLambda ^{(1)}_{1}\leq \varLambda ^{(1)}_{2}\leq \varLambda ^{(1)}_{3}$, we must have
 $\varLambda ^{(1)}_{1}<0$ representing local compression and
 $\varLambda ^{(1)}_{3}>0$ representing local stretching (Ashurst et al. Reference Ashurst, Kerstein, Kerr and Gibson1987), while the sign of intermediate eigenvalue is uncertain but has been found to most likely be positive in DNS of turbulent flows (Ashurst et al. Reference Ashurst, Kerstein, Kerr and Gibson1987). The important point which can now be made on the basis of (2.12) is that uncertainty is always produced in the compressive direction (
 $\varLambda ^{(1)}_{1}<0$) and always attenuated in the stretching direction (
 $\varLambda ^{(1)}_{3}>0$). In the absence of external input of uncertainty, the growth of average uncertainty energy can only occur through compression events, and only if compression overwhelms stretching in
 $\langle P_{\varDelta } \rangle$ and determines its sign. Spontaneous decorrelation of a flow from its perturbed flow in the absence of external inputs of uncertainty can only occur through local compressions.
3. Numerical set-ups
To study the growth of average uncertainty energy in periodic/homogeneous turbulence, we use a fully de-aliased pseudo-spectral code to perform DNS of forced incompressible Navier–Stokes turbulence in a periodic box of size  $\mathcal {L}^{3}=(2{\rm \pi} )^{3}$. Time advancement is achieved with a second-order Runge–Kutta scheme. The code strategy is detailed by Vincent & Meneguzzi (Reference Vincent and Meneguzzi1991). In all our simulations, the number of grid points is
 $N^{3}=512^{3}$ and the spatial resolution
 $\langle k_{max}\eta \rangle _{t}$ (see the definition in the caption of table 1) is between 1.6 and 1.7. The time step is calculated by the Courant–Friedrichs–Lewy (CFL) condition and the CFL number is
 $0.4$. We first generate a reference field and copy it but generate randomly the velocity field in the perturbed wavenumber range to create the perturbed flow at a time which we refer to as
 $t_{0}=0$, i.e.
 $\boldsymbol {u}^{(2)}(\boldsymbol {x},t_{0})$. In Fourier space,
 $\hat {\boldsymbol {u}}^{(2)}(\boldsymbol {k},t_0)$ in each wavevector has six components:
 \begin{equation} \hat{\boldsymbol{u}}^{(2)}(\boldsymbol{k},t_{0})=\left( \begin{array}{@{}c@{}} u_{x_{0}}^{(2)}(\boldsymbol{k}){\rm e}^{{\rm i}\phi_{x_{0}}(\boldsymbol{k})}\\ u_{y_{0}}^{(2)}(\boldsymbol{k}) {\rm e}^{{\rm i}\phi_{y_{0}}(\boldsymbol{k})}\\ u_{z_{0}}^{(2)}(\boldsymbol{k}) {\rm e}^{{\rm i}\phi_{z_{0}}(\boldsymbol{k})} \end{array}\right), \end{equation}
which follow three constraints.
(i) Incompressibility:
(3.2) \begin{equation} \imath\boldsymbol{k}\boldsymbol{\cdot }\hat{\boldsymbol{u}}^{(2)}(\boldsymbol{k},t_{0})=0. \end{equation}
(ii) The initial energy spectra of the reference flow and the perturbed flow are identical:
(3.3)\begin{align} \hat{E}^{(1)}(k,t_{0})=\int_{\left|\boldsymbol{k}\right|=k}\frac{\left|\hat{\boldsymbol{u}}^{(1)}(\boldsymbol{k},t_{0})\right|^{2}}{2}\,\mathrm{d}^{2}\boldsymbol{k} =\int_{\left|\boldsymbol{k}\right|=k}\frac{\left|\hat{\boldsymbol{u}}^{(2)}(\boldsymbol{k},t_{0})\right|^{2}}{2} \,\mathrm{d}^{2}\boldsymbol{k}=\hat{E}^{(2)}(k,t_{0}). \end{align}(iii) The difference initially only exists in the smallest scales, i.e.
$|\boldsymbol {k}|\geq k_{0}$ where $k_{0}=0.9k_{max}$ and $k_{max} = N/3$ is the maximum resolvable wavenumber after de-aliasing (see, however, Appendix A for different perturbed wavenumber ranges):
(3.4)\begin{equation} \hat{\boldsymbol{u}}^{(2)}(\boldsymbol{k},t_0)=\left\{ \begin{array}{@{}ll} \hat{\boldsymbol{u}}^{(1)}(\boldsymbol{k},t_0), & \text{if } \left|\boldsymbol{k}\right|< k_{0},\\ \text{Randomly generated}, & \text{if } \left|\boldsymbol{k}\right|\geq k_{0}. \end{array}\right.\end{equation}


For the generation of  $\hat {\boldsymbol {u}}^{(2)}(\boldsymbol {k},t_0)$ in the perturbed wavenumber range, these three constraints a priori couple all the
 $\hat {\boldsymbol {u}}^{(2)}(\boldsymbol {k},t_0)$ on the sphere of Fourier space such that
 $|\boldsymbol {k}|=k$. For simplicity of implementation, we use a version of (3.3) restricted to each
 $\boldsymbol {k}$, such that the sum of the resulting
 $\hat {\boldsymbol {u}}^{(2)}(\boldsymbol {k},t_0)$ over
 $|\boldsymbol {k}|=k$ verifies (3.3). This means that for each wavevector
 $\boldsymbol {k}$ we compute six random values, three moduli and three phases
 $[u_{x_{0}}^{(2)}(\boldsymbol {k}),u_{y_{0}}^{(2)}(\boldsymbol {k}),u_{z_{0}}^{(2)}(\boldsymbol {k}),\phi _{x_{0}}(\boldsymbol {k}), \phi _{y_{0}}(\boldsymbol {k}),\phi _{z_{0}}(\boldsymbol {k})] \in [0,\sqrt {2\hat {E}^{(1)}}(k,t_{0})]^3 \times [0,2{\rm \pi} )^3$ that follow two constraints coming from the real and imaginary part of the incompressibility condition (3.2) and one constraint from the spectrum (3.3). This means that only three independent components have to be drawn and the three others will follow.
(a) In the general case of
$k_x\ne 0$, $k_y\ne 0$ and $k_z\ne 0$, two uniform random numbers are drawn in $[0,1)$ yielding $\phi _{x_{0}}(\boldsymbol {k})$ and $\phi _{y_{0}}(\boldsymbol {k})$ after rescaling and one uniform random number in $[0,1)$ yielding $u_{x_{0}}^{(2)}(\boldsymbol {k})$ after rescaling. The moduli $u_{y_{0}}^{(2)}(\boldsymbol {k})$ and $u_{z_{0}}^{(2)}(\boldsymbol {k})$ are successively computed using (3.3). The sine and the cosine of the phase $\phi _{z_{0}}(\boldsymbol {k})$ are finally computed using the real and imaginary part of the incompressibility condition (3.2), respectively.(b) In the case where only one component of the wavevector is equal to zero: the modulus and the phase in the direction of the zero component of the wavevector are drawn first uniformly from
$[0,\sqrt {2\hat {E}^{(1)}}(k,t_{0})]\times [0,2{\rm \pi} )$. The two other moduli are computed using (3.3), one phase is drawn from $[0,2{\rm \pi} )$ and the other is deduced from incompressibility.(c) In the case where two components of the wavevector are equal to zero: the real and imaginary parts of incompressibility impose that the modulus of the corresponding component of
$\hat {\boldsymbol {u}}^{(2)}$ is zero, and that the corresponding phase is irrelevant. As a consequence, out of the four remaining values to be determined, one is constrained by (3.3). In practice, the two remaining phases are drawn uniformly in $[0,2{\rm \pi} )^2$, one modulus is drawn uniformly in $[0,\sqrt {2\hat {E}^{(1)}}(k,t_{0})]$ and the other is determined using (3.3).


Parameters of the reference flows:  $\langle \boldsymbol{\cdot }\rangle$ represents the spatial average;
 $\langle \boldsymbol{\cdot }\rangle _{t}$ represents the temporal average;
 $\langle \!\langle \boldsymbol{\cdot }\rangle \!\rangle _{t}$ represents the average in both space and time;
 $N$ is the resolution of the simulations,
 $\nu$ is the kinematic viscosity,
 $\varepsilon$ is the dissipation;
 $U\equiv \sqrt {2\langle E\rangle /3}$ is the r.m.s. velocity;
 $L\equiv (3{\rm \pi} /4\langle E\rangle )\int k^{-1}\hat {E}(k)\,\textrm {d}k$ is the integral length scale;
 $T_{0}\equiv L/U$ is the large eddy turnover time;
 ${Re}\equiv UL/\nu$ is the Reynolds number;
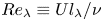 ${Re}_{\lambda }\equiv Ul_{\lambda }/\nu$ is the Reynolds number defined by the Taylor length scale
 $l_{\lambda }\equiv \sqrt {10\langle E\rangle \nu /\langle \varepsilon \rangle }$;
 $k_{max}$ is the maximum resolvable wavenumber; and
 $\eta \equiv (\nu ^{3}/\langle \varepsilon \rangle )^{1/4}$ is the Kolmogorov scale.

In this way, the initial perturbations, defined as  $\Delta \boldsymbol {u}(\boldsymbol {x},t_{0})=\boldsymbol {u}^{(2)}(\boldsymbol {x},t_{0})-\boldsymbol {u}^{(1)}(\boldsymbol {x},t_{0})$, are also incompressible and exist only in the perturbed wavenumber range. Furthermore, the perturbed flow is generated randomly in its perturbed wavenumber range, hence the reference flow and the perturbed flow are initially completely decorrelated in this wavenumber range, which implies
 \begin{equation} \hat{E}_{\varDelta}(k,t_{0})=\int_{\left|\boldsymbol{k}\right|=k}\frac{\left|\Delta\hat{\boldsymbol{u}}(\boldsymbol{k},t_{0})\right|^{2}}{2}\mathrm{d}^{2}\boldsymbol{k}=\left\{ \begin{array}{@{}ll} 0, & \text{if } \left|\boldsymbol{k}\right|< k_{0}, \\ \hat{E}_{{tot}}(k,t_{0}), & \text{if } \left|\boldsymbol{k}\right|\geq k_{0}, \end{array}\right. \end{equation}
where  $\hat {E}_{{tot}}(k,t_{0})=\hat {E}^{(1)}(k,t_{0})+\hat {E}^{(2)}(k,t_{0})$.
Three different cases (F1, F2 and F3) are simulated by applying different external forcings and initial conditions. In the first case, labelled F1, a negative damping forcing is applied to both the reference and the perturbed turbulent fields and the force-difference field does not vanish. The forcing function is divergence-free as it depends on the low wavenumber modes of the velocity in Fourier space as follows:
 \begin{equation} \hat{\boldsymbol{f}}^{(m)}\left(\boldsymbol{k},t\right)=\left\{ \begin{array}{@{}ll} \dfrac{\varepsilon_{0}}{2E_{f}^{(m)}}\hat{\boldsymbol{u}}^{(m)}\left(\boldsymbol{k},t\right), & \text{if } 0<\left|\boldsymbol{k}\right|\leq k_{f},\\ 0, & \text{otherwise}, \end{array}\right. \end{equation}
where  $\hat {\boldsymbol {f}}$ and
 $\hat {\boldsymbol {u}}$ are the Fourier transforms of
 $\boldsymbol {f}$ and
 $\boldsymbol {u}$, respectively,
 $\varepsilon _{0}$ is the preset average turbulence dissipation rate and
 $E_{f}$ is the kinetic energy contained in the forcing bandwidth
 $0<|\boldsymbol {k}|\leq k_{f}$. This forcing has been widely used to simulate statistically steady homogeneous isotropic turbulence (HIT) on the computer (Boffetta & Musacchio Reference Boffetta and Musacchio2017; Mohan et al. Reference Mohan, Fitzsimmons and Moser2017; Berera & Ho Reference Berera and Ho2018; Ho et al. Reference Ho, Armua and Berera2020; Clark et al. Reference Clark, Armua, Freeman, Brener and Berera2021, Reference Clark, Armua, Ho and Berera2022). It offers the advantage of setting the average turbulence dissipation a priori for statistically steady turbulence. In the present work, we set
 $\varepsilon _{0}=0.1$ and
 $k_{f}=2.5$.
To generate the reference flow we use a von Kármán initial energy spectrum with the same coefficients as Yoffe (Reference Yoffe2012) and random initial Fourier phases. We integrate the reference flow until it reaches a statistically steady state and then seed it with perturbations to create the perturbed flow at a time which we refer to as  $t_{0}=0$. One can see from (3.6) that the external forcings are determined separately by the two fields and, therefore,
 $\Delta \boldsymbol {f} \neq 0$. F1 is the only one of our three cases where
 $F_{\varDelta }$ is not identically zero and some uncertainty is introduced by the forcing in (2.4).
The case F2 is identical to F1 except for the external forcing which is such that  $F_{\varDelta }=0$. The forcing in the perturbed field is determined by the velocity in the reference field as
 \begin{equation} \hat{\boldsymbol{f}}^{(2)}\left(\boldsymbol{k},t\right)=\hat{\boldsymbol{f}}^{(1)}\left(\boldsymbol{k},t\right)=\left\{ \begin{array}{@{}ll} \dfrac{\varepsilon_{0}}{2E_{f}^{(1)}}\hat{\boldsymbol{u}}^{(1)}\left(\boldsymbol{k},t\right), & \text{if } 0<\left|\boldsymbol{k}\right|\leq k_{f},\\ 0, & \text{otherwise}, \end{array}\right. \end{equation}
where  $\varepsilon _{0}=0.1$ and
 $k_{f}=2.5$. Therefore, there is no forcing difference between the two fields and all the uncertainty in (2.4) is generated exclusively by the internal production.
The case F3 differs in one essential way from F1 and F2: rather than force the turbulence into a stationary steady state and then introduce the uncertainty after stationarity has set in (as in F1 and F2), in F3 we introduce the uncertainty well before stationarity has set in, i.e. at the very initial time when the initial velocity field has very little energy and the simulation starts running with a forcing which eventually brings the turbulence into an energetic stationary state. We chose a forcing for F3 that is independent of the velocity field to ensure steady buildup of the turbulence during a long yet finite time. The initial velocity fields are randomly generated with the same energy spectrum  $\hat {E}(k)= 0.3\times 10^{-4}k^{-1}$ for the reference and the perturbed fields and the initial perturbations are seeded in the high-wavenumber Fourier phases in the exact same way as in F1 and F2. Both flows are forced by an identical single-mode divergence-free force
 \begin{equation} \boldsymbol{f}^{(2)}\left(\boldsymbol{x},t\right)=\boldsymbol{f}^{(1)}\left(\boldsymbol{x},t\right)=\left( \begin{array}{@{}c@{}} \cos\left(k_{0}y\right)\sin\left(k_{0}z\right)\\ \cos\left(k_{0}z\right)\sin\left(k_{0}x\right)\\ \cos\left(k_{0}x\right)\sin\left(k_{0}y\right) \end{array}\right), \end{equation}
where  $k_{0}=4$. This forcing differs from F1 but is similar to F2 in that
 $F_{\varDelta }$ identically vanishes and there is no uncertainty input from the forcing in (2.4). We repeat, however, that the main distinguishing feature of F3 compared with F1 and F2 is that, in F3, the reference and the perturbed fields are statistically non-stationary during their initial growth (driven by the forcing) and the concurrent initial growth of uncertainty. This non-stationarity affects (2.4) through the resulting non-stationarity of the strain rate field in the internal production rate.
In summary, F1 is the case that is widely used in previous works (Boffetta & Musacchio Reference Boffetta and Musacchio2017; Mohan et al. Reference Mohan, Fitzsimmons and Moser2017; Berera & Ho Reference Berera and Ho2018; Ho et al. Reference Ho, Armua and Berera2020; Clark et al. Reference Clark, Armua, Freeman, Brener and Berera2021, Reference Clark, Armua, Ho and Berera2022) and F2 differs from it only in terms of  $\Delta \boldsymbol {f}$ which is zero in F2 and non-zero in F1. In both F1 and F2 the perturbation is made to a fully developed statistically stationary turbulence whereas in F3 we follow the evolution of two velocity fields which are initially very weak in terms of energy and very close to each other, i.e. very highly correlated. Both flows are progressively intensified by the same spatially sinusoidal time-independent forcing field and evolve towards statistical stationary fully developed turbulence while, at the same time, diverging from each other.
The main parameters characterising the reference flows are given in table 1 where  $\langle \boldsymbol{\cdot }\rangle$ represents the spatial average,
 $\langle \boldsymbol{\cdot }\rangle _{t}$ represents the temporal average and
 $\langle \!\langle \boldsymbol{\cdot }\rangle \!\rangle _{t}$ represents the average in both space and time. For F1 and F2, this time average is over all time
 $t\ge 0$ when the reference and perturbed fields are statistically stationary in the simulations. For F3, the time average is over the time when the reference flow's turbulent kinetic energy and dissipation rate are statistically stationary, i.e. the standard deviations of
 $\langle E^{(1)}\rangle (t)$ and
 $\langle \varepsilon ^{(1)}\rangle (t)$ are smaller than
 $8\,\%$ of
 $\langle \!\langle E^{(1)}\rangle \!\rangle _{t}$ and
 $\langle \!\langle \varepsilon ^{(1)}\rangle \!\rangle _{t}$, respectively. This leads to
 $\tau \equiv t/\langle T_{0}^{(1)} \rangle _{t}\in [9.4,30.0]$. (Note that the dimensionless time
 $\tau \equiv t/\langle T_{0}^{(1)} \rangle _{t}$ is defined for all three cases F1, F2 and F3.)
4. DNS results
In this section we present our DNS results concerning (2.4), starting in § 4.1 with the time evolution of  $\langle E_{\varDelta } \rangle$ during the decorrelation process and an analysis of the three mechanisms at play and of the uncertainty's energy spectrum. In § 4.2 we relate the growth rate of
 $\langle E_{\varDelta } \rangle$ to detailed properties of the production and dissipation of uncertainty, of the strain rate eigenvalues and of the distribution of uncertainty energy in the three principal axes of the strain rate tensor. In particular, we derive the chaotic exponential growth of
 $\langle E_{\varDelta } \rangle$ from similarity behaviours of these quantities. In § 4.3 we go beyond the average production of uncertainty and report probability density functions (p.d.f.s) of
 $P_{\varDelta }$.
4.1. Time evolution of uncertainty
4.1.1. Uncertainty energy
Figure 1 shows the time evolutions of  $\langle E_{\varDelta }\rangle$ for each case F1, F2 and F3. The very first thing that happens immediately after the perturbations are seeded is a decrease of
 $\langle E_{\varDelta }\rangle$ in all three cases. This initial correlating action is caused by the concentration of the initial perturbations at the highest wavenumbers where dissipation is high. The insets of figure 2 show that
 $\langle \varepsilon _{\varDelta } \rangle$ is orders of magnitude higher than
 $\langle P_{\varDelta } \rangle$ at the earliest times in all three cases. As time proceeds, the uncertainty's dissipation rate decreases and its production rate increases until production overtakes dissipation (see figure 2) and
 $\langle E_{\varDelta }\rangle$ begins to grow. This initial growth is shown in the insets of figure 1 and it differs for F1 and F2 on the one hand and F3 on the other. For F1 and F2,
 $\langle E_{\varDelta }\rangle$ is observed to grow exponentially in the approximate time range
 $\tau \in [0.2,2.9]$. Previous DNS studies have already observed such exponential growth (Boffetta & Musacchio Reference Boffetta and Musacchio2017; Berera & Ho Reference Berera and Ho2018). For F3, the initial growth is from
 $\tau \approx 2.5$ to
 $\tau \approx 12.6$ and is subdivided in two parts. In the time range
 $\tau \in [2.5,7.5]$, the turbulence and its strain rate are not statistically stationary and the time evolution of
 $\langle E_{\varDelta }\rangle$ is not exponential. Indeed, the plot of the logarithm of
 $\langle E_{\varDelta }\rangle$ vs time in the inset of figure 1(c) has a positive curvature in that time range. An exponential growth of
 $\langle E_{\varDelta }\rangle$ appears to set in at
 $\tau \approx 7.5$ and lasts until about
 $\tau \approx 12.6$. It is noteworthy that an exponential growth of uncertainty also exists in F3 and that it starts a little earlier than when stationarity sets in. (The exponential regime's time range is longer for F3 than for F1 and F2 mainly because of F3's lower Reynolds number as argued in Appendix B). The results and analysis in the remainder of this paper confirm these interpretations.
Time evolutions of average uncertainty energy for different cases: (a) case F1; (b) case F2; (c) case F3; (d) comparison F1–F2. Inset: the initial time evolution of average uncertainty energy in semilogarithmic plot. The uncertainty evolutions of F1 and F2 are presented together in (d). Inset: the uncertainty evolutions during  $\tau \in [2.9,6.5]$. The exponential of exponential function fit is indicated by a solid black line.

Time evolutions of each term in (2.4) for different cases, where  $\varepsilon _{{tot}}=\varepsilon ^{(1)}+\varepsilon ^{(2)}$ is the total dissipation of the reference and perturbed fields: (a) case F1; (b) case F2; (c) case F3. Inset: the initial time evolution of the internal production, dissipation and external input/output in semilogarithmic plot.

The growths of  $\langle E_{\varDelta }\rangle$ are identical in F1 and F2 (see figure 1d) until the time when
 $\langle F_{\varDelta }\rangle$ becomes significantly non-zero in F1 (see figure 2a). The regime of exponential growth is followed by what appears to be an exponential of exponential regime from
 $\tau \approx 2.9$ to
 $\tau \approx 6.5$. This exponential of exponential growth is the same in F1 and F2 and is highlighted by the fit in the inset of figure 1(d). A similar growth range has been observed in previous DNS that are similar to F1 and go up to even higher Reynolds numbers (Boffetta & Musacchio Reference Boffetta and Musacchio2017; Berera & Ho Reference Berera and Ho2018). This exponential of exponential growth is confirmed by our analysis and further DNS results in § 4.2.
After time  $\tau =6.5$, the uncertainty growths for F1 and F2 deviate from each other as shown in figure 1(d) (
 ${|\langle E_{\varDelta }\rangle _{F1}-\langle E_{\varDelta }\rangle _{F2}|}/{\langle E_{\varDelta }\rangle _{F1}}>5\,\%$ and growing as
 $\tau$ grows above
 $6.5$) because
 $\langle F_{\varDelta }\rangle$ starts growing significantly above zero (
 $\langle F_{\varDelta }\rangle /\langle \varepsilon _{\varDelta }\rangle =0.06$ at
 $\tau =6.5$) in F1 whereas it is identically zero in F2 for all time (see figure 2). The reference and perturbed fields achieve significant decorrelation after the exponential growth of
 $\langle E_{\varDelta }\rangle$ for both F1 and F2, resulting, in case F1, in non-zero values of
 $\langle F_{\varDelta }\rangle$ which eventually grow significantly above the reference field's turbulence dissipation rate, but only after
 $\tau =6.5$. The additional external decorrelating action of the forcing leads to eventually fully decorrelated reference and perturbed fields in case F1 as the ratio
 $\langle E_{\varDelta }\rangle /\langle E_{{tot}}\rangle$ stops growing and saturates at
 $0.97\pm 0.07$ after
 $\tau =10.6$. In case F2 the identical forcing in both fields acts as a perpetual partially correlating (rather than decorrelating) action of the two fields and to a resulting eventual saturation of
 $\langle E_{\varDelta }\rangle /\langle E_{{tot}}\rangle$ at
 $0.59\pm 0.05$ for
 $\tau \ge 8.9$. In Appendix A we provide evidence showing that the early and mid-time evolutions (i.e. the exponential regime and the exponential of exponential regime) of the average uncertainty energy are not very sensitive to the form and amplitude of the initial perturbations.
For case F3, the growth of  $\langle E_{\varDelta }\rangle$ following the exponential regime ending at about
 $\tau \approx 12.6$ can be seen in figure 1(c) and cannot be fitted by the exponential of exponential function detected in cases F1 and F2 nor any clear linear or power-law growth functions. As in F2, the correlating action of the identical external forcing in both the reference and perturbed fields leads to them remaining partially correlated at all times and to an eventual saturation of
 $\langle E_{\varDelta }\rangle /\langle E_{{tot}}\rangle$ at
 $0.66\pm 0.01$ for
 $\tau \ge 25.3$.
We close this subsection by pointing out that the only case of linear growth that we may have detected in our DNS is for F1 in the time range  $\tau \in [6.5,10.6]$. A linear growth regime has been predicted by Aurell et al. (Reference Aurell, Boffetta, Crisanti, Paladin and Vulpiani1997), however our simulations suggest that it may depend on the type of forcing. Furthermore, the Reynolds number of our DNS may not be high enough to observe it clearly and the very level of Reynolds number required may itself depend on the external forcing. We examine this issue again in the following subsections. The time ranges of the different uncertainty growth regimes in each case F1, F2 and F3 are summarised in table 2.
Time ranges of different uncertainty growth regimes.

4.1.2. Mechanisms of the uncertainty evolution
The time evolutions of each term in (2.4), including the growth rate  $\textrm {d}\langle E_{\varDelta }\rangle /\textrm {d}t$ obtained directly from the DNS, are shown in figure 2. As can be seen in the figure, we started by checking that
 $\textrm {d}\langle E_{\varDelta }\rangle /\textrm {d}t$ agrees well with its value obtained from (2.4). In all cases F1, F2 and F3,
 $\langle P_{\varDelta }\rangle > \langle \varepsilon _{\varDelta }\rangle$ when
 $\textrm {d}\langle E_{\varDelta }\rangle /\textrm {d}t >0$. In cases F2 and F3 where
 $\langle F_{\varDelta }\rangle = 0$ at all times, the eventual saturation when
 $\textrm {d}\langle E_{\varDelta }\rangle /\textrm {d}t \approx 0$ is characterised by the balance
 $\langle P_{\varDelta }\rangle \approx \langle \varepsilon _{\varDelta }\rangle$. This balance reflects the long-time partial correlation between the reference and perturbed fields and the long-time saturation of
 $\langle E_{\varDelta }\rangle /\langle E_{{tot}}\rangle$ at a value smaller than 1 reported in the previous subsection.
We also observe in figure 2 for all cases F1, F2 and F3 that the long-time saturation is such that  $\langle \varepsilon _{\varDelta }\rangle \approx \langle \varepsilon _\textrm {tot}\rangle \equiv \langle \varepsilon ^{(1)}+\varepsilon ^{(2)}\rangle$ which implies
 $\langle \varepsilon _{{corr}}\rangle \approx 0$. In cases F2 and F3, this means that the long-time saturated non-zero steady state of
 $\langle P_{\varDelta }\rangle$ is such that
 $\langle P_{\varDelta }\rangle \approx \langle \varepsilon ^{(1)}+\varepsilon ^{(2)}\rangle \approx \langle F^{(1)}+F^{(2)}\rangle$ (recall
 $\langle F_{\varDelta }\rangle =0$ and
 $\langle F_{{corr}} \rangle =0$ in F2 and F3): the correlating action by the identical forcing in both statistically stationary reference and perturbed fields is directly balanced by the decorrelating action of the internal production of uncertainty.
The uncertainty dissipation rate  $\langle \varepsilon _{\varDelta }\rangle$ reaches its long-time asymptotic balance with
 $\langle \varepsilon _{{tot}}\rangle$, i.e.
 $\langle \varepsilon _{\varDelta }\rangle /\langle \varepsilon _{{tot}}\rangle >0.95$, at about
 $\tau = 16.1$ for F3 and at about
 $\tau = 5.6$ for both F1 and F2. This is slightly before but close to the time
 $\tau = 6.5$ when
 $\langle F_{\varDelta }\rangle /\langle \varepsilon _{\varDelta }\rangle =0.06$ stops being negligible in F1 and the perturbation evolutions start diverging between F1 and F2. The presence of positive
 $\langle F_{\varDelta }\rangle$ in F1 delays the decay towards
 $0$ of
 $\textrm {d}\langle E_{\varDelta }\rangle /\textrm {d}t$ which is reached at about
 $\tau = 10.6$ for F1 but
 $\tau = 8.9$ for
 $F2$. In the case of
 $F1$ one might even argue that an approximate steady state has resulted for
 $\textrm {d}\langle E_{\varDelta }\rangle /\textrm {d}t$ between
 $\tau =6.5$ and
 $\tau = 10.6$, the time range corresponding to the linear growth regime perhaps observed in figure 1(a) for F1 and also in some previous DNS (Boffetta & Musacchio Reference Boffetta and Musacchio2017; Berera & Ho Reference Berera and Ho2018). After
 $\tau = 10.6$,
 $\langle P_{\varDelta }\rangle$ oscillates around zero, corresponding to the saturation of
 $\langle E_{\varDelta }\rangle /\langle E_{{tot}}\rangle$ at a value
 $0.97\pm 0.07$ in figure 1(a). This reflects the total decorrelation between the F1 reference and perturbed fields and leads to a long-time saturation balance
 $\langle F_{\varDelta }\rangle \approx \langle \varepsilon _{\varDelta } \rangle$ in F1 which is to be contrasted with
 $\langle P_{\varDelta }\rangle \approx \langle \varepsilon _{\varDelta } \rangle$ in F2 and F3. Note that the long-time saturation is such that
 $\langle F_{{corr}}\rangle \approx 0$ and
 $\langle F_{\varDelta }\rangle \approx \langle F^{(1)}+F^{(2)}\rangle$ in all cases, including F1. Hence, the long-time saturation balance between
 $\langle F_{\varDelta }\rangle$ and
 $\langle \varepsilon _{\varDelta }\rangle$ in case F1 simply reflects
 $\langle \varepsilon _{{tot}}\rangle \approx \langle F^{(1)}+F^{(2)}\rangle$.
In figure 3 we concentrate on the time evolution of the production–dissipation ratio  $\langle P_{\varDelta }\rangle /\langle \varepsilon _{\varDelta }\rangle$ in all three cases F1, F2 and F3. As highlighted in the insets of this figure's plots, there is, in all three cases, a time range when
 $\langle P_{\varDelta }\rangle /\langle \varepsilon _{\varDelta }\rangle$ is about constant, i.e. a time range when the evolutions of
 $\langle P_{\varDelta }\rangle$ and
 $\langle \varepsilon _{\varDelta }\rangle$ are similar. In all three cases this time range includes the time range of exponential growth of
 $\langle E_{\varDelta }\rangle$ identified in the previous subsection; in fact, in case F3 it more or less exactly coincides with it. To be specific,
 $\langle P_{\varDelta }\rangle /\langle \varepsilon _{\varDelta }\rangle =1.61\pm 0.03$ from
 $\tau = 0.6$ to
 $\tau = 2.5$ for F1 and F2, and
 $\langle P_{\varDelta }\rangle /\langle \varepsilon _{\varDelta }\rangle =1.61\pm 0.08$ from
 $\tau = 7.2$ to
 $\tau = 12.8$ for F3. These two values are very close (and the additional case F4 in Appendix B returns a similar value for
 $\langle P_{\varDelta }\rangle /\langle \varepsilon _{\varDelta }\rangle$ in F4's similarity regime), indicating that the similarity value of the production–dissipation ratio
 $\langle P_{\varDelta }\rangle /\langle \varepsilon _{\varDelta }\rangle$ might be universal and independent of Reynolds number, as the presence of a strange attractor might perhaps imply.
Time evolutions of ratio  $\langle P_{\varDelta }\rangle /\langle \varepsilon _{\varDelta }\rangle$ for different cases: (a) case F1; (b) case F2; (c) case F3. Inset: the evolution of the ratio in the time range of the exponential growth of the average uncertainty.

4.1.3. Uncertainty spectrum
The uncertainty dissipation rate is the integral over all wavenumbers  $k$ of
 $k^{2} \hat {E}_{\varDelta }(k)$ where
 $\hat {E}_{\varDelta }(k)$ is the uncertainty spectrum, i.e. the energy spectrum of the velocity difference field. The similarity in the evolutions of uncertainty production and dissipation rates raises the question whether the uncertainty spectrum evolves in some self-similar manner over the time range of that similarity. We answer this question in terms of the integral length scale of the velocity-difference fields considered here which is
 $L_{\varDelta }=(3{\rm \pi} /4\langle E_{\varDelta }\rangle )\int k^{-1}\hat {E}_{\varDelta }(k)\,\textrm {d}k$ (see Batchelor (Reference Batchelor1953) for an introduction to this length scale for any statistically homogeneous/periodic velocity field). Here
 $L_{\varDelta }$ is a measure of the length over which the velocity difference field is correlated, i.e. a characteristic length scale of uncertainty containing eddies.
Soon after the initial decay of  $\langle E_{\varDelta } \rangle$, the uncertainty spectra collapse with
 $\langle E_{\varDelta } \rangle (t)$ and
 $L_{\varDelta } (t)$ at wavenumbers larger than
 $2/L_{\varDelta }$ as shown in figure 4, i.e.
 $\hat {E}_{\varDelta }(k,t) = \langle E_{\varDelta }\rangle L_{\varDelta }\, f(kL_{\varDelta })$ for
 $kL_{\varDelta }\ge 2$, where
 $f$ is a dimensionless function of dimensionless wavenumber. At wavenumbers
 $kL_{\varDelta } < 1$ the energy spectra have an approximately power-law dependence on
 $k$ but do not collapse until soon after the time when the exponential growth of
 $\langle E_{\varDelta } \rangle (t)$ and the uncertainty's production–dissipation similarity (
 $\langle P_{\varDelta }\rangle /\langle \varepsilon _{\varDelta }\rangle \approx 1.6- 1.7$) sets in. Over the time range when
 $\langle P_{\varDelta }\rangle /\langle \varepsilon _{\varDelta }\rangle \approx 1.6- 1.7$, the uncertainty spectrum is self-similar, i.e. evolves as
 $\hat {E}_{\varDelta }(k,t) = \langle E_{\varDelta } \rangle L_{\varDelta }\, f(kL_{\varDelta })$ for all wavenumbers (see figure 5). The peak of the spectrum is at
 $k\approx 2/L_{\varDelta }$ in all three cases F1, F2 and F3. At wavenumbers below
 $2/L_{\varDelta }$ the uncertainty spectra have an approximately
 $k^{3.3}$ power law shape, while at wavenumbers above
 $2/L_{\varDelta }$, they appear to have an exponential shape. Similar uncertainty spectrum shapes have been found in a previous DNS study (Berera & Ho Reference Berera and Ho2018).
Early time evolution of uncertainty energy spectrum for different cases: (a) case F1; (b) case F2; (c) case F3. The spectra are normalised by  $\langle E_{\varDelta }\rangle$ and
 $L_{\varDelta }$.

Uncertainty energy spectra for cases (a) F1, (b) F2 and (c) F3 in the similarity regime. The spectra are normalised by  $\langle E_{\varDelta }\rangle$ and
 $L_{\varDelta }$. Inset: semilogarithmic plot of the uncertainty spectra in the wavenumber range higher than
 $2/L_{\varDelta }$. The collapse of the normalised uncertainty spectra for cases F1, F2 and F3 in the similarity regime is shown in (d).

It is remarkable that the uncertainty spectrum is self-similar in case F3 in the exact same way that it is self-similar in cases F1 and F2 over the time range where  $\langle P_{\varDelta }\rangle /\langle \varepsilon _{\varDelta }\rangle$ is approximately constant. In fact, the self-similar uncertainty spectrum even seems to be the same for F3, F1 and F2 as seen by the collapse in figure 5(d), suggesting a universal shape for the self-similar uncertainty spectrum in HIT. This is remarkable not only because
 $F3$ has a very different Reynolds number and forcing than F1 and F2, but more importantly because the F3 reference field is not statistically stationary in that time range whereas the F1 and F2 reference fields are. In the F3 case, the uncertainty spectrum reaches its self-similar state at
 $\tau \approx 5.8$ and the reference field becomes statistically stationary at
 $\tau =9.4$.
After the time range where  $\langle P_{\varDelta }\rangle /\langle \varepsilon _{\varDelta }\rangle$ is approximately constant, the uncertainty spectrum is no longer self-similar (see figure 6). This happens at
 $\tau =3.5$ for cases F1 and F2 and at
 $\tau =12.6$ for case F3 when
 $\hat {E}_{\varDelta }(k_{max})/\hat {E}_{{tot}}(k_{max})>0.95$. These are the times when the reference and perturbed fields decorrelate at the largest resolvable wavenumber (see figure 6). The process of decorrelation between the two fields proceeds by decorrelating them at progressively smaller wavenumbers, causing the uncertainty spectrum to collapse with the reference field's energy spectrum over a progressively wider range of the higher wavenumbers (see figure 6). This progressive decorrelation process from high to small wavenumbers and the uncertainty spectrum's progressive convergence towards the reference field's spectrum prevents the uncertainty spectrum from being self-similar. For F1, the uncertainty spectrum finally collapses with the reference field's energy spectrum at all wavenumbers, indicating that the two fields eventually decorrelate completely at all wavenumbers (see figure 6a). The same happens for F2 and F3 except over the wavenumbers acted by the forcing where a gap always remains between the uncertainty and the reference field spectra, indicating that the two fields retain a degree of correlation at these large scales (see figures 6b and 6c).
Uncertainty spectra (dashed lines) for different cases after the times when the reference and perturbed fields decorrelate at the largest resolvable wavenumber: (a) case F1; (b) case F2; (c) case F3. The uncertainty spectra are normalised by  $\langle E_{{tot}}\rangle$. The dots on the uncertainty spectra represent
 $k=2/L_{\varDelta }$. The solid line represents the energy spectrum of the reference field when it is statistically steady. The energy spectrum is normalised by
 $\langle E^{(1)}\rangle$. The uncertainty spectrum shifts gradually along with the arrows representing the direction of time advance.

4.1.4. Characteristic length of uncertainty
The growth of  $L_{\varDelta }$ is evident in figure 6. We therefore plot its time evolution in figure 7 and compare it with the integral and Taylor length scales (
 $L$ and
 $l_{\lambda }$, respectively) of the reference field for each case F1, F2 and F3. At the very early times when uncertainty dissipation dominates, the velocity-difference field decays and its integral length scale normalised by
 $L$ is, correspondingly, increasing. In the stationary turbulence F1 and F2 cases, this time regime is followed by the chaotic regime where
 $\langle E_{\varDelta }\rangle$ grows exponentially and where
 $L_{\varDelta }/l_{\lambda }^{(1)}$ remains relatively constant at
 $0.38\pm 0.01$. A constant
 $L_{\varDelta }/l_{\lambda }^{(1)}$ (though a different constant,
 $L_{\varDelta }/l_{\lambda }^{(1)} = 0.64\pm 0.03$) is also observed in the non-stationary F3 case during the chaotic regime even though
 $l_{\lambda }^{(1)}$ grows in time for some of that regime and even though this time regime does not follow immediately after the dissipation-dominated regime. In fact,
 $L_{\varDelta }$ decreases between the dissipation-dominated and the chaotic regime in the F3 case. It is noteworthy that
 $L_{\varDelta }$ reaches
 $l_{\lambda }^{(1)}$ at
 $\tau =4.9$ for cases F1 and F2 and at
 $\tau =14.5$ for case F3, a little before the average uncertainty dissipation rate reaches its stationary value in figure 2, i.e.
 $\tau \approx 5.6$ for F1 and F2 and
 $\tau \approx 16.1$ for F3. The link between
 $L_{\varDelta }$ and the Taylor length of the reference field is potentially interesting as the Taylor length is the mean distance between stagnation points in a HIT (Goto & Vassilicos Reference Goto and Vassilicos2009) and therefore tends to represent the average size of turbulent eddies which is highly weighted towards the more numerous smallest ones.
Time evolution of  $L_{\varDelta }/l_{\lambda }^{(1)}$ for different cases: (a) case F1; (b) case F2; (c) case F3. Inset: time evolution of
 $L_{\varDelta }/L^{(1)}$. The time evolutions of
 $L_{\varDelta }/l_{\lambda }^{(1)}$ in cases F1 and F2 are plotted together in (d).

Following the exponential growth of  $\langle E_{\varDelta }\rangle$, three consecutive time regimes follow for F1 and F2. First, one observes an approximately power-law growth of
 $L_{\varDelta }$, identical for both F1 and F2 as shown in figure 7(d), more or less coinciding with the exponential of exponential growth of
 $\langle E_{\varDelta }\rangle$ until
 $\tau =6.5$. In this time regime,
 $L_{\varDelta }\sim t^{3/2}$ is a good fit. This fit is reminiscent of the power-law growth of the predictability scale
 $k_{E}^{-1}\sim t^{3/2}$ obtained in previous numerical simulations (Leith & Kraichnan Reference Leith and Kraichnan1972; Boffetta & Musacchio Reference Boffetta and Musacchio2017) and theoretical arguments (Lorenz Reference Lorenz1969; Frisch Reference Frisch1995; Boffetta & Musacchio Reference Boffetta and Musacchio2017), as a companion conclusion to the linear growth of
 $\langle E_{\varDelta }\rangle$. However,
 $L_{\varDelta }$ and
 $k_{E}^{-1}$ are not equivalent: the predictability scale is defined as the inverse of the minimum wavenumber
 $k_E$ such that
 $\widehat {E_{\varDelta }}(k_{E})/\hat {E}_{{tot}}(k_{E})=1$, and
 $k_{E}^{-1}\sim t^{3/2}$ is obtained on the assumption that the decorrelation process happens in the inertial range. Here
 $L_{\varDelta }\sim t^{3/2}$ is observed without concurrent linear growth of
 $\langle E_{\varDelta }\rangle$ but a concurrent exponential of exponential
 $\langle E_{\varDelta }\rangle$ growth instead.
The second consecutive regime which follows for F1 and F2 is an apparently linear growth of  $L_{\varDelta }$ that lasts until the time when
 $L_{\varDelta }$ saturates to a constant. The third and final regime is this approximately constant
 $L_{\varDelta }$ regime where
 $L_{\varDelta }\approx L^{(1)}$ for F1 (see figure 7a) in agreement with the eventual complete decorrelation of the reference and perturbed fields and where
 $L_{\varDelta }\approx (0.70\pm 0.06)L^{(1)}$ (smaller than
 $L^{(1)}$) for F2 (see figure 7b) in agreement with the eventual partial correlation between these two fields in this case.
In the F3 case, the chaotic regime where  $\langle E_{\varDelta }\rangle$ grows exponentially and
 $L_{\varDelta }/l_{\lambda }^{(1)} = 0.64\pm 0.03$ is followed by an intermediate regime where
 $L_{\varDelta }$ grows to eventually reach the final constant regime where
 $L_{\varDelta } = (0.81\pm 0.03) L^{(1)}$ (smaller than
 $L^{(1)}$) characterising the final saturation (see figure 7c). As for F2, the fact that
 $L_{\varDelta }$ is significantly lower than
 $L$ in the eventual saturation regime reflects the partial long-time correlation imposed by the identical forcing in the reference and perturbed fields.
4.2. Quantitative analysis of the uncertainty growth
4.2.1. From similarity to exponential growth
When  $\langle F_{\varDelta } \rangle$ is identically zero (as in F2 and F3) or negligibly small compared with
 $\langle P_{\varDelta }\rangle$ and
 $\langle \varepsilon _{\varDelta }\rangle$ (as in F1 for
 $\tau$ smaller than about
 $6.5$) the evolution equation for
 $\langle E_{\varDelta } \rangle$ becomes
 \begin{equation} \frac{{\rm d}}{{\rm d} t}\left\langle E_{\varDelta}\right\rangle=\left\langle P_{\varDelta}\right\rangle-\left\langle \varepsilon_{\varDelta}\right\rangle. \end{equation}
To estimate  $\langle P_{\varDelta }\rangle$ in terms of
 $\langle E_{\varDelta }\rangle$ and obtain an equation of the same form as (1.1), we apply a Reynolds decomposition to (2.12) and write
 \begin{equation} \left\langle P_{\varDelta}\right\rangle={-}\sum_{i=1}^{3}\left\langle\varLambda^{(1)}_{i}\Delta w_{i}^{2}\right\rangle=\underbrace{-\sum_{i=1}^{3}\left\langle\varLambda^{(1)}_{i}\right\rangle\left\langle\Delta w_{i}^{2}\right\rangle}_{\left\langle P_{\varDelta}\right\rangle_{{Ave}}}\underbrace{-\sum_{i=1}^{3}\left\langle\varLambda_{i}^{(1)\prime}\Delta {w_{i}^{2}}^{\prime}\right\rangle}_{\left\langle P_{\varDelta}\right\rangle_{{Fluc}}}, \end{equation}
where  $\varLambda _{i}^{(1)\prime } \equiv \varLambda ^{(1)}_{i}-\langle \varLambda ^{(1)}_{i}\rangle$ and
 $\Delta {w_{i}^{2}}^{\prime } \equiv \Delta w_{i}^{2}-\langle \Delta w_{i}^{2}\rangle$. In all cases F1, F2 and F3, and at times after the similarity regime, the first term on the right-hand side of (4.2) dominates over the second term and contributes the most to
 $\langle P_{\varDelta }\rangle$ (see figure 8). During the part of the similarity regime when
 $\langle E_{\varDelta }\rangle$ grows exponentially,
 $\beta \equiv \langle P_{\varDelta }\rangle _{{Ave}}/\langle P_{\varDelta }\rangle$ is constant in time and so is
 $1-\beta =\langle P_{\varDelta }\rangle _{{Fluc}}/\langle P_{\varDelta }\rangle$ (see the insets of figure 8):
 $\beta$ is a constant equal to
 $0.53\pm 0.02$ for F1 and F2 and equal to a slightly different value
 $0.66\pm 0.02$ for F3 where the Taylor length-based Reynolds number is significantly lower than for F1 and F2. One may indeed expect the fluctuation contribution
 $\langle P_{\varDelta }\rangle _{{Fluc}}$ to increase in magnitude with increasing Reynolds number relative to the mean contribution
 $\langle P_{\varDelta }\rangle _{{Ave}}$ in (4.2), and
 $\beta$ to therefore be a decreasing function of Reynolds number.
Time evolution of  $\langle P_{\varDelta }\rangle$ and its decomposition into average and fluctuation parts for different cases: (a) case F1; (b) case F2; (c) case F3. Inset: the early time evolution of the ratio of average term/total production and fluctuation term/total production.

Defining  $\gamma ^{(1)}_{i} \equiv \varLambda ^{(1)}_{i}/\sqrt {\langle |S^{(1)}_{ij}|^{2}\rangle }$ (where
 $|S_{ij}| \equiv \sqrt {S_{ij}S_{ij}}$) and
 $\theta _{i} \equiv \Delta w_{i}^{2}/2\langle E_{\varDelta }\rangle$, and using
 $\beta \equiv \langle P_{\varDelta }\rangle _{{Ave}}/\langle P_{\varDelta }\rangle$, we have
 \begin{equation} \left\langle P_{\varDelta}\right\rangle={-}2\frac{\displaystyle\sum_{i=1}^{3}\left\langle\gamma^{(1)}_{i}\right\rangle\left\langle\theta_{i}\right\rangle}{\beta}\sqrt{\left\langle\left|S^{(1)}_{ij}\right|^{2}\right\rangle}\left\langle E_{\varDelta}\right\rangle. \end{equation}
We now examine the behaviours of  $\langle \gamma ^{(1)}_{i}\rangle$ and
 $\langle \theta _{i}\rangle$.
We start with  $\langle \gamma ^{(1)}_{i}\rangle$ which, unlike
 $\beta$ and
 $\langle \theta _{i}\rangle$, are properties of the reference field and not of the velocity-difference field:
 $\langle \gamma ^{(1)}_{i}\rangle$ are the average strain rates along the principal axes of the reference field's strain rate tensor and they are plotted vs time in figure 9. Note the constraints
 $\sum _{i=1}^{3}\langle \gamma ^{(1)}_{i}\rangle =0$ and
 $\sum _{i=1}^{3}\langle \gamma _{i}^{(1)2}\rangle =1$. In cases F1 and F2, where the reference flow is statistically stationary,
 $\langle \gamma ^{(1)}_{i}\rangle$ are constant in time and
 $\langle \gamma ^{(1)}_{1}\rangle :\langle \gamma ^{(1)}_{2}\rangle :\langle \gamma ^{(1)}_{3}\rangle \approx -0.65:0.12:0.53$ in agreement with Betchov (Reference Betchov1956)'s theoretical demonstration that there must be one principal axis direction which is compressive on average and two which are on average stretching. In case F3, the reference flow is not statistically stationary until about
 $\tau = 9.4$ but
 $\langle \gamma ^{(1)}_{i}\rangle$ acquire a stable value before that and are already constant during the similarity period
 $\tau \approx 5.8$ to
 $\tau \approx 12.60$ (see figure 9c). In case F3, we observe
 $\langle \gamma ^{(1)}_{1}\rangle :\langle \gamma ^{(1)}_{2}\rangle :\langle \gamma ^{(1)}_{3}\rangle \approx -0.68:0.13:0.55$, which is very close to F1 and F2, also in agreement with the prediction of Betchov (Reference Betchov1956).
Time evolution of  $\langle \gamma _{i}\rangle$ in the reference flows for different cases: (a) case F1; (b) case F2; (c) case F3.

The average uncertainty energy  $\langle E_{\varDelta }\rangle$ consists of three average uncertainty energies
 $\langle \Delta w_{i}^{2}/2\rangle$ in the principal axes of the reference field's strain rate tensor:
 $\langle E_{\varDelta }\rangle = \sum _{i=1}^{3} \langle \Delta w_{i}^{2}/2\rangle$. The ratios
 $\langle \theta _{i}\rangle$ represent the proportion of average uncertainty energy in each principal direction and they of course sum up to 1. Their time evolution is shown in figure 10. Most of the uncertainty energy is concentrated in the compressive direction until
 $\tau \approx 8- 9$ in cases F1 and F2 and for all time in case F3, in agreement with our observation at the end of § 2.2 that the production of uncertainty occurs by compressive motions. At saturation times there is a tendency for equipartition of average uncertainty energy in the three principal directions, in particular for F1 where the reference and principal fields completely decorrelate in the long term. The tendency remains for F2 and F3 but the average uncertainty energy in the most stretching direction remains significantly below the average uncertainty energy in the other two directions thereby ensuring that
 $\langle P_{\varDelta }\rangle$ remains positive and the reference and perturbation fields remain partially correlated during eventual saturation.
Time evolution of  $\langle \theta _{i}\rangle$ for different cases: (a) case F1; (b) case F2; (c) case F3. Inset: the time evolution of
 $\langle \theta _{i}\rangle$ during the similarity regime.

In all three cases F1, F2 and F3,  $\langle \theta _{i}\rangle$ are approximately constant during the similarity regime where
 $\beta$ is also constant in time. During the similarity regime, the
 $\langle \theta _{i}\rangle$ values are
 $\langle \theta _{1}\rangle :\langle \theta _{2}\rangle :\langle \theta _{3}\rangle \approx 0.58:0.19:0.23$ for cases F1 and F2 and
 $\langle \theta _{1}\rangle :\langle \theta _{2}\rangle :\langle \theta _{3}\rangle \approx 0.59:0.18:0.23$ for case F3. The values of
 $\langle \theta _{i}\rangle$ appear to be universal during the similarity regime whereas
 $\beta$ seems to be dependent on Reynolds number.
Finally, we discuss the relation between  $\langle \varepsilon _{\varDelta }\rangle$ and
 $\langle P_{\varDelta }\rangle$. The self-similar uncertainty spectrum
 $\hat {E}_{\varDelta }(k,t) = \langle E_{\varDelta } \rangle L_{\varDelta }\, f(kL_{\varDelta })$ implies that the uncertainty dissipation is
 \begin{equation} \left\langle\varepsilon_{\varDelta}\right\rangle=2\nu\int k^{2}\hat{E}_{\varDelta}(k)\,\mathrm{d}k=2\nu\left\langle E_{\varDelta} \right\rangle L_{\varDelta}\int k^{2}f(kL_{\varDelta})\,\mathrm{d}k=2\nu\frac{\left\langle E_{\varDelta} \right\rangle}{L_{\varDelta}^{2}}\int x^{2}f(x)\,\mathrm{d}\kern0.7pt x, \end{equation}
where  $\int x^{2}f(x)\,{\textrm {d} x}$ is a time constant. Defining
 $\alpha \equiv \langle \varepsilon _{\varDelta }\rangle /\langle P_{\varDelta }\rangle$, we obtain, from (4.3) and (4.4)
 \begin{equation} \alpha={-}\left[ \frac{\beta\int_{0}^{\infty}x^{2}f(x)\,\mathrm{d} x}{\displaystyle\sum_{i=1}^{3}\left\langle\gamma^{(1)}_{i}\right\rangle\left\langle\theta_{i}\right\rangle}\right]\frac{\nu}{L_{\varDelta}^{2}\sqrt{\left\langle\left|S^{(1)}_{ij}\right|^{2}\right\rangle}}. \end{equation}
As shown previously in this subsection, the term in square brackets in (4.5) is constant in time. Figure 7(a) suggests that  $L_{\varDelta }$ and
 $l_{\lambda }^{(1)}$ have the same dependence on time but not the same dependence on viscosity. Therefore, the time dependence of
 $(L_{\varDelta }^{2}\sqrt {\langle |S^{(1)}_{ij}|^{2}\rangle })$ is the same as the time dependence of
 $((\eta ^{(1)})^{2}(\tau _{\eta }^{(1)})^{-1}{Re}^{(1)}_{\lambda })\sim {Re}^{(1)}_{\lambda }$. For cases F1 and F2, the reference field, and therefore
 ${Re}^{(1)}_{\lambda }$, are statistically steady and it therefore follows from (4.5) that
 $\alpha$ is constant in time during the similarity regime. For the same reason,
 $\alpha$ is constant in time after
 $\tau =9.4$ in the similarity regime of case F3 because this is when the reference flow reaches the statistically steady state. During
 $\tau \in [7.5,9.4]$ for F3,
 $1/{Re}^{(1)}_{\lambda }$ decreases monotonically from
 $0.0187$ to
 $0.0156$ as shown in figure 11. This
 $20\,\%$ decrease is small compared with the variations of
 $1/{Re}^{(1)}_{\lambda }$ at normalised times
 $\tau$ smaller than
 $7.5$ and results in a small decrease of
 $\alpha$ in the corresponding time period (i.e. a slow increase of
 $1/\alpha$, as shown in figure 3). Therefore,
 $\alpha$ can be considered to be approximately constant in the similarity period
 $\tau \in [7.5,12.5]$ of F3.
Time evolution of  $1/{Re}_{\lambda }$ in case F3.

We have seen at the end of § 4.1.2 and figure 3 that  $\alpha = \langle P_{\varDelta }\rangle /\langle \varepsilon _{\varDelta }\rangle$ seems to be independent of viscosity but we also noted two paragraphs above that
 $\beta$ is not. The dependencies on viscosity of
 $\beta \nu$ and
 $(L_{\varDelta }^{2}\sqrt {\langle |S^{(1)}_{ij}|^{2}\rangle })$ in (4.5) must therefore be the same and cancel each other.
Substituting (4.3) and (4.5) into (4.1), we obtain
 \begin{equation} \frac{\mathrm{d}}{\mathrm{d} t}\left\langle E_{\varDelta}\right\rangle=\varGamma\sqrt{\left\langle\left|S^{(1)}_{ij}\right|^{2}\right\rangle}\left\langle E_{\varDelta}\right\rangle, \end{equation}
where
 \begin{equation} \varGamma={-}2\frac{1-\alpha}{\beta}\sum_{i=1}^{3}\left\langle\gamma^{(1)}_{i}\right\rangle\left\langle\theta_{i}\right\rangle . \end{equation}
This is a general rewriting of (4.1) with particularly interesting consequences for the similarity regime when  $\alpha$,
 $\beta$,
 $\langle \gamma ^{(1)}_{i}\rangle$ and
 $\langle \theta _{i}\rangle$ are constant in time. The dimensionless coefficient
 $\varGamma$ defined by (4.7) is therefore constant in time during the similarity regime but may depend on Reynolds number (i.e. viscosity) via the dependence of
 $\beta$ on Reynolds number.
Looking at (4.6), an exponential growth of  $\langle E_{\varDelta } \rangle$ with a well-defined Lyapunov exponent
 $\lambda$ can be derived during the similarity regime because
 $\varGamma$ is constant in time:
 \begin{equation} 2\lambda=\varGamma\sqrt{\left\langle\left|S^{(1)}_{ij}\right|^{2}\right\rangle}=\frac{1}{\sqrt{2}}\varGamma\tau_{\eta}^{{-}1}. \end{equation}
The exponential growth of average uncertainty energy is, therefore, a consequence of similarity. How similarity (time-independent  $\alpha$,
 $\beta$,
 $\langle \theta _{i} \rangle$ and self-similar evolution of the uncertainty spectrum in terms of
 $\langle E_{\varDelta } \rangle$ and
 $L_{\varDelta }$) may be a consequence of the presence of a strange attractor is, however, beyond this paper's scope but the question is now posed for future investigations.
The dimensionless coefficient  $\varGamma$ obtained from (4.7) and the Lyapunov exponent directly obtained from (1.1) are plotted in figure 12: for all cases F1, F2 and F3,
 $\varGamma$ is about constant in the time range where exponential growth is present. The actual value of
 $\varGamma$ in this time range is the same for F1 and F2 but it is different for F3 which has a lower Reynolds number. The scaling
 $\lambda \tau _{\eta }\sim \varGamma ({Re})$ suggests that the Lyapunov exponent may not scale with the Kolmogorov time
 $\tau _{\eta }$ (as claimed by Ruelle Reference Ruelle1979) if
 $\varGamma$ depends on Reynolds number, which it may do on account of a Reynolds number dependence of
 $\beta$. The coefficient
 $\varGamma$, as well as the Lyapunov exponent, are also plotted in figure 13 to compare with previous data by Mohan et al. (Reference Mohan, Fitzsimmons and Moser2017). The ratio of
 $\varGamma$ values in the F1 and F3 cases is
 $\varGamma _{{F1}}/\varGamma _{{F3}}=1.29$ during the exponential growth time range, whereas
 $\beta _{{F3}}/\beta _{{F1}}=1.25$ in the same regime. The data of Mohan et al. (Reference Mohan, Fitzsimmons and Moser2017) lead to
 $\varGamma _{{F1}}/\varGamma _{{F3}} \approx 1.30$ purely on the basis of the Reynolds numbers of F1 and F3 (see figure 13). This confirms the hypothesis that the different values of
 $\varGamma$ in F1 and F2 on the one hand and F3 on the other are caused by the difference in Reynolds number and nothing else.
Time evolution of  $\varGamma$ and
 $2\sqrt {2}\lambda \tau _{\eta }$ for different cases: (a) case F1; (b) case F2; (c) case F3. Inset: the time evolution of
 $\varGamma$ during the similarity regime in semilogarithmic plot. The exponential function fit is indicated by a dash-dotted line for F1 and F2.

Schematic log–log plot of  $\lambda \tau _{\eta }$ with the Taylor length-based Reynolds number
 ${Re}_{\lambda }$ according to the numerical results (in blue) and models calibrated with Bayesian inference (in red) of Mohan et al. (Reference Mohan, Fitzsimmons and Moser2017). The Lyapunov exponents and the coefficient
 $\varGamma$ obtained in the present work (in green crosses and red points) are also plotted.

The regime of approximate constancy of  $\varGamma$ is followed by a time range
 $\tau \in [2.9,6.5]$ where
 $\varGamma$ appears to decay exponentially in the F1 and F2 cases (it is not clear whether such a range does or does not exist in the F3 case), see figure 12. Specifically, the exponential curve fit gives
 $\varGamma =0.73\exp (-1.26(\tau -2.9))$. Using
 $\langle E_{{tot}}\rangle$ and
 $\langle T^{(1)}\rangle _{t}$ to non-dimensionalise equation (4.6), we write
 \begin{equation} \frac{\mathrm{d} }{\mathrm{d}\tau}\frac{\left\langle E_{\varDelta}\right\rangle}{\left\langle E_{{tot}}\right\rangle}=\varGamma\left\langle T^{(1)}\right\rangle_{t}\sqrt{\left\langle\left|S^{(1)}_{ij}\right|^{2}\right\rangle}\frac{\left\langle E_{\varDelta}\right\rangle}{\left\langle E_{{tot}}\right\rangle} . \end{equation}
For statistically stationary cases F1 and F2 we find  $\langle T^{(1)}\rangle _{t}\sqrt {\langle |S^{(1)}_{ij}|^{2}\rangle }=12.77\pm 0.56$ in the time range
 $\tau \in [2.9,6.5]$. Therefore, (4.9) and our fitting of
 $\varGamma$ imply
 $\langle E_{\varDelta }\rangle /\langle E_{{tot}}\rangle \sim \exp (-9.32\exp (-1.26(\tau -2.9)))$, which is approximately consistent with the direct curve fitting in the inset of figure 1(d). Eventually
 $\varGamma$ tends to
 $0$ and the average uncertainty energy stops growing in all cases F1, F2 and F3.
4.2.2. Scaling of the Lyapunov exponent during similarity
Our analysis in § 4.2.1 and the data of (Mohan et al. Reference Mohan, Fitzsimmons and Moser2017) presented in figure 13 question the view that  $\lambda$ scales with
 $\tau _{\eta }$ (Ruelle Reference Ruelle1979). If
 $\lambda$ does not scale with
 $\tau _{\eta }$ which is the smallest Lagrangian time scale of the turbulence, it may scale with
 $\tau _{E}=\eta /U$, the shortest Eulerian time scale of the turbulence (Tennekes Reference Tennekes1975), in which case
 $\lambda \tau _{\eta }\sim \tau _{\eta }/\tau _{E}\sim {Re}_{\lambda }^{1/2}$. The data of Mohan et al. (Reference Mohan, Fitzsimmons and Moser2017) in figure 13 suggests that
 $\lambda$ grows faster than
 $\tau _{\eta }^{-1}$ but slower than
 $\tau _{E}^{-1}$ as Reynolds number increases, perhaps
 $\lambda \sim \tau _{\eta }^{-(1-c)/2}\tau _{E}^{-(1+c)/2}$, i.e.
 $\lambda \tau _{\eta }\sim {Re}_{\lambda }^{(1+c)/4}$, where
 $c\in (-1,1]$. In fact, the results of Mohan et al. (Reference Mohan, Fitzsimmons and Moser2017) suggest that
 $\lambda \tau _{\eta } \sim {Re}_{\lambda }^{(1+c)/4}$ where the most likely values of
 $c$ are between
 $0$ and
 $1/3$. The large scale random sweeping of the smallest eddies represented in the Eulerian time scale
 $\tau _E$ appears to influence the growth of uncertainty even though the uncertainty exists only at the smallest scales during the chaotic exponential growth. Interestingly, this large-scale random-sweeping effect is reflected in the decreasing dependence of
 $\beta$ on Reynolds number (see (4.7) and (4.8)) which implies that
 $\langle P_{\varDelta }\rangle$ should be increasingly dominated by
 $\langle P_{\varDelta }\rangle _{{Fluc}}$ rather than
 $\langle P_{\varDelta }\rangle _{{Ave}}$ in (4.2) as Reynolds number increases. There seems to be a relation between large-scale random sweeping and uncertainty production, and in particular between random sweeping and the way that compression and stretching affect average uncertainty production either through average compression/stretching rates or through the correlations of their fluctuations with uncertainty energy fluctuations in specific stretching/compressive directions. A Lagrangian or some combined Eulerian–Lagrangian description of uncertainty (see, e.g., Boffetta et al. Reference Boffetta, Celani, Crisanti and Vulpiani1997) as advocated by Leith & Kraichnan (Reference Leith and Kraichnan1972) in their introduction might have advantages over the present purely Eulerian approach as it may naturally account for the large-scale sweeping's effect on uncertainty and thereby return a reduced average uncertainty production. The large-scale sweeping's effect on uncertainty might also have some relation with the error in positions of local flow structures that Boffetta et al. (Reference Boffetta, Celani, Crisanti and Vulpiani1997) identified.
4.3. The probability distribution of the uncertainty production
Even though the average uncertainty production rate is positive, the most likely value of  $P_{\varDelta }$ is zero at all times. In figures 14 and 15 we plot instantaneous p.d.f.s of
 $P_{\varDelta }$ sampled through all space and we examine how these p.d.f.s evolve with time. An immediate observation is that the p.d.f.s of
 $P_{\varDelta }$ do not seem to match a well-known standard distribution (e.g. Gaussian, exponential, power-law) at any time and for any case F1, F2 and F3. Another immediate observation is that the early time p.d.f.s of
 $P_{\varDelta }$ for F3 differ from those for F1 and F2 as their tails on the negative side are much shorter than on the positive side. These are times when the F3 reference flow is not statistically stationary.
Early-time evolution of p.d.f.s of  $P_{\varDelta }$ for different cases: (a) case F1; (b) case F2; (c) case F3. P.d.f.s are plotted vs
 $P_{\varDelta }/\sigma _{P_{\varDelta }}$ where
 $\sigma _{P_{\varDelta }}$ is the standard deviation of
 $P_{\varDelta }$, defined as
 $\sigma ^{2}_{P_{\varDelta }}\equiv \int _{P_{\varDelta {min}}}^{P_{\varDelta {max}}}(P_{\varDelta }-\langle P_{\varDelta }\rangle )^{2}\mathcal {P}(P_{\varDelta })\,\mathrm {d}P_{\varDelta }$.

Evolution of p.d.f.s of  $P_{\varDelta }$ after the similarity regime for different cases: (a) case F1; (b) case F2; (c) case F3. P.d.f.s are plotted vs
 $P_{\varDelta }/\sigma _{P_{\varDelta }}$ where
 $\sigma _{P_{\varDelta }}$ is the standard deviation of
 $P_{\varDelta }$.

Given that the most likely value of  $P_{\varDelta }$ is
 $P_{\varDelta }=0$, the non-zero values of
 $\langle P_{\varDelta }\rangle$ result from the positive skewnesses and the heavy tails of these p.d.f.s (see figures 14 and 15). The positive skewness and heavy tails, i.e. high kurtosis, set in from very early times and reveal an intermittent spatial distribution of coexisting uncertainty generation and depletion events where high generation events are more intense than high depletion events.
This spatial intermittency becomes increasingly acute and increasingly favourable to uncertainty generation rather than depletion events as the skewness and the kurtosis grow to extremely high positive values which fluctuate around a constant during the chaotic exponential growth in all F1, F2 and F3 cases (see figure 16). This happens within the similarity regime where  $\alpha$,
 $\beta$ and
 $\theta _i$ are constant and the uncertainty spectrum is self-similar if scaled with
 $\langle E_{\varDelta }\rangle$ and
 $L_{\varDelta }$. In fact, as shown in figure 14, the p.d.f.s of
 $P_{\varDelta }$ also approximately collapse during the time range of extreme skewness and kurtosis if normalised by the p.d.f.'s maximum value and standard deviation. During this time range where similarity and exponential uncertainty growth coexist, the kurtosis and the skewness fluctuate around
 $10^{5}$ and
 $200$ respectively, suggesting that
 $\langle P_{\varDelta } \rangle$ is predominantly determined by rare yet powerful events of uncertainty generation and depletion.
Time evolution of the sample kurtosis and skewness of p.d.f.s for different cases, which is defined as  $K=({\int _{P_{\varDelta {min}}}^{P_{\varDelta {max}}}(P_{\varDelta }-\langle P_{\varDelta }\rangle )^{4}\mathcal {P}(P_{\varDelta })\,\mathrm {d}P_{\varDelta }})/{\sigma _{P_{\varDelta }}^{4}}$ and
 $S=({\int _{P_{\varDelta {min}}}^{P_{\varDelta {max}}}(P_{\varDelta }-\langle P_{\varDelta }\rangle )^{3}\mathcal {P}(P_{\varDelta })\,\mathrm {d}P_{\varDelta }})/{\sigma _{P_{\varDelta }}^{3}}$: (a) case F1; (b) case F2; (c) case F3.

After the similarity and chaotic growth stage, both the skewness and the kurtosis of the p.d.f.s continuously decrease with time indicating that more points in the flow participate in the uncertainty generation and depletion and in the overall value of  $\langle P_{\varDelta }\rangle$. The way these p.d.f.s lead to the average values of
 $P_{\varDelta }$ is subtle. The long time saturation value of
 $\langle P_{\varDelta }\rangle$ is zero for F1 and non-zero for F2, yet the long time p.d.f.s of
 $P_{\varDelta }$ are similar in both cases, as are the long time values of kurtosis and skewness.
5. Conclusion
In the present work, we obtained the evolution equation (2.4) for the average uncertainty energy  $\langle E_{\varDelta } \rangle (t)$ in three-dimensional, incompressible and periodic/homogeneous Navier–Stokes turbulence. The average uncertainty energy evolves because of internal production, dissipation and external input/output of uncertainty. The internal production of uncertainty is a transfer from the correlation between the reference and perturbed fields to the average uncertainty energy and is determined by the eigenvalues of reference field's strain rate tensor and the distribution of uncertainty energy along its three eigenvectors. As shown by (2.12), stretching events decrease uncertainty while the compression events increase uncertainty.
We used DNS of periodic Navier–Stokes turbulence to study the gradual decorrelation process of two initially highly correlated flows. Three different DNS were run, F1, F2 and F3: two where the perturbation is seeded to a statistically stationary turbulence and where the forcing does (F1) or does not (F2) contribute directly to the progressive decorrelation between the reference and perturbed fields; and one (F3) where the reference and perturbed fields are both initially very weak and grow together to eventually become statistically stationary without the external forcing contributing directly to their gradual decorrelation. In all three cases and at times when  $\langle E_{\varDelta } \rangle (t)$ is still small, a similarity time range was found where the growth of the uncertainty spectrum is self-similar if scaled by
 $\langle E_{\varDelta } \rangle (t)$ and the characteristic length
 $L_{\varDelta } (t)$ of uncertainty, and where all the following quantities are constant in time: (i) the ratio
 $\alpha$ of average uncertainty dissipation to average uncertainty production; (ii) the ratio
 $\beta$ characterising how much of the average uncertainty production rate is accountable to the average around which it fluctuates in space; and (iii) the distribution of uncertainty energy in the three eigendirections of the reference field's strain rate tensor. These three similarity constancies and the constancy in time of the three average eigenvalues of the reference field's strain rate tensor imply an exponential growth in time for
 $\langle E_{\varDelta }\rangle$ with Lyapunov exponent
 $\lambda \sim \varGamma \tau _{\eta }^{-1}$. The dimensionless coefficient
 $\varGamma$ is given by (4.7) and grows with Reynolds number because
 $\beta$ decreases with Reynolds number. This exponential growth for
 $\langle E_{\varDelta }\rangle$ is observed in the earlier part of the time range of the similarity regime when the p.d.f. of
 $P_{\varDelta }$ collapses for different times if scaled by its maximum value and standard deviation. As a result, the kurtosis and skewness of this p.d.f. are about constant in this time range. In fact, the value of this constant kurtosis is extremely large indicating extreme intermittency of
 $P_{\varDelta }$. The value of the constant skewness is also large and positive indicating that rare high uncertainty generation events are more intense than rare high uncertainty depletion events. The average value of
 $P_{\varDelta }$ is controlled by this intermittency in this time range. Note that the most probable value of
 $P_{\varDelta }$ is zero at all times.
During the chaotic exponential growth regime, the ratio of  $L_{\varDelta }$ to
 $l_{\lambda }$ of the reference field is roughly constant. In agreement with previous observations (Mohan et al. Reference Mohan, Fitzsimmons and Moser2017), the Lyapunov exponent does not scale with the Kolmogorov time
 $\tau _{\eta }$, but it also does not scale with the smallest Eulerian time scale
 $\tau _{E}$ (Tennekes Reference Tennekes1975). It appears to depend on both as
 $\lambda \sim \tau _{\eta }^{-(1-c)/2} \tau _{E}^{-(1+c)/2}$ with
 $c$ between
 $0$ and
 $1/3$, implying that large-scale random sweeping of the smallest length scales influences the growth of uncertainty even though uncertainty only exists in the smallest eddies in the time range of chaotic exponential growth.
The chaotic growth time range is followed by a time range in the F1 and F2 cases where  $\varGamma$ decays exponentially and
 $\langle E_{\varDelta }\rangle$ grows as an exponential of an exponential. In turn, this exponential of exponential time range may be followed by a linear time range in the F1 case consistently with previous DNS studies (Boffetta & Musacchio Reference Boffetta and Musacchio2017; Berera & Ho Reference Berera and Ho2018), but not in the F2 case, at least for our present DNS Reynolds numbers. The linear growth of uncertainty seems to be sensitive to the direct presence (F1) or absence (F2) of external forcing in the evolution of
 $\langle E_{\varDelta }\rangle$. We did not detect a linear time growth of
 $\langle E_{\varDelta }\rangle$ in F3 either, however the F3 Reynolds number is even lower.
Finally, the exponential growth of  $\langle E_{\varDelta }\rangle$ is usually attributed to the presence of a strange attractor whereas it has been obtained here from similarity. Future research should attempt to shed light on the relations between similarity and strange attractors, and on how similarity may be a consequence of the presence of a such an attractor and underlying chaos. Future research may also consider how this paper's approach to uncertainty in homogeneous turbulence can be extended to a wider range of turbulent flows. In general, the governing equation for Navier–Stokes uncertainty is (2.3) rather than (2.4). Hence, turbulent as well as viscous diffusion and also pressure effects will need to be taken into account explicitly in the evolution of uncertainty. Various boundary conditions and errors on boundary conditions in the case of complex turbulent flows will also be an issue, not to mention various body forces and the presence in many turbulent flows of turbulent/non-turbulent or turbulent/turbulent or other (e.g. density) interfaces. The identification of local compression and stretching events as key to the development of uncertainty means that future prediction methods may benefit from strategies for early detection of such events so as to concentrate maximum accuracy on the compression events and less accuracy on the stretching events. However, the roles of all the other aforementioned effects should not be underestimated and future research is needed to show whether they are subdominant or not and in which flows.
Acknowledgements
J.G. acknowledges financial support from the China Scholarship Council. We are grateful for the access to the computing resources supported by the Zeus supercomputers (Mésocentre de Calcul Scientifique Intensif de l'Université de Lille).
Funding
This research received no specific grant from any funding agency, commercial or not-for-profit sectors.
Declaration of interests
The authors report no conflict of interest.
Appendix A. Sensitivity of the uncertainty energy to the initial perturbation
To investigate the sensitivity of the evolution of average uncertainty energy to the initial perturbation, a series of simulations have been executed, of which the configurations are presented in table 3. By checking the evolution of the average uncertainty energy, the influence of the perturbed range (cases ‘standard’, ‘K07K08’ and ‘K08K09’) and of the amplitude (cases ‘standard’ and ‘Amp01’) of the initial perturbation is investigated. During the similarity period, the changes in the amplitude and the perturbed range have very little effect on the evolution of the average uncertainty energy, other than giving the evolution an offset (explained in the following). At late times, the difference between average uncertainty energies induced by different initial perturbations becomes more obvious for F1 where the external forcing causes an eventual decorrelation between the perturbed and the unperturbed velocity fields.
Numerical configurations for different cases. The two standard cases correspond to F1 and F2. There are two cases K08K09, one for F1 and one for F2, and similarly for cases K07K08 and Amp01. For the standard F1 and F2 cases, the initial perturbations are generated randomly under constraints (i), (ii) and (iii) mentioned in § 3, but for the other six cases the initial perturbations are generated partially randomly under constraints (i) and (ii) in order to precisely control the initial uncertainty energy.

Figure 17 presents the time evolutions of the average uncertainty energy for different perturbed wavenumber ranges. A higher wavenumber perturbed range implies higher uncertainty dissipation rate for the seeded uncertainty at the earliest times, which causes lower value of  $\langle E_{\varDelta }\rangle /\langle E_{{tot}}\rangle$ at very early times and during the similarity period. The effect appears in the log-linear inset of figure 17 as a vertical offset of the curves for the different cases. The average uncertainty energy grows exponentially in all three cases with the same Lyapunov exponent. These different vertical offsets lead to slightly different exit times from the similarity regime. The regime of exponential growth is followed by what appears to be an exponential of exponential regime, where the difference of wavenumber perturbed range has little influence on the evolution of average uncertainty energy since the lines in figure 17 are very close to each other albeit with a persisting small offset.
Time evolution of average uncertainty energy with different perturbed wavenumber range: (a) case F1; (b) case F2. Inset: the initial time evolution of average uncertainty energy in semilogarithmic plot.

Figure 18 presents the time evolution of the average uncertainty energy for the different initial uncertainty energy levels. As can be seen in the figure, the change in the amplitude of initial perturbation has the same effect as the change in the perturbed wavenumber range, i.e. no significant influence on the evolution of uncertainty energy other than creating an offset.
Time evolution of average uncertainty energy with different initial uncertainty energy: (a) case F1; (b) case F2. Inset: the initial time evolution of average uncertainty energy in semilogarithmic plot.

We also checked the uncertainty spectra in the self-similar regime for our various cases with different initial perturbations, as shown in figure 19. All the self-similar spectra with different initial perturbations collapse together.
Uncertainty energy spectra in the similarity regime: (a) case F1; (b) case F2. The spectra are normalised by  $\langle E_{\varDelta }\rangle$ and
 $L_{\varDelta }$.

As an overall conclusion, the early and mid-time evolutions of the average uncertainty energy are not very sensitive to the form and amplitude of the initial perturbations, other than giving the evolution an offset.
Appendix B. Reynolds-number dependence of the time range of the exponential regime
To investigate the relation between the time range of the exponential regime and the Reynolds number, we have run another simulation which has the same external forcing as F2 with initial perturbations which, like standard F1, F2 and F3, obey the three constraints mentioned in § 3. Table 4 presents the main parameters of this extra case F4, as well as cases F2/F3 discussed in the main text. As indicated by tables 1 and 4, the Taylor Reynolds number of case F4 is close to that of case F3. Figure 20 presents the growths of average uncertainty in a semilogarithmic plot. In figure 20(a) we compare the evolution in cases F2 and F4. As can be seen in the figure, the exponential regime in F4 is longer than in F2, and also has a slower growth rate than F2, which is (see (4.9))
 \begin{equation} \varGamma\left\langle T^{(1)}\right\rangle_{t}\sqrt{\left\langle\left|S^{(1)}_{ij}\right|^{2}\right\rangle}\sim\varGamma({Re}_{\lambda})\times {Re}_{\lambda}. \end{equation}
The lower Reynolds number case has a lower growth rate. Furthermore, as shown in figure 6, the exit time from the similarity regime corresponds to the moment when the velocities at the largest wavenumbers become completely decorrelated, i.e.  $\hat {E}_{\varDelta }(k_{max})=\hat {E}_{{tot}}(k_{max})$. Therefore, as the Reynolds number increases, the energy spectrum's inertial range also increases towards smaller scales, causing a decreasing threshold value
 $\langle E_{\varDelta }\rangle /\langle E_{{tot}}\rangle$ that needs to be overcome for the exit time from the exponential growth regime. As a result, the lower-Reynolds-number case has a longer time range of exponential growth.
Parameters of the reference flows for case F4.

Time evolution of average uncertainty energy in semilogarithmic plot: (a) case F2–case F4; (b) case F3–case F4. In the inset of (b), we plot  $(\langle E_{\varDelta }\rangle /\langle E_{{tot}}\rangle )^{1.17}$ for F4 and
 $(\langle E_{\varDelta }\rangle /\langle E_{{tot}}\rangle )$ for F3 translated in the horizontal axis by 2.7
 $\tau$-units to the left.

In figure 20(b) we compare the exponential growths in cases F3 and F4. It is observed that cases F3 and F4 have similar exponential growth rates. The slight difference in exponential growth rates is caused by the small difference in Reynolds numbers. To verify this point, (B1) is applied, along with the observation of Mohan et al. (Reference Mohan, Fitzsimmons and Moser2017) that  $\varGamma ({Re}_{\lambda })\sim {Re}_{\lambda }^{1/3}$. Therefore, we predict that the ratio of exponential growth rates of F3 and F4 is
 $(63.8/56.7)^{4/3}=1.17$, which is verified by our simulations as shown in the inset of figure 20(b). Although cases F3 and F4 have similar exponential growth rates, case F4 has a longer exponential regime. This may have something to do with the fact that F3 is not statistically stationary until
 $\tau = 9.3$ whereas F4 is statistically stationary from the start of the perturbation.



