1. INTRODUCTION
When a high, fast electrical current flows through a metallic wire, the wire heats rapidly by the joule effect, changing its state from the solid to liquid, and then to gas to finally become a plasma. If the current is released in a controlled manner, then the exploding wire system is used as an experimental platform for plasma generation and many other associated research fields (Sarathi et al., Reference Sarathi, Sindhu, Chakravarthy, Sharma and Nagsesh2009; Sheftman & Krasik, Reference Sheftman and Krasik2010; Ram & Sadot, Reference Ram and Sadot2012; Stephens et al., Reference Stephens, Neuber and Kristiansen2012). Despite of the fact that the experiment of a current passing through a conductor has been studied from the end of the 18th century (Nairne, Reference Nairne1780), it is after the middle of 20th century that the exploding wire phenomenon has been studied with more powerful measurement systems, as the review of Bennett et al. (Reference Bennett, Hefferlin and Strehlow1969) demonstrates. Along its history and until present times, scientific use of exploding wires covers a broad range of topics. Some examples are the experimental observation of metallic properties near boiling points of the metal (Chandler et al., Reference Chandler, Hammer, Sinars, Pikuz and Shelkovenko2002), the generation of high-pressure shock waves on a dense medium, specifically in water (Sasaki et al., Reference Sasaki, Yano, Nakajima, Kawamura and Horioka2006; Efimov et al., Reference Efimov, Fedotov, Gleizer, Gurovich, Bazalitski and Krasik2008; Krasik et al., Reference Krasik, Grinenko, Sayapin, Efimov, Fedotov, Gurovich and Oreshkin2008), and the use of exploding wires as substitutes of explosives in the generation and study of blast waves (Ram & Sadot, Reference Ram and Sadot2012; Liverts et al., Reference Liverts, Ram, Sadot, Apazidis and Ben-Dor2015). Also, carefully choosing the exploding wire parameters implies that some states of matter can be experimentally observed, such as their liquid state (Kuskova et al., Reference Kuskova, Tkachenko and Koval1997), and therefore material properties of metals could be compared with theoretical predictions (DeSilva & Katsouros, Reference DeSilva and Katsouros1998; Beilis et al., Reference Beilis, Shashurin, Baksht and Oreshkin2009; Sheftman & Krasik, Reference Sheftman and Krasik2010).
To reach conclusions on the resulting plasma of an exploding wire, a fundamental parameter is the energy density deposition from the electrical circuit into the wire-plasma system. This energy deposition is very sensitive to the electrical current rate, as it has been demonstrated in previous experiments (Sarkisov et al., Reference Sarkisov, Struve and McDaniel2004). To be able to perform measurements on the energy deposition, the most direct way is the use of voltage and current signals on the wire experimentally measured. Combination of these measurements with radial expansion dynamics allow for the exploration of the plasma parameters, so the comparison of experimental and simulated electrical waveforms are used frequently as benchmarks of codes and their conductivity models, therefore many examples can be found in the literature (Gurovich et al., Reference Gurovich, Grinenko, Krasik and Felsteiner2004; Beilis et al., Reference Beilis, Baksht, Oreshkin, Russkikh, Chaikovskii, Yu Labetskii, Ratakhin and Shishlov2008; Stephens & Neuber, Reference Stephens and Neuber2012).
In this work, we present the results for exploding wires of different metals with a current rate below 12 A/ns in atmospheric air. This value indicates a slow current rate in comparison with other works already published, where their current rates could be as large as 500 A/ns (Sheftman & Krasik, Reference Sheftman and Krasik2010). Experiments and simulations that show a complex interplay between the energy absorption and the current density are also presented in this work. They show an excellent agreement between the theoretical and experimental waveforms of the voltage and current values.
This paper is structured as follows. After this introduction, the experimental setup and numerical methods are explained in the two following sections. Experimental and simulation results are presented later, and a last section of conclusions ends this work.
2. EXPERIMENTAL SETUP AND METHODS
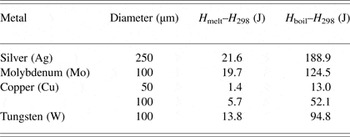
Experiments were performed with the ALEX system (Alambre Explosivo, in Spanish), a typical exploding wire setup, formed by a two capacitors bank (1.13 µF, 40 nH each) connected in parallel with a high-voltage source. A wire is attached in series between the spark-gap and the ground, having an inductance of 140 nH. Wires are of fixed length (3 cm) and surrounded by atmospheric air, but with different metals and diameters; see Table 1. Heat content data that are presented in the table had been obtained from Pankratz and Mrazek (Reference Pankratz and Mrazek1983). The initial voltage of the capacitor bank varied from 10 to 25 kV (in steps of 5 kV).
Metals, diameters, and heat content at melting and boiling points for the total mass of the wires employed in these experiments

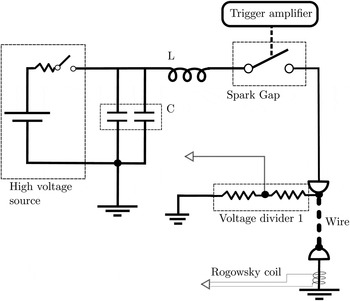
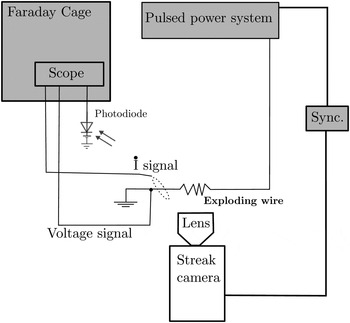
In Figure 1, the equivalent electrical circuit of the setup is shown, where the total inductance of the capacitors has been enclosed as a single component. Measurement of the time evolution of the energy delivered by the circuit to the wire has been obtained by recording the signals from a resistive voltage divider and a Rogowsky coil, placed in the locations indicated in Figure 2. Also the plasma radial expansion is simultaneously measured as a function of time during the wire explosion time. Electrical probes has been designed and calibrated in our laboratory. The signals are transmitted through coaxial cables to the oscilloscopes, shielded against electromagnetic noise in a Faraday cage. Numerical integration of the Rogowsky signals gives the current that flows through the wire. To observe the plasma expansion, a streak image system was focused on the wire for recording the self-emitted plasma light. A fast photodiode, directed toward the wire, was used for the synchronization of the electrical signals with the optical images of the streak system; see Figure 2 for the scheme of the experimental setup.
ALEX electrical scheme. L and C mark the circuit inductance and capacitance, respectively. White arrows signal the BNC connections to the Faraday cage.

Scheme of the experimental setup.

Recorded signals from the voltage divider correspond to the sum of the exploding wire voltage drop plus that of the electrodes and connections in series with the wire. In order to remove from the signals the unwanted voltage drop, that is, that of electrodes and connectors, a common practice is to use an ad-hoc approximation of the behavior of this part of the circuit by just a constant inductance. Thus, the voltage across the wire is obtained as the difference between the measured voltage and that of the modeled inductance.
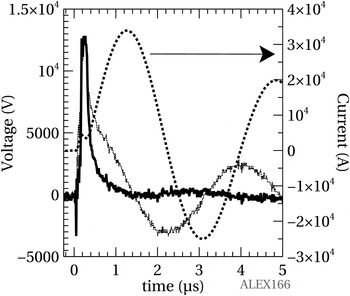
We have instead used a different approach. As a matter of fact, the late oscillatory part of the signal (late in time, after formation and evolution of the plasma) is well fitted by two constant circuit elements, one inductive and other resistive. Note that the inductance and resistivity of the fitting are taken at latter times in the wire explosion, after its disappearance and they are different from the initial values. Therefore, the voltage drop on the wire is obtained by subtracting, from the measured signal, the previous fit. As an example, in Figure 3, we show the result of this procedure for a tungsten wire with a diameter of 100 µm and initial voltage of 15 kV. Further, the numerical simulation, which is described below, supports this approach.
Typical voltage, in wire (▬) and the voltage divider (---), and current (■ ■ ■ ■) signals for a tungsten wire, diameter 100 µm, with the capacitors bank charged at 15 kV.

From voltage and current across the exploding wire, we obtain the electrical power and the energy delivered to the wire. Furthermore, assuming cylindrical symmetry, the combination of the electrical current data with the radial expansion of the plasma, leads to a lower limit for the wire resistivity as a function of time obtained as (Rodríguez Prieto et al., Reference Rodríguez Prieto, Bilbao and Milanese2016):
 $${\rm \mu} \le {\rm \mu} _{{\rm min}} = \displaystyle{{\Delta V S_{\rm w}} \over {I l_{\rm w}}},$$
where ΔV is the measured voltage along the wire, S w is the wire section, I is the wire current, and l w is the wire length.
From the recorded streak images, plasma radial evolution is obtained by a simple method. Plasma radial border is defined as the position where the intensity is 5% of the maximum recorded value on the streak image for each experiment. This is searched sequentially for each time instant and calibrated in space and time to obtain the final radial expansion that is then fitted by the function (Bennett, Reference Bennett1958):
 $$r^2 = \sqrt {\displaystyle{{E_{\rm k}} \over {{\rm \rho} _{{\rm Air}} \,l_{\rm w}}}} t,$$
where E k is the kinetic energy of the plasma, that is, the fraction of the total energy absorbed employed by the plasma in its expansion, ρAir is the air density, and l w is the wire length. The above procedure allows us to obtain the radial expansion with an error of 0.1 mm, meanwhile the error in determination of the time is 50 ns.
3. NUMERICAL METHOD
The experiment was simulated using a simplified, one-dimensional (1D) version of a full 3D multi-component plasma (neutrals, ions, and electrons), two temperature (one for electrons and other for ions and neutrals), Arbitrary Lagrangian–Eulerian, Finite Volume code (Bilbao, Reference Bilbao2006). The code includes electrical resistivity, thermal conduction, magnetic diffusion, and an equation of state (EOS) from solid to plasma obtained from different sources and models, detailed a few lines later. We assumed cylindrical symmetry with only radial dependence in order to use the 1D version of the code.
The wire is coupled to the external circuit using (Rodríguez Prieto et al., Reference Rodríguez Prieto, Bilbao and Milanese2016):
 $$\displaystyle{{d[(L_0 + L_{\rm b})I]} \over {dt}} = \displaystyle{Q \over C} - RI - \int_{\rm b} \vec E \bullet d\vec l,$$
where Q is the charge of the capacitor bank, C is its capacity, L
0 and R are the inductance and the resistance of the concentrated elements of the circuit, respectively, L
b is the inductance calculated at the plasma boundary (“b” refers to the plasma boundary),
 $\vec E$
is the electric field along a path (
 $d\vec l$
) on the plasma boundary (as seen in the frame fixed to the plasma), and I is the current.
Regarding the properties of the materials and the EOS, we have used the following approach. A Mie–Grüneisen EOS was used for solid and liquid, meanwhile both gas and plasma components (ions, electron, and neutrals) were simulated with an ideal gas EOS. The electrical resistivity and the thermal conductivity for solid and liquid states have been interpolated from the published data (Gray, Reference Gray2016), for plasma state the Spitzer conductivity was used, while for gas state a trial and error method was used, as follows. Due to the lack of data on the conductivity of metallic gas, a linear dependence with temperature was assumed, and then fitted until the simulated voltage was in a reasonable accordance with the measured experimental data. The previous model is necessary due to the fact that the electrical behavior of the circuit strongly depends on the electrical resistivity and the thermal conductivity of the wire.
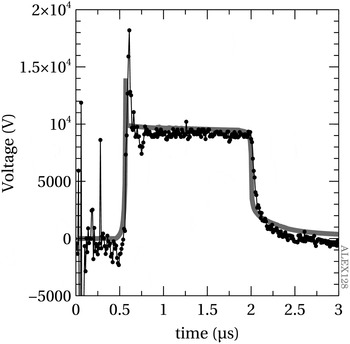
As Figure 4 shows, simulation of the current and voltage on the wire as function of time for a 5 µm Cu wire, 10 kV charging voltage, reproduces well the features obtained in the experiments. Therefore we conclude that duration of the “dark pause” depends on the high resistivity of the wire after being vaporized but not sufficiently ionized to conduct large currents. Thus, electrical properties of the gas can be adjusted until an appropriated duration of this stage is achieved.
Simulated (▬) and experimental (-●-) voltage time evolution in a copper wire of 50 µm charged at 10 kV.

4. RESULTS
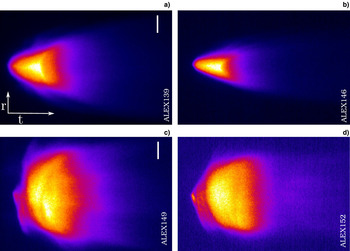
Typical streak images are similar in their features to the depicted in Figure 5. Plasma expansion growing with the charging voltage is clearly visible, as it is the similar duration of the light emission from the metallic plasmas in all the cases. Also, the differences on the wire evolution due to the different metals and masses of the wire are apparent in the streak pictures. Nevertheless, final plasma stage is similar in all the cases in our experiments because the surrounding medium is always atmospheric air. Synchronization of data from plasma radial expansion with electrical energy absorption of the wire–plasma system allows us to observe the temporal relation between these two processes at different charging voltages.
Molybdenum (a, b) and silver (c, d) streak images with 25 and 10 kV charging voltage at left (a, c) and right (b, d), respectively. Bars indicate 9.6 mm and total time in horizontal dimension is 45 µs.

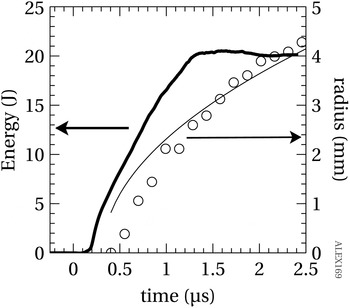
At low initial charging voltages and for all the metals used in this work, except for tungsten, the energy transfer from the circuit to the wire, as measured by the electrical signals, is performed in two different steps. These two steps are defined by the appearance of light emission from the plasma in the streak images. Therefore, a first stage of energy absorption takes place before the plasma formation, in a pre-plasma formation stage, with an amount of energy absorption that can be an important percentage of the total absorbed energy. Plasma expansion begins in the second step, where the kinetic energy of the plasma is obtained from the partial absorption of the electrical energy delivered to the wire–plasma system.
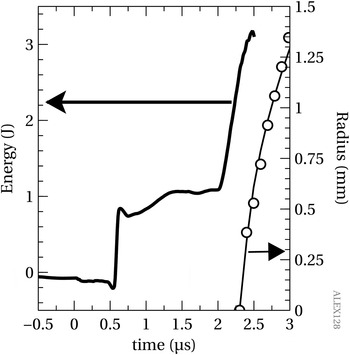
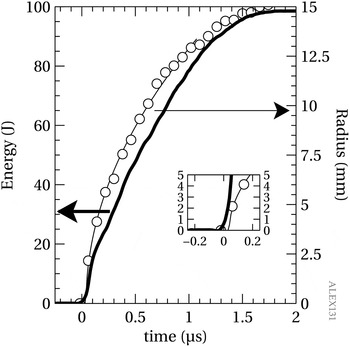
Figure 6 illustrates this process of energy transfer and plasma expansion of a copper wire of 50 µm diameter charged at 10 kV. As the charging voltage increases, the time lapse between the two energy absorption steps is reduced, until the two steps merge into one. Therefore, with the maximum charging voltage of 25 kV the two steps are not distinguishable, as Figure 7 shows for the copper wire of 100 µm diameter.
Energy (▬) and radial expansion of 50 µm copper wires (-○-) at 10 kV initial voltage charge. Hollow dots indicate experimental data and the line is the result of fitting them to the formula 2. Note the difference between the energy transferred to the wire and the heat content for the same wire, Table 1. This is an indication of the incomplete wire conversion into gas or plasma, also confirmed by simulations.

Energy (▬) and radial expansion of 100 µm copper wires(-○-) at 25 kV initial voltage charge. The inset shows the beginning of the expansion.

Experiments performed with tungsten wire show a unique absorption stage even at low charging voltages. Also, due to the larger resistivity, the energy absorbed is higher than for copper; see Figure 8. Nevertheless, the maximum absorbed energy, almost 20 J, is similar to the heat content at melting, 13.8 J, and far from the heat content at boiling, as Table 1 indicates. Both silver and molybdenum exhibit a general behavior similar to that observed using wires of copper or tungsten, except for the time delay between the beginning of electrical energy absorption and the plasma radial expansion.

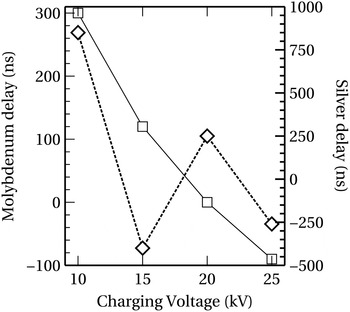
At low initial voltage all metals exhibit a delay that decreases with the increasing in the charging voltage, but at larger voltages, some unexpected tendency emerges. For molybdenum the delay becomes negative, meaning that the main energy absorption is produced after the plasma generation, defined as the moment when the self-emitted light reaches at least 5% of the maximum, as explained in Section 2 of this work. Meanwhile in the case of silver wires the observed delay oscillates around zero, as Figure 9 shows.
Delay between the energy absorption and the beginning of plasma expansion at different charging voltages for Mo (—□—) and Ag(- -◊- -) wires.

The behavior of the delay in both metals is not easy to understand. Based on simulations previously described, we found that in all cases, the delay (when present) occurs when the wire has been melted and vaporized into an almost non-ionized metallic gas state. Under this condition the resistivity is high and the current becomes very small, thus retarding the energy transfer and the posterior ionization processes. This energy transfer delay happens as long as the external resistance is smaller than the one of the metallic gas, thus is the latter the one that controls the electrical current value. Depending on the voltage, and the residual current, the joule heating will take a shorter or longer time to heat up the gas and provide the energy necessary to start the ionization process by thermal collision of the atoms, allowing for the gas transformation into plasma. Thus, the joule heating in this early time of the electrical discharge greatly influences the current density. As a matter of fact, it is the increment of the current density the reason of the reduction in the delay between the energy absorption and plasma generation whenever the charging voltages increased their values. When the charging voltage is high enough, the processes of melting, vaporizing, and ionization occurs in a short period of time, during the linear increase of the current with time, thus the radius of the plasma can be described by a self-similar approximation. Therefore, using (2), for the current density it can be written:
 $$j \propto \displaystyle{{\dot I}{t} \over {r^2}} = \sqrt {{\rm \rho} _{{\rm Air}} \,l_{\rm w}} \displaystyle{{\dot I}{t} \over {\sqrt {E_{\rm k}}}}, $$
where
 ${\dot I}$
is the current derivative. This means that the increase of the kinetic energy with the initial charging voltage, results in a reduction of the current density. So the delay between the electrical energy absorption and plasma creation can grow with the initial charging voltage, in a counterintuitive way, if the ratio between the current and the square root of the kinetic energy diminishes.
Simulations of the exploding wire support this interpretation. When, in the simulations, the plasma is not allowed to expand by means of artificial procedures (i.e., eliminating gas or plasma dynamics and its influence on the current density), the time between the gas and plasma formation reduces to zero.
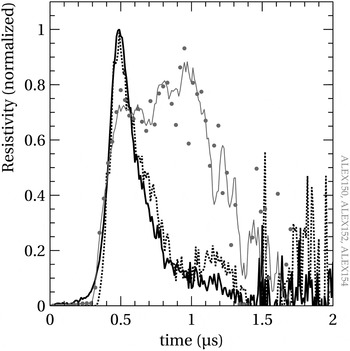
The observed delay between the electrical energy absorption and plasma radial expansion is correlated with the measured lower limit of the resistivity as a function of time; see Figure 10. To better appreciate the differences on the time dependence of the resistivity, it has been normalized to the maximum achieved value. For a charging voltage of 10 kV, the resistivity increases until a quasi-constant plateau value, from where it decays with some peaks on the downward slope at about 1.5 µs after the beginning of the electrical discharge. While the charging voltage is settled in 15 and 20 kV, the time variation of the resistivity changes to a single peak, with different slopes for each charging voltage.
Normalized resistivity of a silver wire of 250 µm diameter when the capacitor bank is charged with 10 (-●-), 15 (▬), and 20 (---) kV.

5. CONCLUSIONS
Variation on the synchronization between the electrical energy absorption of the plasma–wire system and the plasma formation has been observed experimentally, with values ranging from ≈0.0 to 2.0 µs, in the case of copper wires. A non-intuitive relation for this delay had been observed for silver, as at 15 kV of charging voltage the delay changes its sign, interrupting the tendency to being reduced with the increase of the voltage observed with other metals. Both behaviors are understood in this work because of the interplay of the ratio between the current and the square root of the kinetic energy of the plasma.
Also the correlation of this delay with the shape of a lower limit to the wire resistivity has been measured. Two distinct time variations for the wire resistivity had been observed, namely a single peak with different slopes for each charging voltage, and a plateau of ≈0.7 µs if the charging voltage is 10 kV.
In conclusion, energy absorption in the exploding wire system for relatively slow current rates, with values under 12 A/ns, had been experimentally observed, and the difference in behavior with faster exploding wire systems (Sarkisov et al., Reference Sarkisov, Rosenthal, Cochrane, Struve, Deeney and McDaniel2005a , Reference Sarkisov, Struve and McDaniel b ; Grinenko et al., Reference Grinenko, Krasik, Efimov, Fedotov and Gurovich2006) is attributed to the ratio between the current derivative passing through the wire and the square root of the kinetic energy of the plasma.
ACKNOWLEDGMENTS
This study has been partially supported by the Ministerio de Energía y Competitividad of Spain (grant no. ENE2013-45661-C2-1-P) and Junta de Comunidades de Castilla-la Mancha (grant no. EII-2014-008-P). The authors would like to thank Professor Roberto Piriz for his valuable comments and suggestions.