

INTRODUCTION
On February 26, 2012, seventeen-year-old Trayvon Martin walked home on a cool dark night in a suburban community of Sanford, Florida. On that night, George Zimmerman, a self-appointed neighborhood watchman, perceived Martin as a danger to the neighborhood and fatally shot him. Martin was unarmed and in the pocket of the hooded sweatshirt he wore was a bag of Skittles and a can of Arizona iced tea. Martin, like Michael Brown, Tamir Rice, Jordan Davis and many other Black boys and men, are victims of the reality that many Americans implicitly associate Black men with hostility and violence (Devine Reference Devine1989). Experimental studies have repeatedly demonstrated that Black men are more likely to be associated with potential threat (Cottrell and Neuberg, Reference Cottrell and Neuberg2005) and are more likely to be shot when unarmed in simulations than White men (Amodio Reference Amodio2014; Correll et al., Reference Correll, Park, Judd and Wittenbrink2007). Thus, an implicit bias that Black men are threatening can lead to serious safety and economic consequences (Knuycky et al., Reference Knuycky, Kleider and Cavrak2014; Pager Reference Pager2003).
After Martin’s death, much of the public debate focused on whether racial bias or dangerous urban streetwear was to blame for him being targeted by Zimmerman. In 2012, Geraldo Rivera, a Fox News commentator, proclaimed on national television: “I think the hoodie is as much responsible for Trayvon Martin’s death as George Zimmerman was” (Fox News Reference Rivera2012). The idea that Black men who dress in certain styles (like hoodies and loose clothing) are dangerous is not new. Urban nightclubs create dress codes that specifically target styles commonly worn by Black men to exclude them from frequenting majority White establishments (May Reference May2018). Attributing reasons for bias to clothing styles rather than race is consistent with forms of colorblind racism that reinforce racial bias in institutions like the criminal justice system (Bonilla-Silva Reference Bonilla-Silva2018). It also bolsters claims from the discourse of respectability politics that appearing socially “acceptable” by conforming to White middle-class norms will reduce perceptions of threat toward Black men. While public discourse suggests that clothing style is a functional marker of threat and “non-threatening” attire may be able to reduce implicit racial bias, there is little empirical evidence to support the claim that professionally dressed Black men are exempt from the implicit racial bias of threat (Kahn and Davies, Reference Kahn and Davies2017). This paper examines whether professional attire can reduce the unconscious biases that associate Black men with danger.
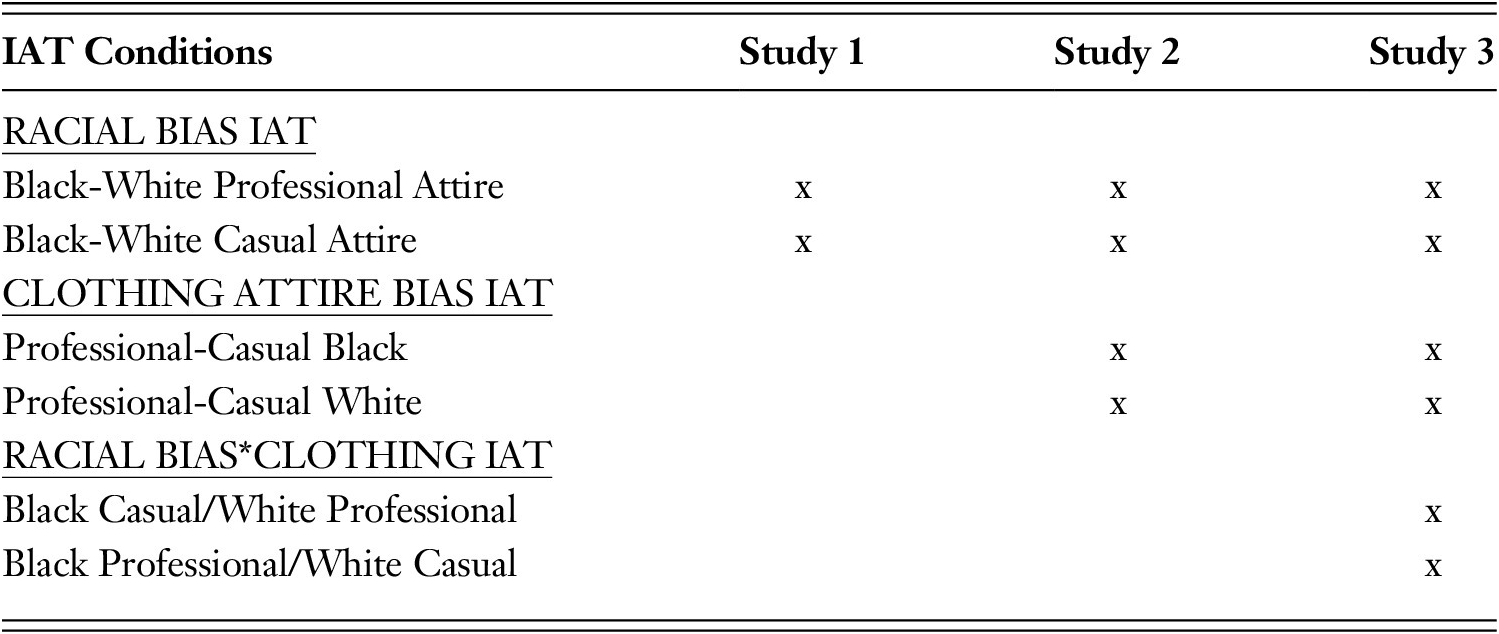
We conducted three studies using an Implicit Association Test to assess whether professionally dressed Black men are unconsciously perceived as less threatening. Each subsequent study not only addressed a separate component of the research question, but also replicated the findings from the preceding one to bolster the validity of the findings. In Study 1, we examined whether Black men are perceived as more threatening than White men. In Study 2, we replicated the findings from Study 1 and also examined whether casual or professional dress, separate from race, are related to implicit associations with threat. In Study 3, we replicated the findings from the two previous studies and investigated whether Black or White men dressed in different attire from each other are associated with threat.
Implicit Racial Bias and Perceptions of Threat
Research suggests that the perception that Black men are more threatening than White men may be driven, in part, by an implicit racial bias that associates Black men with threat. Joshua Correll and colleagues (Reference Correll, Park, Judd and Wittenbrink2002) used a shooting task computer simulation to test how race is associated with an individual’s accuracy in perceiving danger. The participants were instructed to shoot a Black or White person if they held a weapon and to not shoot if they held an object (e.g. wallet). Participants were quicker to shoot an armed Black person than an armed White man. They were also quicker in their decisions to not shoot an unarmed White man, indicating that they took longer to decide if Black men were non-threatening, thus, giving evidence to implicit racial bias as a cause for perceived threat. Yet, findings have been mixed when police officers are used as participants. While police officers are quicker to shoot armed Black targets, there is insufficient evidence of implicit racial bias in shooting unarmed Black men (Correll et al., Reference Correll, Park, Judd and Wittenbrink2007).
Priming people with images of Black faces also increases individuals’ expectation of threat (Eberhardt et al., Reference Eberhardt, Goff, Purdie and Davies2004). Jennifer L. Eberhardt and colleagues (Reference Eberhardt, Goff, Purdie and Davies2004) conducted an experiment wherein respondents viewed fifty pictures of either Black or White men and then had to identify fourteen sets of images of objects that were degraded so that it was not immediately clear what it was. They found that respondents who saw a flashing picture of a Black person were faster to label the subsequent degraded object as a crime-relevant object than those who saw a White person’s face. There was no relationship between the participant’s explicit prejudice and their responses, demonstrating this implicit bias was present even in those who reported low levels of prejudice. They also found that priming participants with crime-related objects (e.g. gun, knife) increased their attention to Black faces. Therefore, it points to a bidirectional relationship between race and threat where the presence of one activates the other.
There is also evidence that these perceptions of threat even extend to Black boys. Andrew R. Todd and colleagues (Reference Todd, Thiem and Neel2016) tested the implicit stereotypes associated with five-year-old Black boys. When White participants were primed with pictures of Black boys, they showed greater ease categorizing threatening stimuli, like weapons, than they did when they saw pictures of White boys of the same age. Similarly, elderly Black men are also associated with danger even though elderly people tend to not be perceived as dangerous, in general (Lundberg et al., Reference Lundberg, Neel, Lassetter and Todd2018). The extant research demonstrates that Blackness is used as a frame to interpret situations, especially those that are ambiguous, as dangerous. Therefore, this leads to an implicit shaping of an individual’s perception and potential behavior in social relational contexts due to racial bias (Macrae and Quadflieg, Reference Macrae, Quadflieg, Fiske, Gilbert and Lindsay2010). Based on prior research, we expect to find evidence of implicit racial bias. Thus, our Racial Bias Hypothesis proposes:
H1: Black men will be implicitly perceived as more threatening than White men.
Prototypicality Amplifies Implicit Racial Bias
The effects of racial bias may be further amplified when Black men appear more prototypical of their racial group. Prototypical Black men are usually described as having darker features, broader noses, and wider lips, to name a few characteristics (Eberdhardt et al., Reference Eberhardt, Davies, Purdie-Vaughns and Johnson2006; Kahn and Davies, Reference Kahn and Davies2011; Davies et al., Reference Davies, Hutchinson, Osborne and Eberhardt2016). These ideas of the types of people who are prototypical of their group exist in the cultural understandings of various groups and have different implications for people who fit into them as compared to those who do not (Ridgeway and Krischeli-Katz, Reference Ridgeway and Kricheli-Katz2013).
The implications of how prototypicality may impact Black men are demonstrated by research. Kimberly Barsamian Kahn and Paul G. Davies (Reference Kahn and Davies2011) found that Black men who appeared more prototypical of their group were perceived to be more dangerous than those who appeared less prototypical in video game simulations. In a series of experimental studies, Leslie R. Knuycky and colleagues (Reference Knuycky, Kleider and Cavrak2014) found that identification errors for face recognition and line-up identification were higher for prototypical than non-prototypical Black faces. These findings suggest that prototypicality may cause eyewitnesses to misidentify suspects because they are relying on cognitive associations of stereotypical features with threat. The probability of misidentification is even higher when Black men commit crimes that are stereotyped as racially typical and when the victim is non-Black (Davies et al., Reference Davies, Hutchinson, Osborne and Eberhardt2016). The effects of appearing prototypical have been shown not only in laboratory experiments but also using real-world evidence. Heather M. Kleider-Offutt and colleagues (Reference Kleider-Offutt, Knuycky, Clevinger and Capodanno2017) used data from Black men in the United States exonerated by the Innocence Project through DNA evidence. They found that those who were exonerated due to eyewitness misidentification had higher stereotypicality ratings than those who were exonerated for other reasons. Using existing data with death-eligible defendants, Eberhardt and colleagues (Reference Eberhardt, Davies, Purdie-Vaughns and Johnson2006) found that Black defendants whose facial features were rated as more stereotypically Black were more likely to have received the death penalty. The findings from these studies explicate the criminal justice consequences of implicit racial bias for Black men, especially those who are perceived to be prototypical of their group.
There are also studies that have demonstrated that Black men who appear less prototypical as a result of being gay, baby-faced, or light-skinned (Livingston and Pearce, Reference Livingston and Pearce2009; Pedulla Reference Pedulla2014; Uzogara et al., Reference Uzogara, Lee, Abdou and Jackson2014), are perceived as less threatening and, in turn, may garner certain advantages relative to prototypical Black men. Therefore, it is possible that this may also extend to professional attire, which may not necessarily align with common Black stereotypes. Professional clothing may have a similar attenuating effect on the strength of the association between Black men and perceptions of threat as demonstrated in previous studies.
Professional Dress, Respectability Politics, and Markers of Middle-class Status
Professional dress is embedded in racialized understandings of what it means to be a socially respectable Black man. Respectability politics have been framed in public discourse as a way to reduce stereotypes of Black men as threatening. This ideology supports the notion that professional and well-mannered Black men are not prototypical of their group and are, therefore, not threatening. Relatedly, professional dress is often a marker of higher status and social class and thus may reduce perceptions of threat to the extent that people more strongly associate lower class people with crime. We formally define respectability politics, or respectability, as behaviors or ideologies that are used to demonstrate that minority group values are compatible with those of the dominant group (e.g., middle-class White men) (Harris Reference Harris2014). Respectability politics is a form of color-blind racism in that it shifts the focus away from structural racism to more individualistic characteristics like speech or hairstyle (Bonilla-Silva Reference Bonilla-Silva2018; Obasogie and Newman, Reference Obasogie and Newman2016). For the purposes of this paper, we focus on professional attire as one way that respectability politics may be adopted as a strategy by Black men to avoid discriminatory treatment caused by implicit racial (and/or class) bias.
Research on the association of threat with professional clothing is mixed. M. Kimberly Maclin and Vivian Herrera (Reference MacLin and Herrera2006) find evidence that baggy clothing, dark clothing, and jeans are seen as threatening attire, while professional clothing is regarded as less threatening. Kahn and Davies (Reference Kahn and Davies2017) replicated first-person shooter task experiments (Correll et al., Reference Correll, Park, Judd and Wittenbrink2007) and added contextual cues about the neighborhood and clothing. Participants were less likely to shoot unarmed Black men who were wearing “safe” attire (e.g. light button-up shirt and tie) than those wearing “threatening” attire (e.g. sweatshirt and baseball cap). Participants were also more likely to mistakenly shoot Black men who were wearing the threatening clothing. While Kahn and Davies (Reference Kahn and Davies2017) compared Black men to similarly dressed Whites, they did not directly compare Black men dressed in safe and threatening attire to each other. The implication is that such a comparison would show that it is professional dress that attenuates the perception that Black men are threatening. In contrast, Lois James and colleagues (Reference James, James and Vila2018) find that attire was not a predictor of how police officers interacted with citizens. While these studies do not advocate for the use of respectability politics, the implications of the findings speak to whether attire reduces implicit racial biases that associate Black men with threat. Additionally, these findings, taken together, demonstrate the need for more research on contextual factors to understand how and when attire affects perceived threat. If clothing affects perceptions of threat, then the Respectability Hypothesis states that:
H2: Professionally dressed Black men will be perceived as less threatening than casually dressed Black men.
It is possible that the effect of professional dress on perceptions of Black and White men may differ due to the typicality or atypicality of professional dress for each racial group. However, there is very limited research on the differences in these perceptions (Devine and Baker, Reference Devine and Baker1991; Hinzman and Maddox, Reference Hinzman and Maddox2017). Lindsay Hinzman and Keith B. Maddox (Reference Hinzman and Maddox2017) found a racial difference in how businessmen are racially grouped. In particular, they conclude that businessmen are perceived as a White subgroup of which membership is seen as atypical for Black men. Thus, there are unique stereotypes that apply to Black and White businessmen. For example, White businessmen are viewed as more powerful and successful than Black businessmen and White people, in general. The perception of White businessmen as powerful and successful may result in feelings of threat that may be different from the fear of physical threat that is associated with Black men. As a result, we may find a racial difference in how professional attire is associated with threat.
THE PRESENT RESEARCH
The aim of the present research is to examine whether professional attire is able to reduce the implicit association of Black men with threat. In three studies, we tested two main hypotheses—the Racial Bias Hypothesis and the Respectability Hypothesis. To summarize, the Racial Bias Hypothesis predicts that Black men will be perceived as threatening regardless of their attire, when compared to White men. The Respectability Hypothesis holds that there will be less implicit racial bias of threat toward professionally—or respectably—dressed Black men as compared to casually dressed Black men.
Footnote In each of the three studies, we employed a modified version of the Weapons Implicit Association Test (IAT) (James et al., Reference James, James and Vila2016).Footnote 1 In addition, while we do not hypothesize about the relationship between implicit and explicit beliefs in this study, we also measured participants’ self-reported attitudes about Black men, as is considered a best practice in research using the IAT (Kurdi et al., Reference Kurdi, Seitchik, Axt, Carroll, Karapetyan, Kaushik, Tomezsko, Greenwald and Banaji2019). The materials and procedures remained the same for all three studies. Each study presents novel findings as well as validates the findings from the preceding study (See Table 1). In Study 1, we tested whether Black men are associated with threat more than White men when dressed in similar attire. In Study 2, we replicated the findings from Study 1 and sought to test whether professional dress is associated with less threat than casual attire. Finally, in Study 3, we assessed the perception of threat toward Black men compared to differentially dressed White men as well as replicated the findings from Study 1 and Study 2. All studies are between-subject designs in which participants were randomly assigned to only complete one IAT.
Conditions Across Studies

The Implicit Association Test
In order to better understand attitudes that are socially sensitive and vulnerable to social desirability effects, social psychologists have turned to implicit measures such as racial priming and latency measures. Implicit measures are designed to indirectly capture attitudes that people are not willing to state due to social desirability or are unable to report because they are not fully in their conscious awareness. The Implicit Association Test is the most widely used implicit measure (Greenwald et al., Reference Kurdi, Seitchik, Axt, Carroll, Karapetyan, Kaushik, Tomezsko, Greenwald and Banaji2019) and has been used to measure attitudes about a variety of subjects. The IAT is a response time computer program that records the speed with which research participants make unconscious associations with social categories, capitalizing on the tendency for people to make faster associations between concepts that they more strongly associate with each other. One of the advantages of the IAT, as compared to explicit measures like self-report, is that it measures cognitive processes that are automatic and cannot be consciously controlled (Greenwald et al., Reference Kurdi, Seitchik, Axt, Carroll, Karapetyan, Kaushik, Tomezsko, Greenwald and Banaji2019; Kurdi et al., Reference Kurdi, Ratliff and Cunningham2020).
While controversies persist about the implications of IAT results (e.g., Jost et al., Reference Jost, Rudman, Blair, Carney, Dasgupta, Glaser and Hardin2009; Oswald et al., Reference Oswald, Mitchell, Blanton, Jaccard and Tetlock2013; Tinkler Reference Tinkler2012), the most recent and comprehensive meta-analysis of 217 research reports (N=36,071) found that IATs measuring attitudes, stereotypes, and identity are significantly correlated with measures of intergroup behavior (Kurdi et al., Reference Kurdi, Ratliff and Cunningham2020). As noted in previous reviews (Tinkler Reference Tinkler2012), variants of the Black / White IAT (that associates positive and negative words with White and Black faces) have been shown to predict interracial interaction behavior (McConnell and Leibold, Reference McConnell and Leibold2001; Melamed et al., Reference Melamed, Munn, Barry, Montgomery and Okuwobi2019; Rudman and Ashmore, Reference Rudman and Ashmore2007), interracial helping behavior (Stepanikova et al., Reference Stepanikova, Triplett and Simpson2011), trustworthiness judgments and decisions (Stanley et al., Reference Stanley, Sokol-Hessner, Banaji and Phelps2011), and voting in the 2008 presidential election (Greenwald et al., Reference Greenwald, Poehlman, Uhlmann and Banaji2009). In addition, higher pro-White biases on the IAT are associated with racial discrimination in simulated job interviews (Sekaquaptewa et al., Reference Sekaquaptewa, Espinoza, Thompson, Vargas and Hippel2003), resume evaluations (Ziegert and Hanges, Reference Ziegert and Hanges2005), suspect shootings (Glaser and Knowles, Reference Glaser and Knowles2008), physician treatment recommendations (Green et al., Reference Green, Carney, Pallin, Ngo, Raymond, Iezzoni and Banaji2007), and budget allocations to college student groups (Rudman and Ashmore, Reference Rudman and Ashmore2007).
Since feeling threatened often gives rise to automatic, less consciously reasoned behavior (Baumeister et al., Reference Baumeister, Masicampo and Vohs2011), implicit biases associated with Black men and threat are particularly important for understanding unequal racial outcomes in the criminal justice system. Given the predictive validity of the IAT and the advantages of reducing social desirability bias over more explicit measures, the IAT is appropriate in this context for measuring, on average, whether professional attire reduces unconscious associations of threat with Black men.
Study 1
Participants and Procedure
Like most social psychology lab experiments, we used a sample of undergraduate students to test our hypotheses because we believe that they are similar to the general population in important ways (Lovaglia et al., Reference Lovaglia, Lucas and Thye1998). While American college students are sometimes different than other groups in their feelings, goals, and behavior, they are central to mainstream cultural consumption and production and have been shown to be apt cultural informants (Romney et al., Reference Romney, Weller and Batchelder1986). This study does not seek to examine individual differences, but instead, to identify general social processes that arise as a consequence of being exposed to racial stereotypes in American culture. Thus, our hypotheses require a sample of participants that understand and recognize broad cultural norms about race. Since college students have been shown to be ideal participants for studies aimed at identifying unbiased estimates of meanings in the larger culture (Wisecup Reference Wisecup2011), they are a useful population for a first test of our hypotheses.
The participants were eighty-three undergraduate psychology students (42 men, 41 women, M age=19, SDage=.92) in a large public university in the Southeastern United States. All participants received course credit for participation. Seventy-six percent of participants self-identified as White, 13% as Black or African American, 5% as Asian, 5% other-race and 1% as Native American.
Participants completed the experiment in the research laboratory on a computer. Participants first filled out an anonymous demographic questionnaire and then completed a questionnaire measuring their explicit attitudes about Black men (Bryson Reference Bryson1998). After the questionnaires, participants completed what we are calling the Racial Bias Implicit Association Test measuring implicit associations between race and weapons. We ordered the measures in this way because unlike self-reported racial attitudes which are vulnerable to social desirability bias, scores on the IAT are nearly impossible to control (Kim Reference Kim2003; Stepanikova et al., Reference Stepanikova, Triplett and Simpson2011). While it is possible that participants may have been primed to think about race after completing the questionnaire, it would not affect the results across conditions because all participants completed the explicit measure first. Participants were randomly assigned to one of two IAT conditions. In the professional dress condition, participants completed an Implicit Association Test measuring their association of professionally dressed White and Black men with weapons. In the casually dressed condition, participants completed an IAT measuring their association of casually dressed White and Black men with weapons. Due to a computer glitch, there was an imbalance in the sample size across conditions resulting in a sample of twenty in the Black-White casual condition and sixty-three in the Black-White professional condition. IAT effects within conditions were not compromised, but comparisons across conditions should be treated with caution given this cell size imbalance.
Measures
We measured participants’ perceived threat of Black men based on attire using a modification of the Weapons IAT.Footnote 2 The original Weapons IAT (James et al., Reference James, James and Vila2016; Nosek et al., Reference Nosek, Smyth, Hansen, Devos, Lindner, Ranganath, Smith, Olson, Chugh, Greenwald and Banaji2007) includes images of White and Black male faces and harmless objects (e.g., cellphone, soda can) and weapons (e.g., cannon, sword) to be categorized with the labels “Black American”/“White American” and “harmless object”/”weapon”. Our only modification was that we used images of Black and White men that also included their clothing.
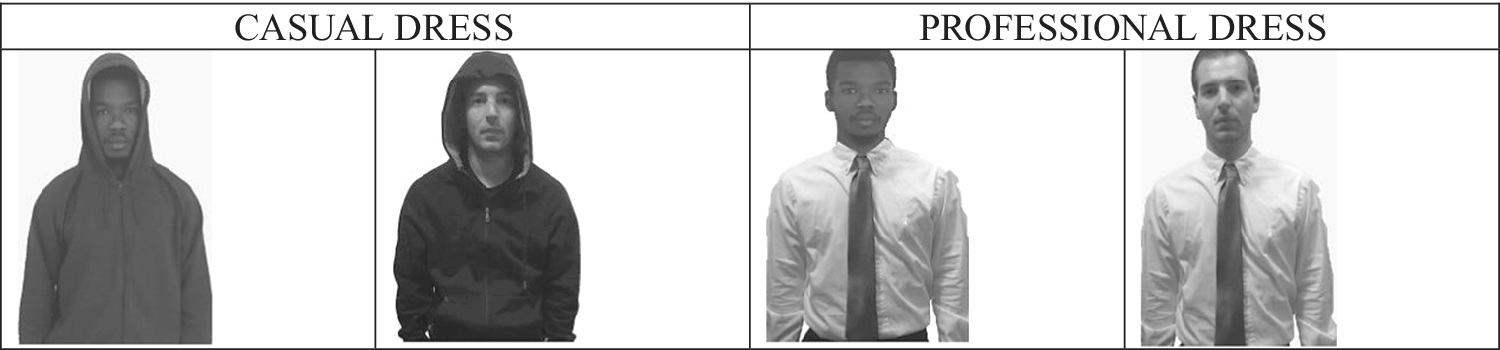
The stimuli for the IAT consisted of black-and-white images of a White or Black male model dressed in professional or casual attire. Because these images have not been used in previous studies, we conducted a pretest in which undergraduate students rated how threatening the male models seemed as well as their perceived race and attractiveness. Ratings revealed that the White and Black model were clearly identifiable as members of their respective racial group (100% of respondents chose correct racial category for each model), rated similarly for perceived threat (3/8 for Black model; 3.5/8 for White model; p>.1), and the Black model was rated as slightly more attractive (3.18/5 for Black model; 2.4/5 for White model; p<.01). Models were instructed to keep a neutral face and pose with their arms at their sides. The professional attire in the images used in the study consisted of a light button up shirt, solid or patterned tie, and/or a blazer (see Figure 1). The casual attire in the images consisted of a dark hoodie and shirt, which is considered stereotypical criminal clothing (Maclin and Hererra, Reference MacLin and Herrera2006). However, we did not choose styles that are commonly associated with urban streetwear because we did not want racialized associations with that style to confound our ability to compare professional and casual dress effects. As in prior research (James et al., Reference James, James and Vila2016), the stimuli for the weapons were black-and-white images of outdated weapons such as a canon, sword, and pistol. Employing these types of weapons ensures that there are no obvious racialized associations that may occur with more modern weapons like a Glock or an AR-15. The stimuli used to represent harmless objects also held the same purpose with black-and-white images of items such as a wallet, soda can, and cellphone.
Example Images of IAT Stimuli
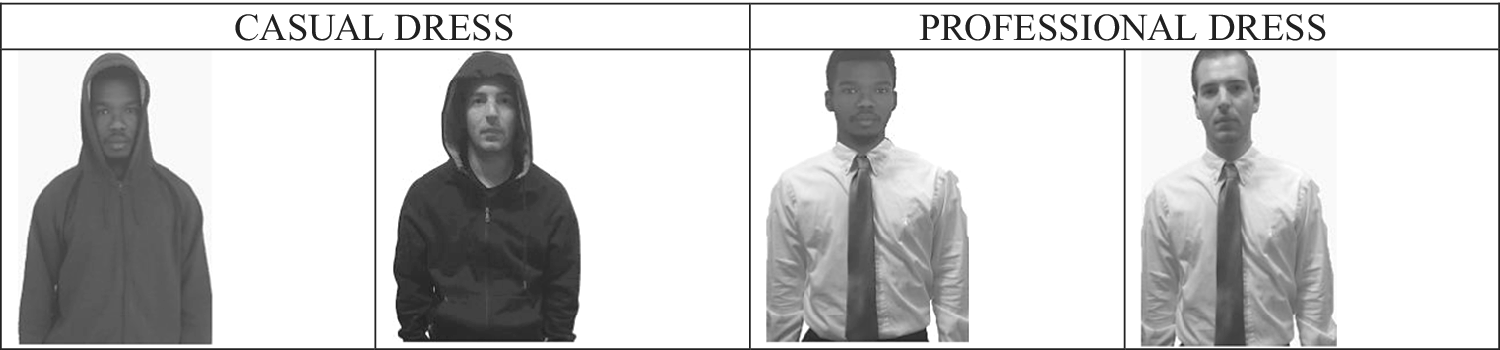
In all IATs in this study, we adopted established protocols (see Greenwald et al., Reference Greenwald, Nosek and Banaji2003) and used the seven-block long form IAT in which participants categorized stimuli repeatedly (typically twenty times per block). The order of the stimuli was randomized and we used six different images to represent the stimuli in each category (e.g., in the professional dress condition of the Racial Bias IAT, participants saw six different images of the Black man dressed professionally and six different images of the White man dressed professionally). The number of stimuli and the randomization of them in each block is consistent with best practices (Nosek Reference Nosek2005).
We used the improved scoring algorithm to measure the IAT effect (Nosek et al., Reference Nosek, Smyth, Hansen, Devos, Lindner, Ranganath, Smith, Olson, Chugh, Greenwald and Banaji2007) and counterbalanced the order with which participants were exposed to stereotypical (Black American/weapons) vs. non-stereotypical (Black American/harmless objects) blocks. The response latency is computed as the D-score, which ranges from -2 to +2. The D-Score is computed as the difference between mean latencies for the two combined tasks divided by the standard deviation derived from all latencies in the IAT’s two combined tasks (Greenwald et al., Reference Kurdi, Seitchik, Axt, Carroll, Karapetyan, Kaushik, Tomezsko, Greenwald and Banaji2019).Footnote 3 Positive values represent greater association of Black men with weapons, zero means people do not associate White or Black men with weapons, and negative values represent a greater association of White men with weapons. Conceptually, the IAT effect is the difference between reaction times for non-stereotypical and stereotypical blocks. Using guidelines for Jacob Cohen’s d (Reference Cohen1988; which is calculated similar to the D-score), we interpret 0.2, 0.5, and 0.8 to be small, medium, and large effects, respectively.
We measured participants’ explicit attitudes toward Black men with the Attitudes toward Blacks Males Scale (α=.87) (Bryson Reference Bryson1998). The questionnaire consists of forty-seven items and eight subscales—intellectual ability (e.g. “Black males score lower on intelligence tests”), criminal justice (e.g. “Black males receive no difference in treatment from police”), expectations of preferential treatment (e.g. “Black males cannot be as successful”), personality (e.g. “Black males are usually more sensitive”), sociability (e.g. “Black males are not usually friendly”), employment (e.g. “Black men are not willing to work as hard”), self-confidence (e.g. “Black men are not as ambitious”), and global characteristics (e.g. “Black males make others uncomfortable”). Responses range from (1) “I agree very much” to (6) “I disagree very much.” We coded the responses so that higher values represent greater bias toward Black men.
Results
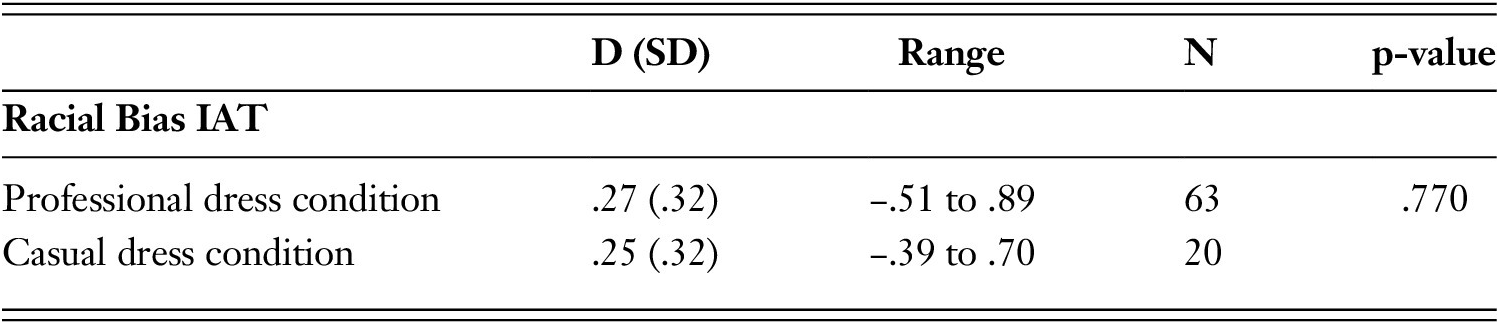
We averaged the D-score for each condition and conducted a means comparisons test. As displayed in Table 2, in the Black-White casual condition, the IAT effect was significantly different than zero and the effect size suggests that there was a small to moderate association of Black men with weapons (D=.25, SD=.32; p<.01). The results of the Black-White professional condition also revealed a small to moderate association of Black men with weapons (D=.27, SD=.32; p<.01). The means comparisons test revealed no significant difference between the D-scores of the two conditions (p>.10). Furthermore, we find no significant correlation between the explicit attitudes about Black men and the implicit associations of Black men with weapons in both professionally (r=.−04, p>.1) and casually-dressed (r=−.23, p>.1) conditions.Footnote 4
Mean IAT Effects (D-score and Standard Deviations) Across Conditions for Study 1

Notes: D score IAT effects are significantly different than zero at p<.01. P-values report comparisons of D score means across conditions. Higher positive numbers show stronger association of Black men with weapons.
Discussion
The results from Study 1 demonstrate that Black men are more strongly associated with threat as compared to White men, giving support to the Racial Bias Hypothesis (H1). Participants were quicker to associate Black men with images of weapons and White men with harmless objects. We also find that the amount of racial bias (i.e., positive IAT effects) is not significantly different across professional and casual dress conditions. Thus, we do not find support for the Respectability Hypothesis (H2) in Study 1. Consistent with prior research (James et al., Reference James, James and Vila2016), we also do not find a correlation between the implicit and explicit measures. For socially sensitive topics like racial stereotyping, implicit measures tend to reveal greater bias than explicit ones, given the pressure to not appear racist on self-report surveys (Greenwald et al., Reference Kurdi, Seitchik, Axt, Carroll, Karapetyan, Kaushik, Tomezsko, Greenwald and Banaji2019).
In summary, participants more strongly associated Black men, as compared to White men, with threat regardless of how they were dressed. Perhaps attire cannot attenuate perceptions of threat associated with Black men. It is also possible that the sample size imbalance across conditions resulted in limited statistical power to observe any differences. To further investigate the Respectability Hypothesis, Study 2 replicates Study 1 and then examines the perception of threat toward professionally dressed and casually dressed men when compared to their racial peers.
Study 2
Given that we find no evidence that professional dress attenuated racial bias in Study 1, Study 2 aimed to further explore the role of attire in perceptions of threat. In this study, we replicated the findings from Study 1 and created two additional conditions, which we label the professional-casual Black condition and professional-casual White condition. While the findings from Study 1 clearly demonstrate that Black men are perceived as more threatening than White men regardless of attire, in Study 2 we sought to examine whether professionally dressed Black men are seen as less threatening than casually dressed Black men. Thus, we utilized intra-racial comparisons to test whether casual clothing is more threatening than professional clothing.
Participants and Procedure
The participants were ninety undergraduate students (59 women, 31 men, M age=19, SDage=.17). The racial composition of the sample was 76% White, 11% Asian, 12% Black, and 1% Pacific Islander. The procedures were the same as in Study 1. All participants completed a questionnaire regarding explicit attitudes about Black men and were randomly assigned to complete one of four conditions. The conditions are labeled as 1) White-Black professionally dressed, 2) White-Black casually dressed (Racial Bias IAT’s used in Study 1), 3) professionally-casually dressed Black man and 4) professionally-casually dressed White man (Clothing Attire IAT’s). As in Study 1, in the two Black-White conditions, Black and White men dressed in similar styles are compared to weapons or harmless objects. In the two Clothing Attire IATs, Black men dressed both professionally and casually are compared to harmless objects/weapons and White men dressed in both professional and casual styles are compared to harmless objects/weapons. The labels for the two Clothing Attire IATs were “harmless object,” “weapon,” “professional dress,” and “casual dress.” The same images were used across conditions and the ordering of the stimuli was randomized within each block.
Measures
As in Study 1, we calculated the IAT using the improved algorithm and counterbalanced the order of stereotypical and non-stereotypical blocks. For the replicated Racial Bias IATs, positive D-scores represent implicit racial bias against Black men. For the two Clothing Attire IATs, positive D-scores represent a stronger association of casual dress with weapons and negative D-scores represent a stronger association of professional dress with weapons. We also measured explicit attitudes about Black men using the same survey from Study 1, the Attitudes toward Black Males Scale (Bryson Reference Bryson1998).
Results
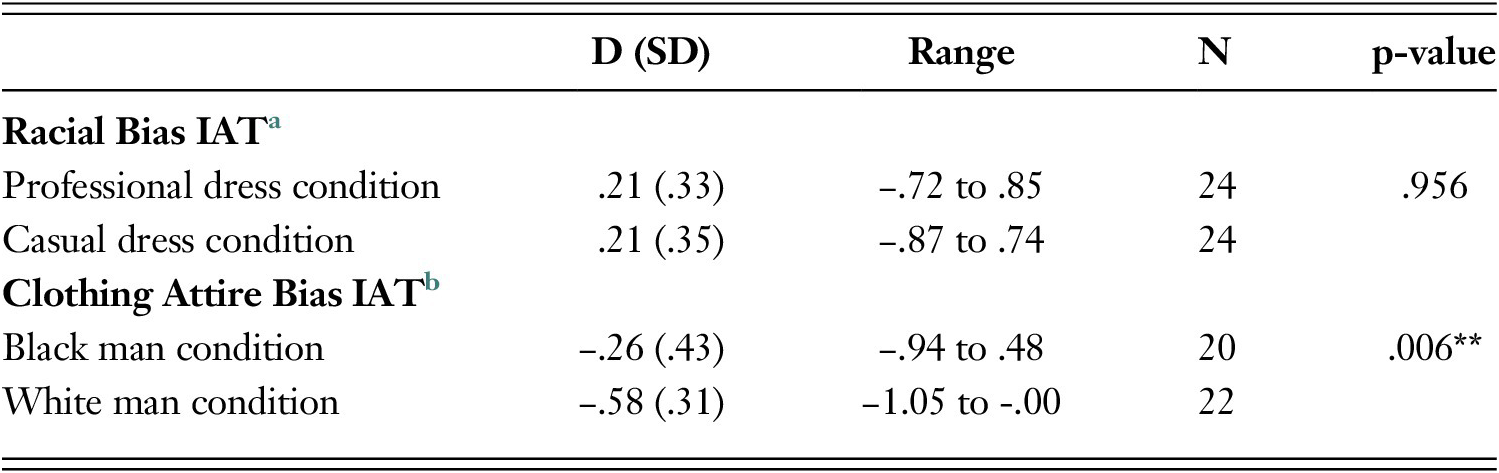
Perceptions of threat from Racial Bias IATs. Table 3 shows that in the Black-White professional condition, participants perceived the Black man as more threatening than the White man (D=.21, SD=.33, p<.01). Similarly, the results from the Black-White casual condition revealed that participants associated the Black man more strongly with threat (D=.21, SD=.35, p<.01) as reported in Table 1. A means comparisons test revealed no significant difference between the means of the Black-White professional and casual conditions. These findings replicate those from Study 1 and suggest that regardless of attire, Black men are more strongly associated with weapons when compared to White men.
Mean IAT Effects (D-score and Standard Deviations) Across Conditions for Study 2

Notes: All D score IAT effects are significantly different than zero at p<.01. P-values report comparisons of D score means across conditions.
a Higher positive numbers show stronger associations of Black men with weapons.
b Higher positive numbers show stronger associations of casual dress with weapons.
Perceptions of threat from Clothing Attire IATs. Contrary to our expectations, Table 3 shows that Black professionally-dressed men were associated more with weapons than casually dressed Black men (D=−.26, SD=.43, p<.01) and White professionally dressed men were associated more with weapons than casually-dressed White men (D=−.58, SD=.31, p<.01). Thus, we do not find support for the Respectability Hypothesis (H2). Furthermore, the D-score for White men is double that for Black men (p<.01), indicating the association of weapons with professional attire is stronger for White men than for Black men. This suggests that professional dress increases perceptions of White men’s threat more than professional dress increases perceptions of Black men’s threat.
Correlations between explicit and implicit measures. We tested the correlation between the IAT results of each condition and the ATBM scale. Similar to Study 1, the Racial Bias IAT effects and the ATBM (the explicit measure of positive attitudes about Black men) were not correlated (Black-White Casual Condition r=−.10, p>.1; Black-White Professional Condition r=.26, p>.10). However, we do find a significant correlation between the Clothing Attire IAT effect in the professional-casual White condition and the explicit measure of ATBM (r=.52, p<.05). As implicit bias against professional dress increases in the White condition, explicit positive attitudes about Black men increases. To further understand this finding, we examined the correlations between the subscales of the ATBM and the IAT effect of the professional-casual White condition. We found that the correlation between the ATBM and the IAT effect was largely being driven by a positive and large correlation between the intelligence subscale and the IAT effect (r=.72, p<.001).Footnote 5 In other words, as belief that Black men are intelligent increases so does bias against professionally dressed White men.
Discussion
Due to the null effect of clothing attire on racial bias from Study 1, we directly compared Black and White men dressed both professionally and casually to their racial in-group in Study 2. Similar to Study 1, we found support for the Racial Bias Hypothesis. In addition to replicating the findings from the previous study, the goal was to test whether comparisons within race would reveal a lesser association of threat with professionally dressed Black men. However, we did not find support for the Respectability Hypothesis and the results pointed to a strong association of professionally dressed Black and White men with threat. These results may be indicative of different types of threat that are unique to professionals—particularly, the threat inherent in being afforded more power and status in society. Furthermore, because White men are more likely to be stereotyped in professional roles like businessmen, it follows that the association of threat with professional dress would be stronger for that group. As stated previously, White businessmen are associated with traits of power, wealth, and success (Hinzman and Maddox, Reference Hinzman and Maddox2017). An alternative and complementary interpretation of these findings is that the college student sample’s greater familiarity with casual dress may cause them to find that attire less powerful and, in turn, less threatening than the professional attire. This familiarity with the casually dressed man may be amplified for the men in the sample because men are used as the stimuli in the study. Regardless of whether the underlying cause is a fear of powerful men or a familiarity with casually dressed men, the implications are still the same—that professional dress is being associated with threat/danger. However, we are not able to parse out the ways in which this threat of professional dress is similar to or different from the threat of violence associated with Black men.
With respect to the stronger effect sizes in the White as compared to the Black professional-casual condition, it is noteworthy that we only found a significant correlation between the implicit bias towards professional dress and explicit positive attitudes about Black men in the White condition. Because the intelligence subscale is also highly correlated with the IAT effect in that condition, it seems that positive attitudes about Black men—particularly ones that counter one of the most pernicious and familiar negative stereotypes about Black men (i.e., that they are less intelligent)—are related to negative implicit attitudes about White professionally dressed men. While we can’t be certain why we find this, it may be that those who explicitly reject anti-Black racism have negative reactions to powerful White men because of their historical (and modern-day) role in perpetuating White supremacy and racism. Given that the sample is composed of college students who dress more casually, are more likely to explicitly reject racist stereotypes (Schuman et al., Reference Schuman, Steeh, Bobo and Krysan1998), and are too young to have worked very much in settings that require professional dress, these findings may be unique to the sample. To illuminate the results from Study 2 further, we replicated the studies using a non-college student sample of participants and added two additional conditions in Study 3.
Study 3
Study 2 provided evidence that professional clothing is seen as threatening, especially when worn by White professionals. Next, we further explored these findings by varying race and attire in each condition to test, primarily, whether White professionals are seen as more threatening than casually dressed Black men. These new conditions are labeled the Black professional/White casual condition and the Black casual/White professional condition. In Study 3, we aimed to replicate the findings from Study 1 and 2 and test the interaction of race and attire with threat using a non-college student sample.
Participants and Procedure
The participants were 154 men, 110 women, and one non-binary person (Mage=38.36, SDage=10.94) recruited via Amazon’s Mechanical Turk website (M-Turk 2016). Amazon M-Turk is an online platform where researchers host tasks for M-Turk workers, who come from a variety of backgrounds, to participate. Workers were compensated just over minimum wage for their participation. Participants followed a link to complete the study. Among participants, 74.41% self-identified as White, 13.95% as Black/African American, 5.42% as mixed-race, 3.87% as Asian, 1.93% as Native American, and 0.42% declined to respond. Those who identified as Hispanic of any race accounted for 14.33% of the sample. Participants completed a questionnaire and were randomly assigned to one of six Race-Attire Weapons IAT conditions.Footnote 6
Measures
Similar to Study 1 and Study 2, we measured association with threat using the Weapons IAT. Participants were randomly assigned to complete one of six experimental conditions. In each condition, participants completed the Attitude toward Black Males scale prior to taking the IAT. We added two conditions to the four conditions from Study 2 (Racial Bias IAT and Clothing Attire IAT) to assess whether professional attire is associated with greater threat than Black men. These conditions are labeled as the Black professional/White casual condition and the Black casual/White professional condition. The labels used in the IAT were “Black American”/ “White American” as well as “Harmless object”/ “Weapon”. As in Studies 1 and 2, all images remained the same and the order of stereotypical and counter-stereotypical blocks was counterbalanced. A positive IAT effect in the two additional conditions indicates stronger associations of Black men with weapons (as compared to either a professionally dressed or casually dressed White men, depending on the condition).
Results
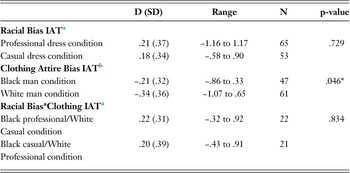
Perceptions of threat from Racial Bias IATs. Table 4 shows that in the Black-White casual condition, we found a small association of Black men with weapons (D=.18, SD=.34, p<.01) and in the Black-White professional condition, we found a small association of Black men with weapons (D=.21, SD=.37, p<.01). We also did not find a statistically significant difference across the two conditions (p>.1). These findings mirror the results from both Study 1 and Study 2 in that Black men are perceived as more threatening regardless of attire, supporting the Racial Bias Hypothesis (H1).
Mean IAT Effects (D-score and Standard Deviations) Across Conditions for Study 3

Notes: All D score IAT effects are significantly different than zero at p<.01. P-values report comparisons of D scores means across conditions.
a Higher positive numbers show stronger associations of Black men with weapons.
b Higher positive numbers show stronger associations of casual dress with weapons.
Perceptions of threat from Clothing Attire IATs. Professionally dressed men in the White professional-casual condition are moderately associated with weapons (D=−.34, SD=.36, p<.01). Black professional men are also moderately associated with weapons in the Black professional-casual condition (D=-.21, SD=.32, p<.01) as demonstrated in Table 4. As in Study 2, we find that the association of weapons with professional attire is stronger for White men than for Black men (p<.05).
Perceptions of threat based on Racial Bias*Clothing Attire IATs. The Black professional/White casual condition revealed a small association of Black professional dress with weapons (D=.22, SD=.31, p<.01). In the Black casual/White professional condition, there was a similarly small association of Black men with weapons (D =.20, SD=.39, p<.01). These results demonstrate, when compared to a White man wearing another dress style, that Black men are still more strongly associated with weapons. This gives further support to the Racial Bias Hypothesis.
Correlations between explicit and implicit measures. We find no evidence of a correlation between the ATBM scale and the IAT results for any of the conditions of the study. The statistical values for the conditions are as follows: Professional-Casual Black condition (r=-.27, p>.10); Professional-Casual White condition (r=.12, p>.10); Black-White Casual condition (r=-.16, p<.10); Black-White Professional condition (r=-.22, p>.10); White/Casual Black/Professional condition (r=-.12, p>.10); White/Professional-Black/Casual condition (r=-.09, p>.10).
Discussion
As in Study 1 and 2, we found support for the Racial Bias Hypothesis, which highlights the robustness of the finding, especially given that it was tested in a multitude of ways.Footnote 7 Additionally, the finding that professional dress is associated with threat is also supported in both Study 2 and 3. In Study 3, we sought to illuminate how threat would be perceived when comparing Black and White men dressed differently from each other. Although the Black man was dressed casually and casual dress was shown less bias in Studies 2 and 3, the casually dressed Black man was still associated with threat as compared to the professionally dressed White man. This provides further evidence to the strength of the Racial Bias Hypothesis. In fact, this IAT effect was not significantly different than the Black-White professional- and casual-dress conditions. The explicit and implicit measure was not significantly correlated, which was different from Study 2 where we found a significant and strong correlation between the implicit and explicit measures in the professional-casual White condition. This difference across studies may be because the college student sample more strongly associated racial bias with powerful, White men than the M-Turk sample.
CONCLUSION
The purpose of this study was to empirically test whether professional attire actually weakens the perception of threat toward Black men as suggested by respectability politics. Our findings suggest that racial bias underlies the perceived threat of Black men, and that clothing is not a contextual factor that attenuates this implicit bias. Studying this question using an IAT allowed us to measure associations of professionally dressed Black men with threat while reducing the effects of social desirability that arise in explicit measures like surveys. However, we do not make claims that this implicit racial bias will always result in negative behavior toward Black men. Instead, we suggest that there may not be large reductions in racial bias demonstrated toward professionally dressed Black men as public discourse suggests.
Kahn and Davies (Reference Kahn and Davies2017) found that contextual factors like attire reduced the likelihood that unarmed professionally dressed Black men would be shot. Why didn’t we find that clothing attire affected implicit associations of Black men with threat? We suspect it is due to differences between the IAT and the first-person shooter task. Lois James and colleagues (Reference James, James and Vila2016) found, similar to our study, that while police officers had an implicit bias against Black men in the race-weapons IAT, this bias was not apparent in the results of the first-person shooter task. The IAT aims to gather information about the subconscious by measuring automatic, uncontrolled reactions while the first-person shooter tasks require participants to consciously make a decision to shoot or not shoot. The aforementioned findings do not contradict each other, but together they create nuance into this research question. While hundreds of studies have contributed important knowledge about unconscious bias (Kurdi et al., Reference Kurdi, Ratliff and Cunningham2020), there remains much to understand about how implicit biases among individuals shape broader patterns in society.
While these studies add to the growing literature on contextual cues and racial bias, it is necessary to be careful about overstating our findings. Whether professional dress protects Black men from behavioral harm is beyond the scope of this paper. Instead, our findings speak to whether professional dress reduces the automatic association of Black men with threat. We cannot conclude that if Trayvon Martin had been dressed professionally that he would not have been killed, but our findings suggest that on average, as a young Black man, he would have been associated with threat regardless of how he was dressed.
The perception of Black men as threatening has serious consequences ranging from being labeled as criminal to even death. There has been public discourse about how this relates to the criminal justice system, namely policing and sentencing. However, it is equally important to understand how those who are not involved in the criminal justice system perceive Black men because they are often the ones who decide whether or not to engage police officers. For example, there has been increased media attention focused on White women who have called the police on Black people participating in activities that are seemingly innocent like barbecuing, selling bottled water, and entering their own apartment (Noori Farzan Reference Farzan and Antonia2018). In these situations, police only become involved after being notified by a person who perceives some form of threat. Yet, when those perceptions are shaped by implicit racial bias rather than a legitimate cause, Black people may be harmed as a result. While respectability politics have proposed changing the outward behaviors of Black people as a means to reduce the perception of threat, there is not enough evidence to prove that this actually diminishes implicit perceptions of threat. Therefore, it is necessary that all people—not just police officers— develop strategies for overriding implicit biases (see Devine et al., Reference Devine, Forscher, Austin and William2012) before they engage in behavior that could harm Black men and women. Respectable dress has been offered as a means to weaken biased attitudes towards Black men in popular discourse under the assumption that these styles are “safe” and provide evidence of higher social class and status. Yet, our findings reveal that professional attire is more strongly associated with threat than casual dress. These findings were unexpected, but we can offer several possible explanations to explore in future research. First, the majority of participants did not work in settings where they are surrounded by professionally dressed men. Given that professional dress is associated with higher status and power, the participants’ unfamiliarity with professional dress and preference for casual dress styles may have triggered them to perceive professional attire as more threatening than casual dress, regardless of the race of the man.
Another related possibility is that our different IATs captured qualitatively different types of threats despite using the same stimuli. In other words, when participants completed the Clothing Attire IAT, stereotypes about Black businessmen as high in power and status may have undergirded stronger implicit associations of professional dress with threat (as compared to casual dress). However, when participants completed the Racial Bias IAT, stereotypes about Black men as physically threatening and dangerous may underlie stronger associations of Black men with threat than White men. In support of the Racial Bias Hypothesis, we found no differences in the magnitude of bias across professional and casual dress conditions in the Racial Bias IATs in Studies 1, 2, or 3. This interpretation is consistent with research on subgroup stereotypes about Black Americans showing that there is little overlap between general stereotypes about Black individuals and specific subgroup stereotypes about Black businessmen (Devine and Baker, Reference Devine and Baker1991; Hinzman and Maddox, Reference Hinzman and Maddox2017). Whereas the general category, Black men, is associated with stereotypes such as hostile, lazy, and negative, Black businessmen are not associated with those stereotypes (Devine and Baker, Reference Devine and Baker1991; Hinzman and Maddox, Reference Hinzman and Maddox2017). Furthermore, the fact that the magnitude of bias against professionally dressed men was significantly greater for White men than for Black men in Studies 2 and 3 is consistent with the evidence that White businessmen are viewed as more powerful and successful than Black businessmen and White people more generally (Hinzman and Maddox, Reference Hinzman and Maddox2017).
It is also possible that the association of professional dress with threat was stronger with White men than with Black men because of cultural representations in media of professional killers, hitmen, or even negative representations of powerful White men like Donald Trump. The larger point to draw is that professional dress may not reduce associations of Black men with threat if it introduces a qualitatively different form of threat related to having power. Still, further research is needed to disentangle how the perceived threat of Black men differs from the perceived threat of professional dress.
Methodologically speaking, differences in the stereotype content of White and Black Americans and White and Black subgroups (e.g., professionals) may be masked by IAT results that can capture the existence of unconscious bias but not the precise nature of it. The IAT tells us something about unconscious reactions and there is recent evidence that they tell us something about why status beliefs guide unequal behavior (Melamed Reference Melamed, Munn, Barry, Montgomery and Okuwobi2019) but there is much to understand about how unconscious processes shape behavior. While controversies persist about the IAT, proponents (e.g., Kurdi et al., Reference Kurdi, Ratliff and Cunningham2020) and critics (e.g., Oswald et al., Reference Oswald, Mitchell, Blanton, Jaccard and Tetlock2013) agree that understanding the behavioral consequences of implicit biases requires more rigorous research.
These findings also tentatively point to a need for a de-emphasis on respectability politics in the media and by community members. Respectability politics are proposed as a way to counter the notion that Black men are threatening. This is exemplified in a 2011 speech by former African American mayor of Philadelphia, Michael Nutter. He states:
If you want all of us—Black, White, or any other color—if you want us to respect you…if you want us not to be afraid to walk down the same side of the street with you…if you want somebody to offer you a job or an internship somewhere…then stop acting like idiots and fools, out in the streets of the city of Philadelphia…And another thing, take those doggone hoodies down, especially in the summer…pull your pants up” (Harris Reference Harris2014, p. 35).
While suggestions to “dress for success” or “pull up your pants” may be well-intentioned, they perpetuate the narrative that this will cause Black men to be seen as less threatening. One cultural consequence of focusing on respectability bias is that as a form of colorblind racism, it makes it more socially acceptable to make decisions that are racially biased (e.g., to hire and promote White men over Black men, cross the street when passing a Black man, enforce laws more stringently in Black neighborhoods, etc.) and couch them in the coded language of respectability (Bonilla-Silva Reference Bonilla-Silva2018; Obasogie and Newman, Reference Obasogie and Newman2016). Respectability politics also serve to delegitimize Black boys and men as victims. Many of the unarmed Black boys and men shot by police have been painted by the media as partly culpable in their deaths (Obasogie and Newman, Reference Obasogie and Newman2016). Even when the media highlights their victimhood, it is done through a frame of respectability by highlighting their academic achievement and potential, resulting in a narrative that only certain lives deserve to be mourned (Obasogie and Newman, Reference Obasogie and Newman2016).
Efforts to reduce a threatening perception should refocus on those who behave in biased ways at the expense of Black men’s safety by unnecessarily calling the police, for example. Studies have shown that this can be accomplished through repeated and meaningful interracial interactions with same status out-group members as well as exposure to positive information about that group (Lai et al., Reference Lai, Marini, Lehr, Cerruti, Shin, Joy-Gaba, Ho, Teachman, Wojcik, Koleva, Frazier, Heiphetz, Chen, Turner, Haidt, Kesebir, Hawkins, Schaefer, Rubichi, Sartori, Dial, Sriram, Banaji and Nosek2014). Instead of privileging White forms of self-presentation, we should focus on reducing cultural associations of threat with Black men. The overrepresentation in the media of Black men as perpetrators of crime relative to crime statistics results in a skewed notion as to who commits the majority of crimes (Dixon Reference Dixon2007). Thus, fair media representation is one solution, but consistent racial bias training with law enforcement, mentors, and store associates who are in frequent contact with Black men may also be effective.
While this sample is not representative of the larger population and is not generalizable, its utility lies in the ability of experimental methods to test theory. To the extent that these findings uncover a process, we are able to generalize that process to the larger population even if the sample is not representative (Zelditch Reference Zelditch and Etzioni1969). The small number of racial minorities in each sample resulted in an inability to perform robust analysis on the implicit beliefs of people of color. Additionally, this research is not able to capture the evaluative process involved in attaching a stereotypical perception of threat to Black men. Despite these limitations, our study is important for showing that Black men are implicitly associated with threat because the consequences of falsely perceiving a Black man as threatening may have serious and deadly results.