Introduction
The enormous energy needs of modern society pose some of the most vexing problems facing mankind today. It is essential to the health of our economy and our climate that we develop alternatives to fossil fuels, as well as new means for storing and conserving energy in renewable and economically viable ways. It is not enough to simply engineer existing technologies to solve these difficult challenges. For instance, to manufacture enough crystalline silicon solar cells to supply the world’s energy would consume roughly the entire global GDP.Reference Lewis1 Instead, revolutionary innovations in technology are required so that solar cells, fuel cells, and other energy devices can be manufactured cheaply and on a massive scale, while maintaining high performance.
New materials will drive the revolution in energy technology. In particular, nanomaterials with tunable structure, porosity, and composition hold tremendous promise. Atomic layer deposition (ALD) provides the capability to synthesize nanomaterials literally at the atomic level. ALD utilizes self-limiting chemical reactions to achieve atomic-level control over film thickness and composition without the need for line-of-site access to the precursor source.Reference Ritala, Leskelä and Nalwa2, Reference George3 As a result, ALD could play a key role in achieving the breakthroughs in materials synthesis necessary to solve our energy problems.
This article will survey recent work in the field of ALD for clean energy, including research and development in fuel cells, batteries, photovoltaics, and catalysts. This is not a comprehensive review,Reference Ritala, Leskelä and Nalwa2–Reference Rolison, Long, Lytle, Fischer, Rhodes, McEvoy, Bourga and Lubers4 but rather a set of examples illustrating the advantages afforded by ALD in nanomaterials for energy, intended to encourage the reader to pursue these topics more deeply. In the following sections, we will emphasize the particular attributes of ALD (e.g., conformality and thickness control) that make this technology attractive for particular applications.
ALD for solid oxide fuel cells
A fuel cell is an electrochemical device that directly converts chemical energy into electrical energy, which can be used to perform work on an external load. Fuel cells have the potential to achieve high efficiencies to provide a scalable, clean power supply. A basic fuel cell consists of an ion-conducting electrolyte, which separates the anode (fuel side) and cathode (oxidant side) of the cell. In addition, catalysts are often incorporated into the electrode structures to facilitate charge transfer reactions during operation.
Among fuel cell types, solid oxide fuel cells (SOFCs) are attractive due to fuel flexibility, nonprecious metal catalysts, minimal fuel crossover, and high efficiencies. SOFCs incorporate a ceramic electrolyte, and therefore typically operate at elevated temperatures (>700°C) to achieve sufficient ionic conductivities. However, the high temperature requirements limit their application to large, stationary sources. Therefore, many research efforts are focused on intermediate-temperature SOFCs (IT-SOFCs), which operate below 600°C, to extend their use to transportation and portable applications.
Fuel cell challenges
The major loss mechanisms in fuel cells are activation losses due to sluggish reaction kinetics, ohmic losses due to ionic transport through the electrolyte, and mass transport losses at high operating currents. Neglecting mass transport and electrical resistance losses, the voltage (V cell) versus current density (j) relationship for a fuel cell can be expressed asReference O’Hayre, Cha, Colella and Prinz5

where V oc is the thermodynamic open-circuit voltage, η act is the activation overpotential, and ASR is the area-specific resistance of the electrolyte. The activation overpotential at sufficiently large currents can be approximated by the Tafel equation:
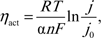
where R is the ideal gas constant, T is the temperature, n is the number of moles of electrons transferred, F is Faraday’s constant, α is the charge-transfer coefficient, and j 0 is the exchange current density. To minimize activation losses, a high j 0 is desired. This can be achieved by the use of a catalyst, increasing the number of reactant sites, or increasing the temperature.
To minimize ohmic losses, the ASR of a material should be reduced. The ASR is given by

where L is the electrolyte thickness, and σ is the electrolyte conductivity. As both σ and j 0 increase exponentially with temperature, operation of fuel cells at lower temperature requires the use of alternate strategies to minimize losses. ALD provides several advantages over other standard thin-film deposition or sintering techniques to achieve this goal through the ability to create ultrathin, pinhole-free films on nanostructured architectures with the ability to modify the chemical composition of surfaces.
SOFC electrolytes
The most common electrolyte material used in SOFCs is yttria-stabilized zirconia (YSZ), which conducts oxide ions through the presence of oxygen vacancies. While the conductivity of YSZ is generally considered too low for IT-SOFCs, when the electrolyte thickness is reduced to the nanometer scale, acceptable ASR values can be achieved at lower temperatures. To study the benefits of ALD for fabricating SOFC electrolytes, several groups have studied techniques to fabricate common oxide ion conducting materials. For a more comprehensive review of these processes, see Reference Reference Cassir, Ringuede and Niinisto6.
ALD of YSZ can be achieved through the use of alternating cycles of the standard ZrO2 and Y2O3 processes, as first demonstrated by Putkonen et al.Reference Putkonen, Sajavaara, Niinisto, Johansson and Niinisto7 and Bernay et al.Reference Bernay, Ringuede, Colomban, Lincot and Cassir8 Shim et al. developed a process to deposit YSZ by ALDReference Shim, Chao, Huang and Prinz9 using a Zr/Y pulse ratio of 7:1, resulting in films with a stoichiometry of 8 mol% Y2O3. The films consisted of nanocrystalline grains, with the YSZ crystal structure confirmed by x-ray diffraction without the need for subsequent annealing. To facilitate the study of SOFCs with nanoscale electrolytes, a microelectromechanical system fabrication process was developed to create freestanding, thin-film fuel cells with electrolyte thicknesses below 150 nm and sputter porous Pt catalysts to facilitate charge transfer.Reference Huang, Nakamura, Su, Fasching, Saito and Prinz10 Fuel cells fabricated with ALD YSZ electrolytes achieved a maximum power density of 270 mW/cm2 at 350°C. For comparison, similar fuel cells with 50 nm YSZ electrolytes deposited by radio frequency sputtering yielded a maximum power density of 130 mW/cm2 at 350°C, and cells with micron-scale thicknesses produced <1 mW/cm2.
The high power densities of nanoscale SOFCs were attributed to reduced ohmic losses due to electrolyte thickness and enhanced charge-transfer kinetics at the electrode-electrolyte interface. The conductivity of the ALD YSZ electrolyte was well matched to reference values for YSZ, while the j 0 values for the ALD fuel cell were four orders of magnitude larger than those of published YSZ-Pt data. The enhanced reaction kinetics were attributed to a fast oxygen reduction/exchange rate on the nanocrystalline grain structure of the ALD YSZ films.Reference Huang, Shim, Chao, Pornprasertsuk, Sugawara, Gur and Prinz11
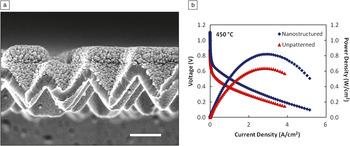
To demonstrate the full advantage of ALD for electrolyte fabrication, Su et al. developed 3D SOFC structures by using a Si mold fabricated using photolithography.Reference Su, Chao, Shim, Fasching and Prinz12 This mold was subsequently coated with ALD YSZ films, and the mold was removed, leaving a freestanding corrugated fuel cell architecture. This resulted in a fivefold increase in the electrochemically active surface area of the fuel cells and yielded an increase in the peak power density of the fuel cells to 677 mW/cm2 and 861 mW/cm2 at 400°C and 450°C, respectively. These values were enhanced by a factor of 1.5–1.9 compared to equivalent flat geometries. Chao et al. further illustrated this effect by using nanosphere lithography, in which self-assembled silica nanoparticles deposited by the Langmuir-Blodgett method are used as an etching mask to pattern a Si mold with a corrugated geometry without the need for expensive and slow photolithography steps.Reference Chao, Hsu, Cui and Prinz13 A scanning electron microscopy (SEM) image of the fuel cell structure is shown in Figure 1a. A maximum power density of 820 mW/cm2 and 1.34 W/cm2 was measured for fuel cells based on this process at 450°C and 500°C, respectively, as shown in Figure 1b. Impedance data suggest a decrease in activation losses due to the increase in active surface area.
(a) Scanning electron microscopy image of a corrugated solid oxide fuel cell fabricated by nanosphere lithography with an atomic layer deposition YSZ electrolyte. Scale bar = 500 nm. (b) Current-voltage curves for H2/air fuel cells at 450°C for nanostructured and unpatterned geometries. The use of ALD to create a 3D fuel cell structure led to an increase in the active surface area, resulting in improved performance compared to that for a flat geometry. Reprinted with permission from Reference Reference Chao, Hsu, Cui and Prinz13. ©2011, American Chemical Society.

In addition to oxide-ion conduction, proton-conducting electrolytes can also be fabricated by ALD. Park et al. observed evidence of proton conduction in ALD YSZ films at temperatures of 300–400°C.Reference Park, Kim, Shim, Kang, Gur and Prinz14 Secondary ion mass spectrometry measurements of these films suggested proton diffusion through the presence of protonic defects in ALD YSZ with significantly higher proton diffusion in ALD films than in single-crystal YSZ samples. In addition, Shim et al. developed an ALD process to deposit yttria-doped barium zirconate (BYZ).Reference Shim, Park, An, Gur, Kang and Prinz15 This material is known to be a proton-conducting perovskite when hydrated. H2/air fuel cells fabricated with this electrolyte achieved a maximum power density of 136 mW/cm2 at 400°C, which was two to three times higher than cells with BYZ thin films deposited by pulsed laser deposition.
Cathode kinetics
Due to the ability to create ultrathin electrolytes by ALD, ohmic losses are no longer the limiting factor in IT-SOFCs. Therefore, efforts to improve the cathode kinetics are of great importance to further enhance performance. One strategy to improve cathode performance is to use a mixed ionic-electronic conductor, which greatly increases the electrochemically active area, or triple-phase boundary. Holme et al. developed an ALD process to fabricate (LaxSr1–x)MnO3 (LSM) thin films by ALD.Reference Holme, Lee and Prinz16 This material was tested as a cathode on YSZ at 450°C, but a low power density of 0.2 μW/cm2 was recorded due to low oxide-ion diffusivity and oxygen reduction kinetics. However, there has been little research into cathode materials by ALD, leaving significant room for future improvements.
An alternate approach to improving the oxygen reduction kinetics in SOFCs is to modify the electrolyte surface at the cathode interface. ALD provides a unique advantage for this strategy due to its ability to modify the surface properties of a material by depositing ultrathin surface coatings. Chao et al. used this strategy to modify the surface of 8 mol% YSZ electrolytes with thin ALD YSZ layers incorporating various yttrium concentrations.Reference Chao, Kim and Prinz17 A 50% increase in performance was observed by coating the surface with a 1 nm thick layer of 14–19 mol% YSZ. This was explained by a higher oxygen vacancy concentration at the surface, leading to enhanced oxide ion incorporation without an increase in the bulk electrolyte conductivity.
Doped-ceria materials are also of interest on the cathode side of SOFCs due to higher conductivities and oxygen incorporation rates. ALD processes have been developed for gadolinia-doped ceria (GDC)Reference Gourba, Ringuede, Cassir, Billard, Paiviasaari, Niinisto, Putkonen and Niinisto18 and yttria-doped ceria (YDC).Reference Ballee, Ringuede, Cassir, Putkonen and Niinisto19 Recently, Fan et al. deposited YDC thin films by ALD on the cathode surface of a YSZ electrolyte.Reference Fan and Prinz20, Reference Fan, Chao, Hossein-Babaei and Prinz21 This interlayer enhanced the fuel cell performance by a factor of 2–3.6, which was explained by improved oxide ion incorporation kinetics. The ability to modify the surface properties of an electrolyte is an excellent example of the benefits of ALD for fuel cell performance.
Fuel cell catalysts
The decrease in operating temperature of IT-SOFCs creates a demand for more efficient catalysts. While high temperature SOFCs can use materials such as perovskites as catalysts, at lower temperatures, noble metals such as Pt still exhibit superior performance. Therefore, Pt ALD is a promising technology to create porous catalyst structures with high surface areas, while minimizing the total mass (and therefore cost) of the catalyst. Jiang et al. tested ALD Pt as a catalyst for IT-SOFCs on YSZ substrates.Reference Jiang, Huang, Prinz and Bent22 SOFCs incorporating ALD Pt catalysts achieved comparable maximum power densities to those using dc sputtered Pt, using only one-fifth as much Pt. Furthermore, the use of self-assembled monolayers to pattern the ALD Pt films exhibited benefits for current collection. The use of self-assembled monolayers allowed for the creation of a grid-patterned electrode, which served as a current collector as well as a catalyst, and led to an improvement of fuel cell performance when used as an SOFC cathode.
Another benefit of Pt ALD is the ability to coat complex topographies. This can be useful for 3D nanostructured architectures such as those described earlier, which benefit from an enhanced electrochemically active area. Shim et al. coated the surface of less-expensive metals, which were deposited by dc sputtering with a thin (~3 nm) coating of ALD Pt.Reference Shim, Jiang, Bent and Prinz23 This technique can be used to form a Pt alloy with the underlying metal and preserve the porous film morphology. These Pt-metal alloy catalysts performed similarly to pure Pt catalysts, suggesting the ability to further reduce the Pt loading at the catalyst.
Lithium-ion batteries
Efficient and durable electrical energy storage is a major factor limiting the widespread adoption of renewable energy. Lithium-ion batteries (LIBs) are very promising because of their relatively high energy storage density (~200 Wh/kg).Reference Marom, Amalraj, Leifer, Jacob and Aurbach24 However, this is still far below that of gasoline (~13,000 Wh/g). Furthermore, poor cycling stability (capacity fade) limits the useful lifetime of LIBs. The poor cycling stability is thought to result from interfacial phenomena, such as corrosion, oxidation, and recrystallization, at the electrode surfaces.Reference Xu and von Cresce25, Reference Myung, Hitoshi and Sun26 In LIBs, stability is intimately coupled to energy density because solving these interfacial problems would allow the use of higher capacity cathode and anode materials.Reference Marom, Amalraj, Leifer, Jacob and Aurbach24
ALD shows great promise for improving the interfacial stability of LIBs. For instance, the application of only ~3–4 Å of ALD Al2O3 improved the capacity retention of LiCoO2 cathode powders from 45% to nearly 90% after 120 charge-discharge cycles.Reference Jung, Cavanagh, Riley, Kang, Dillon, Groner, George and Lee27 Similar improvements were seen using ALD Al2O3 protective coatings on LiNi1/3Mn1/3Co1/3O2 cathode materials.Reference Riley, Van Ana, Cavanagh, Yan, George, Liu, Dillon and Lee28 Both of these studies observed that the discharge capacity and electronic conductivity depended strongly on the film thickness. The discharge capacity of the LiCoO2 cathode powders dropped from ~130 mAh/g at 6 ALD Al2O3 cycles to only ~20 mAh/g at 10 cycles. This strong dependence underscores the need for ALD, as both exquisite thickness control and complete conformality over the cathode powder are required. Even more dramatic performance enhancements were seen when ultrathin ALD Al2O3 coatings (~6 Å) were applied to natural graphite anodes.Reference Jung, Cavanagh, Riley, Kang, Dillon, Groner, George and Lee27 In this case, the capacity retention after 200 charge-discharge cycles at 50°C increased from 26% without the ALD coating to 96% using only five ALD Al2O3 cycles. The mechanism for these performance enhancements is not known, but may result from reduced corrosion, inhibition of phase changes, or reduced decomposition of the organic electrolyte.
The previous examples illustrate how ALD post-treatment can significantly improve the performance of existing LIB materials. Additionally, ALD opens the possibility of novel LIB architectures with dramatically improved performance through templated synthesis. One can imagine depositing a series of thin, conformal ALD layers onto a nanoporous scaffold to form the cathode, electrolyte, anode, and protective layers for a LIB. Such devices might yield faster cycling and higher capacities as a result of more rapid Li diffusion through the nanoscale layers. In addition, nanoscale composites composed of functional components embedded in a compliant matrix could accommodate mechanical stress from cycling, leading to longer lifetimes. To realize such a device, ALD processes must be developed for Li-containing materials. This task has proved challenging because these films are often air-reactive and hygroscopic, but nevertheless progress is being made.Reference Aaltonen, Alnes, Nilsen, Costelle and Fjellvag29, Reference Putkonen, Aaltonen, Alnes, Sajavaara, Nilsen and Fjellvag30
Photovoltaics
Technological breakthroughs are needed to reduce the manufacturing cost of photovoltaics (PVs) before they can be considered a viable means for supplying the world’s energy needs. A majority of the manufacturing cost (72%) for crystalline silicon solar cells is spent to produce the extremely pure “solar grade” silicon wafers needed to achieve high efficiency.Reference Alsema and De Wild-Scholten31 Such high purity is necessary to eliminate defects that trap photogenerated charge carriers before they can be collected. In contrast, nanostructured solar cells utilize thin layers arranged in a folded geometry to simultaneously achieve a long optical path for complete solar absorption and a short diffusion path for the efficient collection of photogenerated charge carriers. In this way, acceptable power efficiencies can be realized without the need for expensive, high purity, highly crystalline materials.
ALD is an ideal technology for fabricating nanostructured solar cells because it yields precise, conformal coatings on high-aspect-ratio templates needed for building such devices. Reijnen and co-workers provided an early demonstration of ALD for fabricating nanostructured PVs by fabricating 3D solar cells using a TiO2 nanoparticle matrix infused with successive ALD layers (2 nm Al2O3, 10 nm InS, and ~50 nm CuInS to fill the voids).Reference Reijnen, Feddes, Vredenberg, Schoonman and Goossens32 The resulting devices exhibited an efficiency of 4%—too low for commercialization (≥10%), but a promising starting point for optimization. This strategy made use of the conformality and broad materials palette of ALD to enable fabrication of these novel devices.
Dye-sensitized solar cells
The dye-sensitized solar cell (DSSC) is a type of nanostructured solar cell that uses organic dyes as photosensitizers attached to a wide bandgap semiconductor such as TiO2 or ZnO.Reference Gratzel33 The semiconductor is fashioned into a high surface area, nanoporous photocathode and immersed in a liquid electrolyte. When the dye molecules absorb visible light, they inject photoelectrons into the conduction band of the semiconductor. One problem limiting DSSC performance is charge recombination at the electrolyte-semiconductor interface. ALD offers a potential solution to this problem in the form of thin, conformal dielectric layers over the semiconductor. In one study, ALD Al2O3 and TiO2 were used to coat ZnO nanorod DSSCs.Reference Law, Greene, Radenovic, Kuykendall, Liphardt and Yang34 The authors found that ultrathin ALD Al2O3 layers (<1 nm) virtually eliminated interfacial charge recombination, but at the expense of greatly reduced efficiency due to the much slower charge injection through the insulating Al2O3. On the other hand, ALD TiO2 improved virtually all performance metrics of the ZnO nanorod devices (increased short circuit current, open-circuit voltage, and fill factor and reduced dark current) so that a maximum efficiency of ~2% was achieved using TiO2 layers of ~20 nm thickness.
ALD can also be used to fabricate improved photocathode structures for DSSCs via templated growth. In conventional DSSCs, there might be desirable combinations of photocathode nanostructure and physical properties that are not available because both traits are dictated by the choice of materials. Instead, one can select an optimal template without worrying about the composition, because the desired materials can be added later using ALD coatings. This approach was used to fabricate DSSCs starting from silica aerogel templates and depositing either ALD ZnO or ALD TiO2 layers to impart the desired semiconducting properties.Reference Hamann, Martinson, Elam, Pellin and Hupp35, Reference Hamann, Martinson, Elam, Pellin and Hupp36 Similarly, anodic aluminum oxide (AAO) has been used to template ZnO-based DSSCs, which exhibited record-high photovoltages as a result of efficient charge transport through the nominally 1D ZnO nanotubes.Reference Martinson, Elam, Hupp and Pellin37
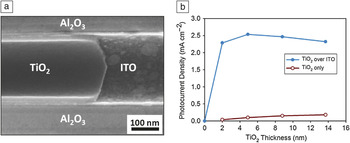
In a conventional DSSC, photoelectrons need to diffuse through the entire thickness of the semiconducting photoanode (40–100 microns) before they are collected. During this journey, many photoelectrons can recombine with holes in the electrolyte. However, by depositing a transparent conductor underneath the semiconducting TiO2, the electrons need only traverse the thickness of the TiO2 film (~10 nm) to be collected. To evaluate this possibility, DSSCs were fabricated using AAO templates by first depositing an ALD layer of transparent conducting indium tin oxide (ITO) followed by ALD TiO2.Reference Martinson, Elam, Liu, Pellin, Marks and Hupp38Figure 2a shows a cross-sectional SEM image of a single, 200 nm pore in the AAO, revealing the concentric ITO and TiO2 nanotubes. Figure 2b demonstrates that for all thicknesses of the TiO2 layer, the underlying ITO boosts the photocurrent density by up to 60 times. This clearly demonstrates the advantage of radial charge collection enabled by ALD. Thus far, templated ALD synthesis has not yielded devices with higher efficiencies compared to conventional DSSCs, but the viability of this approach is proven, and research in this area is ongoing.
(a) Cross-sectional scanning electron microscopy image of a TiO2 tube cleaved to reveal the indium tin oxide (ITO) tube beneath. The concentric tubes, grown by atomic layer deposition, are embedded in a ~60 μm long alumina pore. (b) Short-circuit photocurrent density for devices with (blue, closed circle) and without (red, open circle) 7 nm of ITO in the pores as a function of TiO2 tube wall thickness. Reprinted with permission from Reference Reference Martinson, Elam, Liu, Pellin, Marks and Hupp38. ©2008, American Chemical Society.

Quantum dot solar cells
Traditional single-gap solar cells are limited by thermodynamics to the ~32% Shockley-Queisser efficiency limit of photovoltaic energy conversion efficiency,Reference Shockley and Queisser39 and novel approaches are needed to achieve higher efficiencies. Quantum dots (QDs) provide several possible routes to exceed the single-gap limit, including hot-carrier extraction,Reference Tisdale, Williams, Timp, Norris, Aydil and Zhu40 multiple exciton generation,Reference Nozik41–Reference Sukhovatkin, Hinds, Brzozowski and Sargent43 and infrared absorption layers in multi-junction cells.Reference Sargent44, Reference Wang, Koleila, Tang, Liu, Kramer, Debnath, Brzozowski, Barkhouse, Levina, Hoogland and Sargent45 Among the potential QD materials, PbS has been extensively studied due to favorable properties such as a low bandgap (0.41 eV) and large Bohr exciton radius (~18 nm).Reference Dutta, Ho, Zhang and Stroeve46
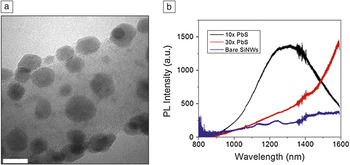
ALD provides several advantages for fabricating quantum confinement structures, including sub-nm precision in feature size, conformal coating of high-aspect ratio structures, and the ability to create size and chemical gradients. ALD processes have been developed for fabrication of PbSReference Leskelä, Niinisto, Niemela, Nykanen, Soininen, Tiitta and Vahakangas47, Reference Nykanen, Laineylijoki, Soininen, Niinisto, Leskelä and Hubertpfalzgraf48 using H2S as a sulfur source. Dasgupta et al. demonstrated the ability to tune the bandgap of PbS by controlling the number of ALD cycles.Reference Dasgupta, Lee and Prinz49 During the initial cycles, the nucleation of these ALD films proceeded by island growth, enabling the direct fabrication of QDs without need for further processing.Reference Dasgupta, Jung, Trejo, McDowell, Hryciw, Brongersma, Sinclair and Prinz50 This technique was used to coat the surface of Si nanowires (SiNWs) with a single layer of QDs shown in the transmission electron microscopy (TEM) image in Figure 3a, allowing for incorporation into light-scattering architectures for enhanced absorption and charge extraction. These QD-SiNW hybrid structures exhibited a blueshift in photoluminescence with a decreasing number of ALD cycles (Figure 3b), illustrating that the optical properties can be tuned precisely.
(a) Transmission electron microscopy image of a silicon nanowire (SiNW) coated with PbS quantum dots by atomic layer deposition (ALD). Scale bar = 10 nm. (b) Photoluminescence (PL) spectra for bare SiNWs (blue), 10 cycles of ALD PbS (black), and 30 cycles of ALD PbS (red). The ability to uniformly coat nanowires with a single layer of quantum dots allows for a unique way to tune the optical properties of these materials by simply controlling the number of ALD cycles. Reprinted with permission from Reference Reference Dasgupta, Jung, Trejo, McDowell, Hryciw, Brongersma, Sinclair and Prinz50. ©2011, American Chemical Society.

ALD can be used to encapsulate QDs with a thin inorganic layer, which can serve as the potential barrier for confinement and facilitate charge transfer between dots. Lee et al. encapsulated ALD PbS with ZnO and Al2O3 films and demonstrated a difference in bandgap variation by controlling the potential barrier height.Reference Lee, Dasgupta, Jung, Lee, Sinclair and Prinz51 Pourret et al. deposited ALD ZnO films on CdSe QD films, demonstrating an increase in the photosensitivity of the films, which was attributed to an increase in the mobility by two to three orders of magnitude.Reference Pourret, Guyot-Sionnest and Elam52 Lambert et al. coated CdSe QDs with thermal and plasma-enhanced (PE)-ALD Al2O3 and demonstrated that PE-ALD causes a loss of photoluminescence in the films, while thermal ALD successfully maintained the photoluminescence peak positions.Reference Lambert, Dendooven, Detavernier and Hens53 The combination of fabricating QDs directly by ALD and encapsulating them with ultrathin inorganic barrier layers suggests the potential for future QD photovoltaic devices that benefit from the many advantages of ALD.
Catalysts
Catalysts reduce the energy required to effect a chemical transformation and are essential for nearly all aspects of a clean energy economy. In energy production, catalysts are needed for converting biomass into liquid fuels. For energy utilization, they are required to split both hydrogen and oxygen in fuel cells. In energy storage, catalysts are needed to extract hydrogen from hydrocarbon feedstocks to store the chemical energy as H2. Finally, and perhaps most importantly, catalysts are critical for energy conservation. In the United States, 30% of all industrial energy is used for chemical production, and ~90% of all commercial chemicals are made using catalysts.Reference Ozokwelu, Porcelli and Akinjiola54 Consequently, improvements in catalyst performance can dramatically reduce energy consumption and the concomitant CO2 released from burning fossil fuels.
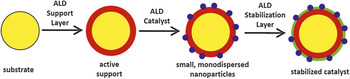
One advantage of ALD over conventional methods for making catalysts is the capability to produce nanostructures. Figure 4 illustrates this process beginning with an inert substrate such as a nanoporous solid, nanoparticle, or nanotube. First, ALD applies a chemically active support layer. ALD then deposits a uniform layer of catalytically active nanoparticles or other surface species. Finally, an ALD protective layer is deposited to stabilize the particles. In this way, any substrate having a preferred structure but lacking the correct surface chemical properties can be converted into the desired catalyst. In one example of this process, Feng et al. first coated nanoporous silica gel with 1–2 nm of either ALD Al2O3 or ALD ZnO to form a uniform and continuous support layer, which chemically modified the surface without altering the pore structure.Reference Feng, Elam, Libera, Setthapun and Stair55 Next, ALD Pd nanoparticles were deposited as the active catalyst. The ALD Pd supported by Al2O3 was found to be the most active Pd catalyst for methanol decomposition. The Pd supported by ZnO deactivated over time as a result of alloying between Pd and Zn, but one cycle of ALD Al2O3 performed after the Pd ALD was found to mitigate this effect.
Schematic illustration of catalyst synthesis by atomic layer deposition (ALD). Starting from an inert substrate with the desired nanostructure, a chemically active support layer is applied by ALD. Next, ALD is used to deposit a uniform layer of catalytically active nanoparticles or surface species. Finally, a protective stabilization layer is deposited by ALD to prevent sintering. In this way, any substrate having a preferred nanostructure and porosity can be converted into the desired catalyst.

The ability to stabilize catalysts using an ALD post-treatment is intriguing and reminiscent of the ALD interface layers used for LIBs. Lu et al. demonstrated that ALD Al2O3 “overcoats” could suppress sintering of Pd nanoparticles at temperatures as high as 500°C, where bare Pd agglomerated severely.Reference Feng, Lu, Stair and Elam56 Remarkably, the catalytic performance of the overcoated samples for methanol decomposition was preserved or even slightly enhanced. Spectroscopic measurements indicated that the ALD Al2O3 attached preferentially to defect sites on the Pd surface but left the catalytically active Pd(111) facets exposed. It is interesting to note that the defect sites are responsible for coke formation during methanol decomposition, and by covering them with ALD Al2O3, this unwanted side reaction was eliminated. This finding suggests that ALD post-treatment might provide an even more useful benefit besides stabilization: the capability to control the selectivity (branching ratio) of a catalytic reaction.
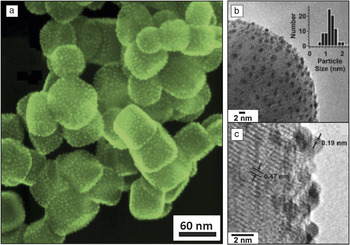
As illustrated previously for the PbS QDs, ALD can be used to form precise nanoparticles, and this capability is especially useful in catalysis where the size, composition, and dispersion of nanoparticles can profoundly influence the performance. Christiansen et al. showed that the size of Pt nanoparticles can be tuned in the range of ~0.5–2.5 nm by adjusting the number of ALD Pt cycles from 1–5.Reference Christensen, Elam, Rabuffetti, Ma, Weigand, Lee, Seifert, Stair, Poeppelmeier, Hersam and Bedzyk57Figure 5a shows a SEM image of 1.6 nm Pt nanoparticles supported on strontium titanate nanocubes and illustrates the uniform, high dispersion afforded by ALD. ALD also allows the composition of noble metals to be adjusted by controlling the relative number of cycles performed for each component.Reference Christensen and Elam58 This capability allowed Pt-Ru alloy nanoparticles to be synthesized; these nanoparticles exhibited ~3x higher methanol conversion compared to a physical mixture of pure Pt and Ru (Figure 5b and 5c).Reference Christensen, Feng, Libera, Guo, Miller, Stair and Elam59, Reference Feng, Elam, Libera, Pellin and Stair60 The uniformity of surface species prepared by ALD also extends to metal oxides. Feng et al. deposited ALD vanadium oxide in nanoporous alumina membranes and compared the catalytic behavior to specimens prepared by incipient wetness, a more conventional synthetic method using dissolved metal precursors. The ALD samples showed two to five times higher specific activities compared to the incipient wetness samples.Reference Feng, Elam, Libera, Pellin and Stair60 This performance boost reflected the better dispersion of the ALD samples, which consisted almost exclusively of catalytically active, monomeric vanadia.
(a) Scanning electron microscopy image of 2 nm atomic layer deposition (ALD) Pt nanoparticles uniformly dispersed on strontium titanate nanocubes. (b) Transmission electron microscopy image of 1.3 nm ALD Pt-Ru nanoparticles supported on Al2O3 nanospheres (inset shows histogram of particle sizes). (c) High-resolution transmission electron microscopy image of sample in Figure 5b revealing lattice fringes from nanoparticles and the substrate. Figure 5a is reprinted with permission from Reference Reference Christensen, Elam, Rabuffetti, Ma, Weigand, Lee, Seifert, Stair, Poeppelmeier, Hersam and Bedzyk57. ©2009, Wiley-VCH. Figure 5b and 5c are reprinted with permission from Reference Reference Christensen, Feng, Libera, Guo, Miller, Stair and Elam59. ©2010, American Chemical Society.

Conclusions and future outlook
Atomic layer deposition (ALD) is a powerful tool for advancing energy technologies because it provides a unique combination of attributes, including sub-nm precision, the capability to tailor surface properties, unparalleled conformality over high-aspect ratio and nanoporous structures, and the ability to create chemical and size gradients. In any energy device, the ability to precisely engineer nanoscale features enables large electrical, chemical, and electrochemical potential gradients. This, in turn, enables high mass and charge fluxes, enhanced reaction kinetics, and an increased density of active sites. Furthermore, ALD facilitates templated nanomaterials synthesis, and this capability decouples the physical structure of a material from the properties of the material, yielding greater flexibility in nanomanufacturing. Beyond the applications discussed here, ALD is also being investigated for other energy areas such as supercapacitors, solid-state lighting, and photolytic hydrogen production. Research and development in nanomaterials for energy applications is rapidly emerging as a major emphasis of ALD research due to these advantages, and future applications in renewable energy, energy storage, and energy efficiency will undoubtedly continue to expand in the coming years.
Acknowledgments
F.B.P. and N.P.D. acknowledge support from the Center on Nanostructuring for Efficient Energy Conversion (CNEEC) at Stanford University, an Energy Frontier Research Center funded by the U.S. Department of Energy, Office of Science, Office of Basic Energy Sciences under Award Number DE-SC0001060. J.W.E. acknowledges that the catalysis section of this work was supported as part of the Institute for Atom-efficient Chemical Transformations (IACT), an Energy Frontier Research Center funded by the U.S. Department of Energy, Office of Science, and Office of Basic Energy Sciences; the battery section was supported as part of the center for Electrical Energy Storage: Tailored Interfaces, an Energy Frontier Research Center funded by the U.S. Department of Energy, Office of Science, and Office of Basic Energy Sciences; and the photovoltaics section was supported as part of the ANSER Center, an Energy Frontier Research Center funded by the U.S. Department of Energy, Office of Science, Office of Basic Energy Sciences under Award Number DE-SC0001059.