


1. Introduction
The Trans-European Automated Real-time Gross Settlement Express Transfer System (TARGET2) is the Eurosystem’s mechanism for settling cross-border payments within the euro area. It operates under the joint management of the European Central Bank (ECB) and the National Central Banks (NCBs) of the euro area members. Through this system, interbank transactions are processed in real time, and the resulting net balances are recorded as claims and liabilities of the NCBs and the ECB vis-à-vis the Eurosystem. For simplicity, the term TARGET is used hereafter to refer to this system as a whole.
Figure 1 illustrates the TARGET balances of six Eurozone countries, namely Germany, Greece, Ireland, Italy, Portugal, and Spain, from January 2007 to December 2014. To account for differences in economic size across countries, each country’s TARGET balance is expressed as a percentage of its 2007 GDP, which corresponds to the period before the onset of the global financial crisis. The sample period in Figure 1 ends in 2014 because this year marks the onset of the post-crisis stabilization phase of the Greek sovereign debt crisis. By mid-2014, Greece had achieved a primary budget surplus and successfully re-entered international bond markets for the first time since 2010, signaling a turning point from acute crisis management toward gradual normalization. Sovereign spreads narrowed, TARGET imbalances stabilized, and capital flight pressures eased across peripheral Eurozone countries, making 2014 a natural cutoff point for analyzing the crisis dynamics.
TARGET2 Balances of Selected Eurozone Countries, 2007–2014 (as a Percentage of 2007 GDP).
Source: Euro Crisis Monitor (https://www.eurocrisismonitor.com/).
Note: This figure illustrates the TARGET2 balances of six Eurozone countries—Germany, Greece, Ireland, Italy, Portugal, and Spain—from January 2007 to December 2014. To account for differences in economic size across countries, each country’s TARGET2 balance is expressed as a percentage of its GDP in 2007, that is, prior to the onset of the global financial crisis. The TARGET2 balance data are obtained from the Euro Crisis Monitor website. The 2007 GDP figures are taken from the IMF World Economic Outlook database.

Figure 1 shows that TARGET balances were close to zero for all countries prior to the 2008–2009 global financial crisis. After the crisis, Germany emerged as the principal creditor country in the TARGET system, whereas Greece, Ireland, Italy, Portugal, and Spain became major liability countries. By the end of 2012, Greece’s TARGET liability was particularly pronounced, reaching about 43 percent of its GDP. This ratio was substantially higher than those of Ireland (40%), Italy (16%), Portugal (38%), and Spain (31%). During the same period, Germany’s TARGET claim rose to about 26 percent of its GDP.
Hans-Werner Sinn was among the first economists in Germany and the broader Eurozone academic community to draw attention to the rapidly increasing TARGET balances. The debate began with his article published in Wirtschaftswoche, a German business magazine, in 2011. Sinn later elaborated his argument in a series of working papers and in his monograph The Economics of Target Balances: From Lehman to Corona (Sinn Reference Sinn2020).
According to Sinn, the TARGET balances represent an implicit credit transfer within the Eurozone monetary system. When investors withdrew funds from countries such as Greece and Italy during the crisis, the resulting capital flight was automatically financed through the TARGET system, as the central banks of Germany and other claim members provided overdraft credit to their liability counterparts. These loans were not subject to market scrutiny and were not subject to conventional settlement or collateral constraints, implying that the ultimate risk could fall upon German taxpayers. Sinn therefore called for limits on TARGET balances, the introduction of collateral requirements (secured by government bonds or gold), or periodic settlement mechanisms to prevent the emergence of persistent deficits.
Sinn’s interpretation has not gone unchallenged, although the opposing views are far from uniform. For example, Winkler (Reference Winkler2018) has argued that hypothetical risk scenarios, such as the possibility of a member state leaving the euro, are often exaggerated and lack economic realism. In his view, the moral hazard concerns emphasized by Sinn are largely overstated, and the supposed risks embedded in the ECB’s balance sheet are minimal, if they exist at all.
Both Sinn’s critique and its subsequent rebuttals share a common focus on the risks and structural characteristics of the TARGET system rather than on its potential macroeconomic benefits. Against this background, scholars such as Michael Bordo (Reference Bordo2014) and Harold James (Reference James2012) have emphasized a different perspective: the TARGET mechanism, far from being a source of instability, performs a vital stabilizing function within the monetary union. Both authors draw attention to the parallels between TARGET and John Maynard Keynes’s proposed International Clearing Union. In their view, the automatic provision of liquidity through TARGET represents a partial realization of Keynes’s vision of an international payments system that prevents destabilizing adjustments and deflationary spirals. As James (Reference James2012) observes, when private capital flows to deficit countries such as Greece and Italy abruptly reversed during the sovereign debt crisis, the Eurosystem continued to finance their imbalances automatically through TARGET, achieving what Keynes had envisioned as “automatic and non-discretionary financing of imbalances.” Bordo (Reference Bordo2014) similarly regards TARGET as “a successful institutional innovation that prevented a repeat of the 1930s payments crisis.” Building on this Keynesian interpretation, this paper uses the case of Greece to explore how TARGET mitigated the impact of a sudden stop in capital inflows. By tracing how liquidity was maintained through the Eurosystem’s internal settlement mechanism, we aim to assess, in a concrete and quantitative way, the extent to which the Keynesian ideal of a clearing union has found partial institutional realization within the European Monetary Union.
However, the comparison between TARGET and Keynes’s International Clearing Union should not be interpreted too literally. More recent studies emphasize that, although TARGET exhibits important operational similarities to Keynes’s clearing framework—particularly in its automatic financing of imbalances and non-discretionary liquidity provision—it differs substantially from the broader institutional architecture envisioned by Keynes (Steil Reference Steil2013; Eichengreen Reference Eichengreen2026). In this sense, TARGET may be viewed as a partial institutional realization of some of the clearing mechanisms underlying the ICU proposal, rather than a direct implementation of Keynes’s original plan.
In particular, Keynes’s ICU was conceived as a supranational clearing union built around an international unit of account (bancor) while preserving national currencies and adjustable exchange rates. By contrast, TARGET operates within an irrevocable single-currency monetary union. Moreover, although the ICU framework envisioned explicit mechanisms to facilitate systemic adjustment, the Eurosystem does not impose formal adjustment requirements on either persistent creditor or debtor countries. TARGET therefore resembles Keynes’s framework primarily at the level of clearing operations and liquidity accommodation, rather than in its broader political and institutional design.
The closest related study to our work is the 2020 paper by Fagan and McNelis. However, there are several key distinctions. First, while Fagan and McNelis considered only two structural shocks—a technology shock and a world interest rate shock—our model, based on Mendoza’s original framework, also incorporates an imported input price shock. Second, Fagan and McNelis did not calibrate their model to Greek macroeconomic data; they relied on Mendoza’s parameters. In contrast, we directly calibrate our model to Greece’s pre-2007 data (1999–2007), reflecting the period before the crisis. Furthermore, when constructing counterfactual scenarios, they simply set the liquidity support parameter to zero to simulate the absence of the TARGET system. By contrast, we reconstruct a counterfactual scenario using actual Greek TARGET data, allowing us to more accurately simulate what would have happened without the system. Finally, we employ a piecewise solution method because it provides a computationally efficient and sufficiently accurate approximation.
Both our paper and Lee (Reference Lee2023) trace their roots back to the framework established by Ritschl and Ho (Reference Ritschl and Ho2025). However, our study differs from Lee’s in a few significant ways. First, we recalibrated the model parameters entirely, leading to a different set of parameter values compared to those in Lee (Reference Lee2023). We believe this recalibration helps improve the consistency of parameter specification relative to Lee (Reference Lee2023). Additionally, we focus our analysis on the period up to 2013 rather than extending it through 2022, as Lee does. This is because the influence of the TARGET system on Greece is most pronounced between 2010 and 2013, and we believe that focusing on the earlier period up to 2013 provides a clearer baseline for the counterfactual. We employ a different set of observables to recover the structural shocks. In particular, we focus on the capital-account-to-GDP ratio, which more accurately captures the impact of capital flows on the Greek economy. This variable provides a useful basis for identifying the shocks and constructing our counterfactual simulations. In sum, while both studies share a common foundational model, our recalibration and differing time focus lead to notable divergences in approach and findings.
Based on our simulation results, we find that first, without the liquidity support provided by the TARGET system, Greece’s economic situation would have deteriorated even more severely than what actually occurred. Second, relative to the actual path under the existing TARGET framework, labor input and output would have fallen much more sharply in 2011, while consumption would have declined more persistently throughout the crisis. Finally, our findings indicate that the TARGET system played a quantitatively important stabilizing role during the Greek crisis: absent this support, the contraction in economic activity would have been substantially deeper and the subsequent recovery markedly slower.
The structure of the paper is as follows. Section 2 introduces the TARGET system and discusses its role in the Greek debt crisis. Section 3 outlines the analytical framework, which adapts the models of Mendoza (Reference Mendoza2010) and Fagan and McNelis (Reference Fagan and McNelis2020). Section 4 presents the empirical results, including the calibration of model parameters, the reconstruction of the original data series, and the counterfactual simulation outcomes. Section 5 concludes and offers policy implications.
2. The TARGET system and its role in the Greek crisis
2.1 TARGET as a cross-border settlement mechanism
The TARGET system is the Eurosystem’s real-time gross settlement (RTGS) mechanism for processing cross-border payments within the Eurozone. The original TARGET system was launched in 1999 together with the introduction of the euro, while its second-generation platform, TARGET2, became operational in 2007. Operated jointly by the ECB and the NCBs of the member states, TARGET serves as the core payment infrastructure of the monetary union.
The mechanism can be illustrated using a payment from Greece to Germany. When a Greek depositor transfers funds to a German bank, reserves held by the Greek commercial bank at the Bank of Greece decline, while reserves held by the receiving German bank at the Bundesbank increase. Because the Eurosystem consists of legally distinct NCBs operating under a common currency framework, the transaction generates an intra-Eurosystem imbalance: the Bank of Greece records a TARGET liability, while the Bundesbank records a corresponding TARGET claim. These balances are automatically recorded within the Eurosystem balance sheet as part of the settlement process.
The macroeconomic significance of this mechanism becomes particularly important during periods of financial stress. Under a conventional fixed exchange rate regime, persistent payment deficits would normally lead to reserve depletion, monetary contraction, and external adjustment pressures. Within the Eurozone, however, TARGET allows payment imbalances to be financed through the Eurosystem’s balance sheet. As long as domestic banks retain access to central bank refinancing operations, cross-border payment outflows can continue even when private capital inflows collapse. Consequently, private capital outflows are transformed into TARGET liabilities rather than triggering an immediate contraction of domestic liquidity.
2.2 TARGET during the Greek sudden stop
The macroeconomic importance of the TARGET system became fully visible during the Greek sovereign debt crisis. Prior to 2009, Greece’s persistent current account deficits were largely financed through private capital inflows from the rest of the Eurozone. Greek banks relied heavily on cross-border interbank borrowing, while foreign investors continued to purchase Greek government and private-sector debt. The introduction of the euro effectively eliminated exchange rate risk within the monetary union, allowing peripheral economies such as Greece to borrow at interest rates close to those of the Eurozone core.
This financing structure collapsed after the global financial crisis and the subsequent deterioration of Greek sovereign solvency. As investors reassessed the sustainability of Greek public debt, private interbank lending to Greek banks deteriorated sharply, sovereign spreads widened, and foreign capital began to leave the country. At the same time, domestic depositors increasingly transferred funds from Greek banks to perceived safe-haven financial systems such as Germany and the Netherlands. Greek banks consequently experienced severe reserve losses and growing difficulties in obtaining market funding (Lane Reference Lane2012).
Under a conventional fixed exchange rate regime, such a sudden stop of private capital inflows would normally trigger rapid reserve depletion, credit contraction, and strong deflationary adjustment pressures. Declining asset prices and deteriorating balance sheets would further amplify financial distress, potentially culminating in systemic banking failure.
Within the Eurozone, however, the TARGET system fundamentally altered this adjustment mechanism. As private capital inflows disappeared, Greek banks increasingly replaced lost market funding through refinancing operations with the Bank of Greece and the Eurosystem. The liquidity created through these operations was subsequently transferred abroad through the TARGET system as depositors and investors moved funds out of Greece. Instead of forcing an immediate contraction of the domestic money supply, capital outflows generated a corresponding increase in Greece’s TARGET liabilities within the Eurosystem. In effect, TARGET automatically replaced missing private capital inflows with central bank liquidity.
This mechanism substantially softened the immediate macroeconomic consequences of the sudden stop. Although Greece still experienced a deep recession, the Eurosystem functioned as an internal financing mechanism that delayed and partially absorbed the external adjustment pressures generated by capital flight. From a broader historical perspective, this mechanism bears a close resemblance to the logic underlying Keynes’s proposal for an International Clearing Union. Keynes’s central concern was that deficit economies facing external financing shocks should not be forced into immediate deflationary adjustment through reserve depletion and collapsing domestic credit. During the Greek crisis, the TARGET system partially performed this stabilizing role by allowing payment imbalances to be financed automatically within the Eurosystem, thereby altering the transmission mechanism of the sudden stop itself.
2.3 Why this matters for the model
The institutional role of TARGET during the Greek crisis directly motivates the analytical framework developed in the next section. In our framework, TARGET liquidity enters as an endogenous offset to external financing stress. Rather than treating TARGET balances as a purely accounting phenomenon, the model interprets them as a mechanism through which Eurosystem liquidity partially substitutes for collapsing private capital inflows during a sudden stop. This interpretation follows a broader macroeconomic tradition in which central bank liquidity provision mitigates disruptions in private financial intermediation (Gertler and Karadi Reference Gertler and Karadi2011).
This mechanism is quantitatively important because liquidity provision affects the transmission of financial shocks through several interconnected channels. By relaxing funding pressures faced by domestic banks and borrowers, TARGET liquidity influences borrowing conditions and reduces the severity of collateral constraints. In turn, this affects asset prices, investment, labor demand, and consumption dynamics. Consequently, the presence of TARGET alters not only the magnitude of the crisis, but also the propagation mechanism of the sudden stop itself.
This interpretation connects the model to a broader macroeconomic tradition associated with Fisherian debt-deflation dynamics, collateral amplification, and Keynes’s vision of an international clearing mechanism. Keynes’s central concern was not merely the technical operation of international payments systems, but the prevention of abrupt external adjustment through reserve depletion and deflationary collapse. During the Greek crisis, the TARGET system partially performed this stabilizing role within the institutional structure of the Eurozone. The model developed below formalizes this mechanism and evaluates its quantitative importance for the Greek economy.
3. Analytical framework
The analytical framework employed in this paper originates from Mendoza (Reference Mendoza2010) and was subsequently extended by Fagan and McNelis (Reference Fagan and McNelis2020) to incorporate the TARGET mechanism. Ritschl and Ho (Reference Ritschl and Ho2025) correct some notation errors in Fagan and McNelis (Reference Fagan and McNelis2020) and apply the revised model to examine the effects of exorbitant privilege. The details of the model, separately documented to save space, are available from the authors. Here, we present only the model’s equilibrium conditions. The model is formulated in a real, flexible-price environment following Mendoza (Reference Mendoza2010), allowing us to isolate the role of financial constraints and liquidity provision. While introducing nominal rigidities would affect the persistence of adjustment, it would likely reinforce rather than weaken the stabilizing role of TARGET-type mechanisms. Accordingly, the results reported here can be interpreted as a conservative benchmark.
The model consists of fifteen equilibrium conditions, which together determine fifteen endogenous variables
 $\{c_{t},L_{t},v_{t},b_{t+1},{b}_{t+1}^{P},{b}_{t+1}^{G},k_{t+1},\chi _{t},\lambda _{t},\mu _{t},w_{t},{q}_{t}^{b},q_{t},i_{t},z_{t}\}$
. The model is a small open economy inhabited by a self-employed representative firm-household. Use
 $\theta _{t}$
to denote the time-varying discount factor, which can be rearranged as:
 \begin{equation}\theta _{t+1}=\vartheta \left(c_{t},L_{t}\right)\theta _{t}.\end{equation}
Equations (2)–(16) present the whole model. Equation (2) represents the marginal utility of consumption:
 \begin{equation}U_{c}\left(c_{t},L_{t}\right)=\chi _{t}\vartheta _{c}\left(c_{t},L_{t}\right)+\lambda _{t}\left(1+\tau \right),\end{equation}
where
 $c_{t}$
is consumption,
 $L_{t}$
is labor,
 $\chi _{t}$
is the Lagrangian multiplier on Equation (1),
 $\lambda _{t}$
is the Lagrangian multiplier on the firm-household’s budget constraint, and
 $\tau$
denotes the ratio of government expenditures to consumption, which is assumed to be constant. Equation (3) defines the labor-supply condition, equating the marginal rate of substitution between labor and consumption to the real wage
 $w_{t}$
.
 \begin{equation}w_{t}=-\frac{U_{L}\left(c_{t},L_{t}\right)-\chi _{t}\vartheta _{L}\left(c_{t},L_{t}\right)}{U_{c}\left(c_{t},L_{t}\right)-\chi _{t}\vartheta _{c}\left(c_{t},L_{t}\right)}=-\frac{\left[U_{L}\left(c_{t},L_{t}\right)-\chi _{t}\vartheta _{L}\left(c_{t},L_{t}\right)\right]}{\lambda _{t}\left(1+\tau \right)}.\end{equation}
Equation (4) describes the firm-household’s labor demand, where in equilibrium the marginal product of labor equals the effective cost of labor.
 \begin{equation}exp\left({\varepsilon }_{t}^{A}\right)F_{2}(k_{t},L_{t},v_{t})=\left\{\left(1+\tau \right)+\phi \left[\left(R_{t}-1\right)+\frac{\mu _{t}}{\lambda _{t}}R_{t}\right]\right\}w_{t}.\end{equation}
Note that
 ${\varepsilon }_{t}^{A}$
denotes a technology shock,
 $k_{t}$
is capital,
 $v_{t}$
is imported inputs,
 $R_{t}$
is the world gross interest rate, and
 $\mu _{t}$
is the Lagrangian multiplier on the collateral constraint to be introduced later. Working capital loans pay for a fraction
 $\phi$
of the cost of imported inputs and labor in advance of sales. When the collateral constraint is binding,
 $\mu _{t}\gt 0$
, implying that the effective cost of external borrowing for working capital, and consequently wages, increases.
Analogously, Equation (5) represents firm-household’s demand for imported inputs, where in equilibrium the marginal product of imported inputs equals their effective cost.
 \begin{equation}exp\left({\varepsilon }_{t}^{A}\right)F_{3}(k_{t},L_{t},v_{t})=\left\{1+\phi \left[\left(R_{t}-1\right)+\frac{\mu _{t}}{\lambda _{t}}R_{t}\right]\right\}p_{t}.\end{equation}
Here
 $p_{t}$
is the price of imported inputs and is exogenous. The firm-household issues real one-period international bonds, the prices of which are taken as exogenously given:
 \begin{equation}{q}_{t}^{b}=\frac{1}{R_{t}}\end{equation}
Here,
 $E_{t}$
denotes the expectation operator conditional on information at time
 $t$
. Equation (7) is derived from the condition that determines the optimal quantity of real one-period international bonds to be issued.
 \begin{equation}\lambda _{t}{q}_{t}^{b}=\mu _{t}{q}_{t}^{b}+\vartheta \left(c_{t},L_{t}\right)E_{t}\lambda _{t+1}\end{equation}
On the left-hand side of Equation (8) is the price of domestic capital
 $q_{t}$
, while the right-hand side represents the marginal cost of investment. In equilibrium, the two are equal. Here we use
 $i_{t}$
to denote total investment and
 $z_{t}=k_{t+1}-k_{t}$
to denote net investment. Equation (8) also implies that investment is an increasing function of
 $q_{t}$
. Net investment incurs a cost denoted by
 $\Psi ({z_{t}}/{k_{t}})$
.
 \begin{equation}q_{t}=1+\Psi \left(\frac{z_{t}}{k_{t}}\right)+\left(\frac{z_{t}}{k_{t}}\right)\Psi '\left(\frac{z_{t}}{k_{t}}\right)\end{equation}
Here,
 $\delta$
denotes the depreciation rate of capital. Equation (9) defines the price of domestic capital as the discounted value of the expected marginal return on investment. The equation also implies that when the collateral constraint is binding, such that
 $\mu _{t}\gt 0$
, the price of domestic capital declines.
 \begin{align}\lambda _{t}q_{t}&=\kappa \mu _{t}q_{t}\nonumber\\&\quad+\vartheta \left(c_{t},L_{t}\right)E_{t}\lambda _{t+1}\left\{exp\left({\varepsilon }_{t+1}^{A}\right)F_{1}(k_{t+1},L_{t+1},v_{t+1})-\delta +\left(\frac{z_{t+1}}{k_{t+1}}\right)^{2}\Psi '\left(\frac{z_{t+1}}{k_{t+1}}\right)+q_{t+1}\right\}\end{align}
Equation (10) describes the law of motion for
 $\chi _{t}$
.
 \begin{equation}\chi _{t}=-E_{t}U\left(c_{t+1},L_{t+1}\right)+E_{t}\chi _{t+1}\vartheta \left(c_{t+1},L_{t+1}\right).\end{equation}
Equation (11) represents the firm-household’s budget constraint, with the left-hand side denoting expenditures and the right-hand side denoting revenues.
 \begin{align}&\left(1+\tau \right)c_{t}+\delta k_{t}+(k_{t+1}-k_{t})\left[1+\Psi \left(\frac{k_{t+1}-k_{t}}{k_{t}}\right)\right]\nonumber\\ &\quad=exp\left({\varepsilon }_{t}^{A}\right)F(k_{t},L_{t},v_{t})-p_{t}v_{t}-\phi \left(R_{t}-1\right)(w_{t}L_{t}+p_{t}v_{t})-{q}_{t}^{b}\left({b}_{t+1}^{P}+{b}_{t+1}^{G}\right)+\left({b}_{t}^{P}+{b}_{t}^{G}\right)\end{align}
The international bonds (net foreign assets) in the model consist of two components: private net foreign assets (
 ${b}_{t}^{P}$
) and liquidity provision (
 ${b}_{t}^{G}$
) via the TARGET system. A negative value of
 ${b}_{t}^{G}$
means borrowing via liquidity provision.
Equation (12) represents the Kuhn–Tucker condition associated with the collateral constraint, which serves as the main mechanism amplifying the effects of shocks in the model.
 \begin{equation}\mu _{t}\left[{q}_{t}^{b}{b}_{t+1}^{P}-\phi R_{t}(w_{t}L_{t}+p_{t}v_{t})+\kappa q_{t}k_{t+1}\right]=0\end{equation}
This equation characterizes two distinct regimes. When the collateral constraint is binding,
 $\mu _{t}\gt 0$
and
 ${\kappa q_{t}k_{t+1}=\phi R_{t}(w_{t}L_{t}+p_{t}v_{t})-q}_{t}^{b}{b}_{t+1}^{P}$
, indicating that the firm-household borrows international private lenders up to the maximum permissible amount, which corresponds to a fraction
 $\kappa$
of the collateral value. When the collateral constraint is non-binding,
 $\mu _{t}=0$
and
 ${\kappa q_{t}k_{t+1}\gt \phi R_{t}(w_{t}L_{t}+p_{t}v_{t})-q}_{t}^{b}{b}_{t+1}^{P}$
, indicating that the firm-household does not exhaust its borrowing limit. We assume that the collateral constraint applies only to private net foreign assets.
Equation (13) defines total investment, where the second term on the right-hand side represents net investment including adjustment costs, governed by
 $\Psi$
.
 \begin{equation}i_{t}=\delta k_{t}+(k_{t+1}-k_{t})\left[1+\Psi \left(\frac{k_{t+1}-k_{t}}{k_{t}}\right)\right]\end{equation}
Equation (14) defines net investment
 $z_{t}$
.
 \begin{equation}z_{t}=k_{t+1}-k_{t}\end{equation}
Equation (15) describes the specification for liquidity provision, which constitutes a key component of the model. It can be shown that this specification assumes the volume of liquidity provision to be a linear function of the spread between the effective real interest rate and the world interest rate.
 \begin{equation}{b}_{t+1}^{G}=-\Phi \frac{\mu _{t}}{E_{t}\left[\vartheta \left(c_{t},L_{t}\right)\lambda _{t+1}\right]}\end{equation}
The parameter
 $\Phi$
captures the responsiveness of liquidity provision to the interest rate spread. The term
 $\mu _{t}/E_{t}[\vartheta (c_{t},L_{t})\lambda _{t+1}]$
corresponds to the spread generated by the binding collateral constraint. In the present context, this spread can be interpreted as a country-risk premium, reflecting the perceived riskiness of Greek borrowing from the standpoint of international private lenders, in line with the terminology used in international finance (Bekaert and Hodrick Reference Bekaert and Hodrick2012). Equation (16) defines total net foreign assets
 $b_{t+1}$
:
 \begin{equation}b_{t+1}={b}_{t+1}^{P}+{b}_{t+1}^{G}\end{equation}
To operate the model, we assume the following function forms:
 \begin{equation*} u[c_{t}-N(L_{t})]=\big(\big[{c_{t}}-{{L_{t}}^{\omega }}/\omega \big]^{1-\sigma }-1\big)/(1-\sigma ) \end{equation*}
 \begin{equation*} \rho [c_{\tau }-N(L_{\tau })]=\gamma \big[ln\big(1+c_{t}-{L_{t}}^{\omega }/\omega \big)\big] \end{equation*}
 \begin{equation*} \vartheta (c_{t},L_{t})=exp\{-\rho [c_{t}-N(L_{t})]\}=\big(1+{c_{t}}-{{L_{t}}^{\omega }}/\omega \big)^{-\gamma } \end{equation*}
 \begin{equation*} F(k_{t},L_{t},\nu _{t})=A{k_{t}}^{\beta }{L_{t}}^{\alpha }{\nu _{t}}^{\eta } \end{equation*}
 \begin{equation*} \Psi (z_{t}/k_{t})=(a/2)(z_{t}/k_{t}) \end{equation*}
The above function forms also imply the property that:
 \begin{equation}w_{t}=-\frac{U_{L}\left(c_{t},L_{t}\right)-\chi _{t}\vartheta _{L}\left(c_{t},L_{t}\right)}{U_{c}\left(c_{t},L_{t}\right)-\chi _{t}\vartheta _{c}\left(c_{t},L_{t}\right)}={L_{t}}^{\omega -1}.\end{equation}
The model includes three exogenous shocks: a technology shock (
 ${\varepsilon }_{t}^{A}$
), world interest rate shock (
 ${\varepsilon }_{t}^{R}$
), and shock to the price of imported inputs (
 ${\varepsilon }_{t}^{P}$
). All three shocks follow an AR(1) process. Equation (18) presents the world gross interest rate the lenders charge, and Equation (19) denotes the price of imported inputs.
 \begin{equation}R_{t}=R\cdot exp\big({\varepsilon }_{t}^{R}\big).\end{equation}
 \begin{equation}p_{t}=p\cdot exp\big({\varepsilon }_{t}^{P}\big).\end{equation}
4. Empirical results
4.1 Calibration of model parameters
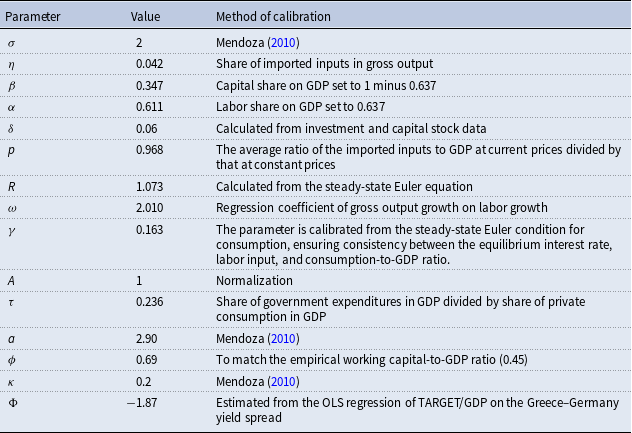
Table 1 presents the numerical values of the model parameters. We now provide a detailed discussion of the calibration of each parameter.
Calibrated parameter values

Table 1. Long description
A table with 12 rows and 3 columns. The columns are labeled Parameter, Value, and Method of calibration. The table lists various parameters with their corresponding values and methods of calibration. Row 1: Parameter, σ; Value, 2; Method of calibration, Mendoza (2010). Row 2: Parameter, η; Value, 0.042; Method of calibration, Share of imported inputs in gross output. Row 3: Parameter, β; Value, 0.347; Method of calibration, Capital share on GDP set to 1 minus 0.637. Row 4: Parameter, α; Value, 0.611; Method of calibration, Labor share on GDP set to 0.637. Row 5: Parameter, δ; Value, 0.06; Method of calibration, Calculated from investment and capital stock data. Row 6: Parameter, ρ; Value, 0.968; Method of calibration, The average ratio of the imported inputs to GDP at current prices divided by that at constant prices. Row 7: Parameter, R; Value, 1.073; Method of calibration, Calculated from the steady-state Euler equation. Row 8: Parameter, ω; Value, 2.010; Method of calibration, Regression coefficient of gross output growth on labor growth. Row 9: Parameter, γ; Value, 0.163; Method of calibration, The parameter is calibrated from the steady-state Euler condition for consumption, ensuring consistency between the equilibrium interest rate, labor input, and consumption-to-GDP ratio. Row 10: Parameter, A; Value, 1; Method of calibration, Normalization. Row 11: Parameter, τ; Value, 0.236; Method of calibration, Share of government expenditures in GDP divided by share of private consumption in GDP. Row 12: Parameter, φ; Value, 2.90; Method of calibration, Mendoza (2010).
Source: Authors’ calculations. See Section 4 for details of the calibration.
Notes: All parameters are calibrated using Greek data for 1999–2007.
The parameter
 $\sigma$
represents the coefficient of relative risk aversion. We follow Mendoza (Reference Mendoza2010) and set it equal to 2.
The next parameter we need to calibrate is
 $\eta$
. According to the model definition, the gross output (
 $y$
) in the model corresponds to the sum of GDP and imported inputs in the real-world data. To calibrate
 $\eta$
, we use annual data. The annual GDP data we use come from the IMF World Economic Outlook, specifically the April 2025 edition. For the imported inputs, we rely on data from the World Bank’s WITS (World Integrated Trade Solution) database. This database provides an approximation for imported inputs, and specifically, we use the category of intermediate goods as a proxy for the imported inputs in the model. We use annual data from 1999, the year the euro was introduced, up to 2007, the year before the global financial crisis. From this, we calculate that the average share of imported inputs in gross output is approximately 0.042. This figure is lower than what Mendoza found for Mexico, where the share of imported inputs in gross output was around 0.102 for the period from 1993 to 2005.
We use the LS6 measure of the labor share from Guerriero (Reference Guerriero2019), the author’s preferred specification, which for Greece equals 0.637 in 2007. The LS6 measure of the labor share is distinctive because it corrects for the bias arising from self-employment, thus providing a more reliable estimate of labor income in the economy. Given a labor share of 0.637 and
 $\eta =0.042$
, we can further characterize the model parameters as follows. The share
 $\alpha ={0.637}/{(1+\eta)}=0.611$
, and
 $\beta =1-\alpha -\eta =0.347$
.
In Passas (Reference Passas2023, Figure 2), the preferred capital-to-GDP ratio is that obtained under the geometric age-efficiency profile with a gamma survival function, as this specification produces smoother and economically plausible trajectories of the capital–output ratio. Over the period 1999–2007, the average capital-to-GDP ratio is 2.72, and the corresponding point estimate for 1999 is 2.88.
Using the asset-level information reported in Passas (Reference Passas2023, Table 1), we computed an aggregate depreciation rate for the Greek economy by weighting the asset-specific depreciation rates by their corresponding shares in total fixed assets (3-digit level). Based on these asset-weighted calculations, the implied economy-wide depreciation rate is approximately 6 percent per annum. Furthermore, the 1999–2007 average of
 $k/y$
is 2.603. Combined with
 $\delta =0.06$
, this value of
 $k/y$
yields an average investment–gross output ratio (
 $i/y$
) of 15.6 percent.Footnote
1
To calibrate
 $p$
, we compute for each year the ratio of imported goods to gross output at both current and constant prices. Using Greek data (taken from the OECD) for 1999–2007, we take the relative value of the sample averages of these two ratios and obtain 0.968. The resulting value of
 $p\lt 1$
indicates that the prices of imported goods increased somewhat less rapidly than the gross output deflator during this period.
The value of the annual gross real interest rate is set by imposing the values of
 $\beta$
, (
 $i/y$
), and
 $\delta$
on the Euler equation for capital evaluated at the steady state and solving for
 $R$
. The resulting expression yields
 $R=1+[\delta (\beta -(i/y))]/(i/y)=1.073$
.
In equilibrium,
 ${L}_{t}^{\omega }=\alpha y_{t}$
, which can be expressed as
 $\omega \gamma _{L}=\gamma _{y}$
; here
 $\gamma _{L}$
and
 $\gamma _{y}$
denote the growth rates of labor and gross output, respectively. We use the relationship between the growth of gross output and the growth of labor to recover
 $\omega$
. In calibrating
 $\omega$
, we use gross output measured in constant prices to capture its real growth rate. For labor, we define
 $L_{t}$
as the product of the employed population aged 15 to 64 and the average annual hours worked per worker. This allows us to align more closely with the model’s concept of
 $L_{t}$
, and we then compute its growth rate accordingly. The data are sourced from the OECD database. The resulting value of
 $\omega$
is 2.010.
The parameter
 $\tau$
is defined as the ratio of government expenditure to private consumption in the national accounts. Using OECD data for Greece from 1999–2007, this ratio is calculated to be 0.236.
In the steady-state calibration, the parameters obtained from the Greek data are substituted into the optimality conditions for labor, imported inputs, and the Euler equation for capital. The resulting nonlinear system is solved simultaneously to determine the steady-state values of capital (
 $k$
), labor (
 $L$
), and imported inputs (
 $v$
). Given these values, gross output (
 $y$
) is computed from the production function, and GDP is defined by subtracting the cost of imported inputs from gross output. The average consumption–GDP ratio in the data is 0.719. Using the empirical ratio
 $c/GDP=0.719$
, steady-state consumption (
 $c$
) is derived as
 $c=0.719\times GDP$
. Finally, the preference parameter
 $\gamma$
is determined from the steady-state condition
 $\gamma ={ln(R)}/{ln(1+c-\omega ^{-1}L^{\omega })}$
, and we
 $\gamma =0.163$
.
To calibrate
 $\phi$
, we first set the target working-capital-to-GDP ratio at 0.45. We use credit to the non-financial sector (as a percentage of GDP) taken from the BIS (2025) as an approximation for the target. In equilibrium,
 $\phi = (0.45)/(\alpha+\eta)$
, which is about 0.69.
To calibrate the investment adjustment cost parameter
 $a$
, we first consider empirical evidence from Greece. Using ECB data for real gross fixed capital formation and real GDP (1999–2007), the ratio of investment volatility to GDP volatility, after applying the HP filter to log series, is approximately 7.0. In our framework, given the first-order approximation employed in the solution, the model-implied second moments are invariant to the value of
 $a$
. We therefore treat
 $a$
as an externally calibrated parameter and set it to a value close to that used in Mendoza (Reference Mendoza2010). Specifically, we set
 $a=2.90$
, a value that aligns closely with Mendoza’s benchmark of 2.75 while providing a reasonable scale for adjustment costs in the Greek context. Our main results are not sensitive to moderate variations in this parameter.
The parameter we next seek to calibrate is the coefficient
 $\Phi$
, which reflects the impact of the interest rate spread on liquidity support. To estimate this, we use the TARGET-to-GDP ratio from Figure 1 (expressed in percentage terms) as the dependent variable, and the spread between Greek and German 10-year government bonds as the independent variable. The data source is the OECD.
Our estimation includes an intercept, and using monthly data from 2007 to 2014, we find that the slope coefficient (
 $\Phi$
) is −1.87. When we restrict the sample to 2008–2014, to align with the period used by Fagan and McNelis (Reference Fagan and McNelis2020), we estimate
 $\Phi$
to be −1.70. For Greece alone, Fagan and McNelis reported a coefficient of around −13.0.
The large coefficient they report appears implausible, as it implies that a 1% increase in the spread could trigger a medium-to-large capital inflow or outflow, akin to a capital flow reversal (sudden stop), exceeding 5% of GDP. We believe our more modest estimates of −1.70 to −1.87 percent of GDP per 1 percent increase in the spread are more realistic, reflecting a plausible degree of liquidity support provided by the TARGET system.
The final parameter,
 $\kappa$
, governs the frequency of sudden stops by determining how tightly the collateral constraint binds. We adopt the baseline value from Mendoza (Reference Mendoza2010), setting
 $\kappa =0.20$
.
4.2 Counterfactual simulation
Private final consumption expenditure for Greece from 2007Q1 to 2014Q4 is obtained from the FRED database maintained by the Federal Reserve Bank of St. Louis. The consumption series is log-transformed, detrended using the Hodrick–Prescott (HP) filter, and expressed as percentage deviations from trend.
In order to construct a quarterly series of imported inputs for Greece, we use a two-step procedure. First, we obtain the annual share of intermediate goods in total imports from the World Bank’s WITS database for the period 2007–2014. We assume that the annual ratio remains constant within each year for the quarterly estimates. Second, we take the quarterly import data for Greece from the FRED database (maintained by the Federal Reserve Bank of St. Louis), which are expressed in euros and seasonally adjusted. By applying the annual intermediate-goods share from WITS to the quarterly total import figures from FRED, we approximate the quarterly imported inputs. This method provides a practical way to derive the required quarterly series.
Our third variable is the capital-account-to-GDP ratio. Now, in most statistical data sources today, this is actually referred to as the financial account. Our data source is the International Monetary Fund’s International Financial Statistics. This series is inherently a ratio, specifically expressed as a percentage. So we simply de-mean it directly.
Now, these three observable variables are used to recover our structural shocks, and in Figure 2 from top to bottom, they represent the time series of consumption, imported inputs, and the capital-account-to-GDP ratio. Looking at the results, one sees that consumption faced a significant decline after 2010. Imported inputs had already started to decline earlier, around 2009. Meanwhile, before the crisis, when the capital-account-to-GDP ratio is negative, it indicates net capital inflows into Greece. We can observe that before 2010, there were substantial capital inflows. After 2010, however, this situation reversed, and by 2013, the capital outflow reached its peak.
Key Observables Used for Recovering Structural Shocks.
Source: Authors’ calculations based on data from the International Monetary Fund, International Financial Statistics (IFS).
Note: Consumption and imported inputs are expressed as percentage deviations from their Hodrick–Prescott trends. The capital-account-to-GDP ratio (positive value means net capital inflows) is inherently a percentage ratio; the series is demeaned prior to use.

We use the three data series—namely consumption, imported inputs, and the capital-account-to-GDP ratio—to recover the three structural shocks of the model: the technology shock, the shock to international interest rates, and the shock to imported input prices. To ensure that our entire shock recovery process is correct, we also feed these three recovered shocks back into the model. When we do this, the model can exactly replicate the original data series. We do not include these detailed replication results in the main body of the paper in order to save space, but they are available from the authors upon request. Additionally, we want to emphasize the importance of this step: confirming that the model can exactly reproduce the original data series using the recovered shocks is a crucial validation step. It ensures that our entire shock recovery procedure is correct and lends credibility to the subsequent counterfactual exercises. In other words, this step is fundamental: without a validated shock recovery procedure, any counterfactual simulations would not have a solid foundation.
Figure 3 illustrates Greece’s TARGET balance as a ratio to 2007 nominal GDP. To account for the changes in GDP after the crisis, we use the 2007 GDP level as a normalization benchmark. As we can see, the TARGET balance for Greece declined rapidly after 2009, with negative values indicating that Greece was increasingly borrowing liquidity support from the Eurosystem relative to its GDP. This borrowing ratio kept falling until it reached its lowest point around late 2012, and only then did it start to recover. However, even by the end of the sample period in the fourth quarter of 2014, the balance remained negative, indicating that Greece was still reliant on TARGET borrowing as liquidity support from the ECB.
Greece: TARGET balance as a percentage of 2007 Nominal GDP (2007Q1–2014Q4).
Source: Authors’ calculations based on monthly TARGET data from the Euro Crisis Monitor.
Note: The TARGET balance is converted from monthly to quarterly averages and normalized using nominal GDP. A negative ratio indicates net TARGET borrowing (liquidity support) received by Greece from the Eurosystem. GDP is expressed in nominal terms, and 2007 is used as the normalization benchmark to account for post-crisis GDP fluctuations.

Figure 4 takes the TARGET balances from Figure 3 and calculates the quarter-to-quarter changes in these balances, again expressed as a percentage of GDP. In other words, instead of looking at the level of the stock, we are now examining the flow changes from one quarter to the next. We observe that these quarter-on-quarter changes also turned negative around 2009 and remained predominantly negative until the end of 2012. This indicates that Greece’s net borrowing from the TARGET system kept increasing throughout this period, as each quarter added further deficits to the cumulative shortfall.
Greece: Quarterly Changes in TARGET Balances as a Percentage of Nominal GDP (2007Q1–2014Q4).
Source: Authors’ calculations based on monthly TARGET data from the Euro Crisis Monitor.
Note: The figure reports quarter-to-quarter changes in Greece’s TARGET balance, computed from quarterly averages of monthly TARGET positions and normalized using nominal GDP. Negative values indicate periods during which Greece increased its net TARGET borrowing (liquidity support) from the Eurosystem. Quarterly GDP is expressed in nominal terms.

So, if we rely solely on Figure 3, which uses the stock measure of Greece’s TARGET position, we may end up overestimating the amount of liquidity support Greece received from the ECB. Conversely, if we use the quarter-to-quarter changes shown in Figure 4, we might underestimate it. To address this issue, we adopt a middle-ground approach. Specifically, we consider only those periods in Figure 4 where the changes are negative—this is illustrated in Figure 5. In other words, we treat only the negative changes in the TARGET balance as indicative of net liquidity support flowing into Greece. When the change is positive, we interpret it as Greece partially repaying or reducing its TARGET balance. In this way, we construct a more balanced measure of net support.
Greece: TARGET Support Flows as % of Nominal GDP (2007Q1–2014Q4).
Source: Authors’ calculations based on monthly TARGET data from the Euro Crisis Monitor.
Note: TARGET support is defined as the negative portion of quarterly TARGET balance changes relative to nominal GDP. Only negative ΔTARGET values—representing periods when Greece received net liquidity through the Eurosystem—are plotted. Positive values are set to zero to avoid conflating liquidity support with partial repayments of TARGET liabilities.

In the following counterfactual simulation, we assume that in the absence of TARGET support, Greece would have experienced a reduced net inflow of funds. In other words, we remove the liquidity-support component that was provided via TARGET from Greece’s capital-account-to-GDP ratio. There are two points to clarify. First, in the figures that follow, a positive capital-account-to-GDP ratio indicates a net capital inflow, while a negative ratio indicates a net capital outflow. Second, when designing the counterfactual scenario, we also take into account that the changes in the TARGET stock from quarter to quarter can sometimes be quite large. Therefore, we impose a cap, limiting the maximum negative quarterly TARGET support shock to 20% of GDP. This is a relatively generous assumption that still provides a significant buffer in our analysis. The results of this counterfactual simulation are presented in Figure 6.Footnote 2
Baseline vs. Counterfactual dynamics under reduced TARGET support.
Source: Authors’ calculations.
Note: The solid black line shows the baseline model simulation using shocks recovered under the observed regime. The dashed red line plots the counterfactual scenario in which TARGET support flows are removed from Greece’s capital account—implemented by deducting the TARGET-related support component from the capital account to GDP series before shock inversion. To avoid unrealistically large quarterly adjustments, the counterfactual TARGET support shocks are smoothed and capped at 20% of GDP. All series are expressed as (percentage) deviations from steady state. “Capital account / GDP” is measured such that positive values indicate net capital inflows. Panels show: (i) Consumption, (ii) Labor, (iii) Output, and (iv) Capital account to GDP.

The counterfactual simulation illustrates how Greek macroeconomic dynamics would have evolved in the absence of TARGET-related liquidity support. Removing these inflows tightens the country’s external financing conditions, which in turn reduces the amount of working capital available to firms and the spending capability of households. As shown in the panels for consumption, labor, and output, the red counterfactual paths diverge substantially from the black baseline. Consumption contracts more sharply throughout the crisis period, labor input drops persistently, and output falls by a considerably larger magnitude compared to the baseline simulation, particularly during the peak crisis years around 2010–2012. These patterns reflect the amplification mechanisms embedded in the collateral constraint: with fewer external resources, the economy experiences a deeper and more prolonged recession than in the observed baseline path.
The lower-right panel confirms the direct capital-account channel through which TARGET support mattered. When TARGET-related inflows are removed, the counterfactual capital-account-to-GDP ratio becomes substantially more negative, indicating materially larger net outflows than observed. This tightened external financing constraint forces the economy to adjust through lower domestic expenditure and factor utilization, generating the stronger declines in consumption, labor, and output documented in the other panels. Overall, the counterfactual exercise indicates that TARGET support played a quantitatively important stabilizing role during the Greek crisis: without it, the contraction in economic activity would have been markedly deeper, and the recovery phase more fragile and prolonged.
4.3 Implications for surplus countries
From the perspective of the underlying model, the crisis did not materially burden the Eurozone’s surplus countries. Their external financing conditions remained stable throughout the episode, meaning that their own collateral constraints never approached the binding region that would trigger a contractionary adjustment. The more relevant counterfactual concerns the role of TARGET2: without the system absorbing Greece’s payment imbalances, the Eurozone as a whole would have required a higher interest rate to induce net capital outflows from Greece, generating a broad-based rise in borrowing costs. Such an increase would have suppressed consumption and investment even in countries far removed from the crisis itself. A remaining theoretical risk is that a subsequent Greek default could have transformed TARGET imbalances into fiscal losses for surplus countries, but this scenario did not materialize. Consequently, for surplus members, TARGET functioned not as a source of strain but as a mechanism for preventing wider macroeconomic deterioration.
5. Conclusion and policy implications
TARGET is a unique system in the Eurozone, which automatically provides liquidity to euro countries facing capital outflow. There has been considerable debate regarding the impact of TARGET in the existing literature. In this paper, we first introduce the background of the TARGET system and discuss the role it played during the European debt crisis. Then by modifying the frameworks of Mendoza (Reference Mendoza2010), Fagan and McNelis (Reference Fagan and McNelis2020), and Ritschl and Ho (Reference Ritschl and Ho2025), and calibrating the parameters using historical data, we perform policy simulations and counterfactual analyses.
Using the recovered shocks, our model can exactly reproduce the original data series, which ensures that our entire shock recovery procedure is correct and lends credibility to the subsequent counterfactual exercises. By adopting a middle-ground approach that considers only the negative changes in the TARGET balance, we construct a more balanced measure of net support. We then remove TARGET-related inflows and perform counterfactual simulations. Our findings are as follows:
First, without the liquidity support provided by the TARGET system, Greece’s economic situation would have deteriorated even more severely than what actually occurred. GDP, consumption, labor, and capital account to GDP would all have been lower and more volatile. Second, relative to the baseline simulation with TARGET support, labor input and output decline much more sharply in 2011, while consumption decreases more persistently throughout the crisis. Finally, when TARGET-related inflows are removed, the counterfactual capital-account-to-GDP ratio becomes substantially more negative. This indicates that TARGET system support played a quantitatively important stabilizing role during the Greek crisis: without it, the contraction in economic activity would have been markedly deeper, and the recovery likely considerably slower.
Our study not only explains the economic intuition behind the influence of the TARGET system on the Greek economy, but also provides model-based and empirical evidence confirming the macroeconomic importance of the TARGET system for Greece. For the deficit countries like Greece, TARGET support played a quantitatively important stabilizing role. With TARGET2 absorbing Greece’s payment imbalances, the Eurozone did not require a broad-based increase in interest rates to induce external adjustment. For surplus countries like Germany, TARGET2 help prevent a general decrease in borrowing costs. Therefore, TARGET did not become a source of pressure, but rather a mechanism that helped prevent a wider macroeconomic deterioration.
Acknowledgments
The authors thank Costas Passas for providing data from his study on Greece’s capital-to-GDP ratio, which proved highly valuable for our calibration exercise. The authors also sincerely thank the Guest Editor and the anonymous reviewers for their valuable comments and suggestions, which greatly improved the clarity and overall quality of the paper. The analysis and interpretations expressed in this paper are entirely our own. Financial support by Taiwan’s National Science and Technology Council (NSTC 113-2410-H-002-236-MY2; NSTC 114-2410-H-002-237; NSTC 114-2410-H-110-094) is acknowledged.



 Open access

