



Nomenclature
- ACI
-
Airports Council International
- ADAM
-
Adaptive Moment Estimation
- AIBT
-
actual on-block time
- ANN
-
artificial neural network
- AOBT
-
actual off-block time
- ATM
-
Air Traffic Management
- BGR
-
bagging gradient
- DL
-
deep learning
- DTR
-
decision trees
- ETR
-
extra trees
- FAA
-
Federal Aviation Administration
- FSC
-
full-service carrier
- HBR
-
Huber Regressor
- IATA
-
International Air Transport Association
- ICAO
-
International Civil Aviation Organization
- KNN
-
k-nearest neighbors
- LCC
-
low-cost carrier
- LIR
-
simple linear regression
- LSTM
-
long short-term memory
- ML
-
machine learning
- MLP
-
multi-layer perceptron
- NN
-
neural network
- RFR
-
Random Forest
- ReLU
-
rectified linear unit
- RMSE
-
root-mean-square-error
- RMSProp
-
root mean square propagation
- SGD
-
stochastic gradient descent
- SVM
-
support vector machine
- XGR
-
extreme gradient boosting
1.0 Introduction
Demand for air transport worldwide has grown vertiginously in the last three decades [1, 2]. Airlines require more capacity and more availability from airports (in infrastructure) to operate routes and frequencies designed to respond to this demand. The global airport industry has also reacted by permanently expanding its infrastructure and even building new airports with a vast volume of public and private investment [Reference Graham and Morrell3]. However, the demand and the response have not grown equally fast: the capacity offered or installed in many airports in the world cannot fully satisfy the needs of airlines. This situation has resulted, first, in airport congestion and, consequently, in the generation of delays [Reference de Neufville and Odoni4–Reference Ashford, Mumayiz and Wright6]. For this reason, many studies, both technical and academic, state that delay is a concept that is closely linked to the capacity of airports [7–Reference Janic9].
The volume of delays has been increasing in the last two decades, not only in its magnitude but also in its negative economic impact, mainly in terms of costs [Reference Borsky and Unterberger10–Reference Cook, Tanner, Jovanović and Lawes14]. In the aviation system of the United States in 2019, 18.87% of all flights in the system had a delay [15]; in Europe, in 2019, 46.4% of all takeoffs departed late (whatever the reason for the delay), and the average (time) of these delays (of all late departed flights, concerning time scheduled departure) was 28.4 minutes [16]; in Colombia, the country used as a case for this research, in 2019, 28.60% and 22.54% of domestic and international flights, respectively, departed with delay [17]. Regarding the economic impact of delays, according to Federal Aviation Administration (FAA) estimates [18], the cost generated in the United States aviation system in 2019 was USD 33 billion (including all items); in Europe, the total cost of delays for 2012 was estimated at EUR 11.2 billion (in all respects) [19]; in Colombia, the cost of delays, only for airlines (and only for passenger compensation), in 2019 was USD 6.5 million [17].
The objective of the present research is to predict the delays in the departures of scheduled commercial flights, using the data of the complete airport network of Colombia (country-case study: 58 airports) observing the data of 357,595 flight departures for the entire year 2018 (study period), including both domestic and international departures. For this, and as a methodology, predictive tools based on machine learning/deep learning (ML/DL) were used, with supervised training (that is, the delays of the dataset flights used in training and testing are known) in prediction in regression (which will result in an actual expected delay time for a flight departure). The novel contribution of this work is, on the one hand, that it compares the predictions in terms of mean and statistical variance according to the different ML/DL models implemented (ten in total), so that the optimum model can be chosen from among them and, on the other hand, that it determines the coefficients of importance of the flight attributes, using ML methods known as permutation importance [Reference Altmann, Tolosi, Sander and Lengauer20, Reference Breiman21], which allows ranking the importance of flight attributes by their influence on the delay time and filtering out the less-important attributes of the flight. Finally, all ML/DL models are retrained to analyse their new features by using the reduced dataset with the most important attributes selected by the models to simplify dataset gathering and ML/DL model training.
2.0 Literature review
The two most frequent perspectives in which the delay of commercial flights (mainly scheduled flights) is studied are its prediction and its propagation. Rich literature can be found on this second topic [Reference Tan, Jia, Yan, Wang and Bian22–Reference Hansen38]. Other lines of research review the relationship of delays with (a) flight efficiency and other economic (for example, costs) and logistical aspects of delays [Reference Peterson, Neels, Barczi and Graham12, Reference Cook, Tanner, Jovanović and Lawes14, Reference Wu35, Reference Morrison and Winston39–Reference Soomer and Franx46]; (b) aircraft ground operations [Reference Mofokeng and Marnewick47]; (c) airport capacity [Reference Zou and Hansen48–Reference Zhong, Varun and Lin50]; (d) aspects related to clients [Reference Ferrer, Oliveira and Parasuraman51, Reference Lubbe and Victor52]; and finally, (e) its generation, characterisation, behaviour and structure [Reference Borsky and Unterberger10, Reference Qin and Yu41, Reference Li and Jing53–Reference Zhang, Chen, Sun, Du and Cao68].
On the order hand, prediction of scheduled flight delays has been analysed from different methodologies that can be grouped into at least six preponderant groups [Reference Kim and Bae54, Reference Lambelho, Mitici, Pickup and Marsden57, Reference Carvalho, Sternberg, Goncalves, Cruz, Soares, Brandão, Carvalho and Ogasawara69–Reference Guo, Yu, Hao, Wang, Jiang and Zong71]: (1) statistical analysis (regression models, correlation analysis, econometric models, Monte-Carlo, parametric tests, non-parametric tests and multivariate analysis [MVA]); (2) probabilistic models (which encompass or include analysis tools that estimate the probability of an event based on historical data); (3) network analysis (mainly graph theory, although studies related to Bayesian network analysis are also included in this category); (4) operations research (comprising advanced analytical methods such as optimisation, simulations and queuing theory); (5) machine learning (ML) with regression prediction (in which the most used methods include: k-nearest neighbor, recurrent NN, cascade NN, deep learning [CNN and LSTM], SVM, fuzzy logic, and Random Forests); and finally (6) machine mearning in prediction in binary classification (delayed/not delayed) and multiclass (different levels of delay), in which two commonly used classification methods include decision trees and Naive Bayes. Most ensemble models, such as the Random Forest, fall into the latter category.
3.0 Application case
The data for the development of the present research are obtained from the country-case of application (or study) Colombia, currently the third largest air market in the Latin American subcontinent, and fifth in the Americas, by volume of traffic handled [108, 109].
In Colombia, the air transport industry was liberalised in the early 1990s. This liberalisation brought structural reforms in both the airport and airline sectors, through an uninterrupted battery of public policies (still in force today), which include not only normative and regulatory aspects, but also aggressive public and private investment programs in infrastructure and technology [Reference Díaz Olariaga110]. Regarding the management of airport infrastructure, Colombia has followed the regional trend of granting the administration of said infrastructures to the private sector. Since the mid-1990s, and in various temporary phases called generations, the Colombian government has granted concessions to 19 airports, which manage the bulk of air traffic in the entire network, including the largest and most important in the country [Reference Díaz Olariaga and Pulido111]. As a result of public policies – both privatisation and public and private investment in airport infrastructure – and deregulation policies of the commercial aviation sector – airfares have been fully liberalised since 2012 [Reference Díaz Olariaga and Zea112] – since the beginning of the liberalisation of the industry in 1991 and until 2019, the total number of passengers transported grew almost 800% [17].
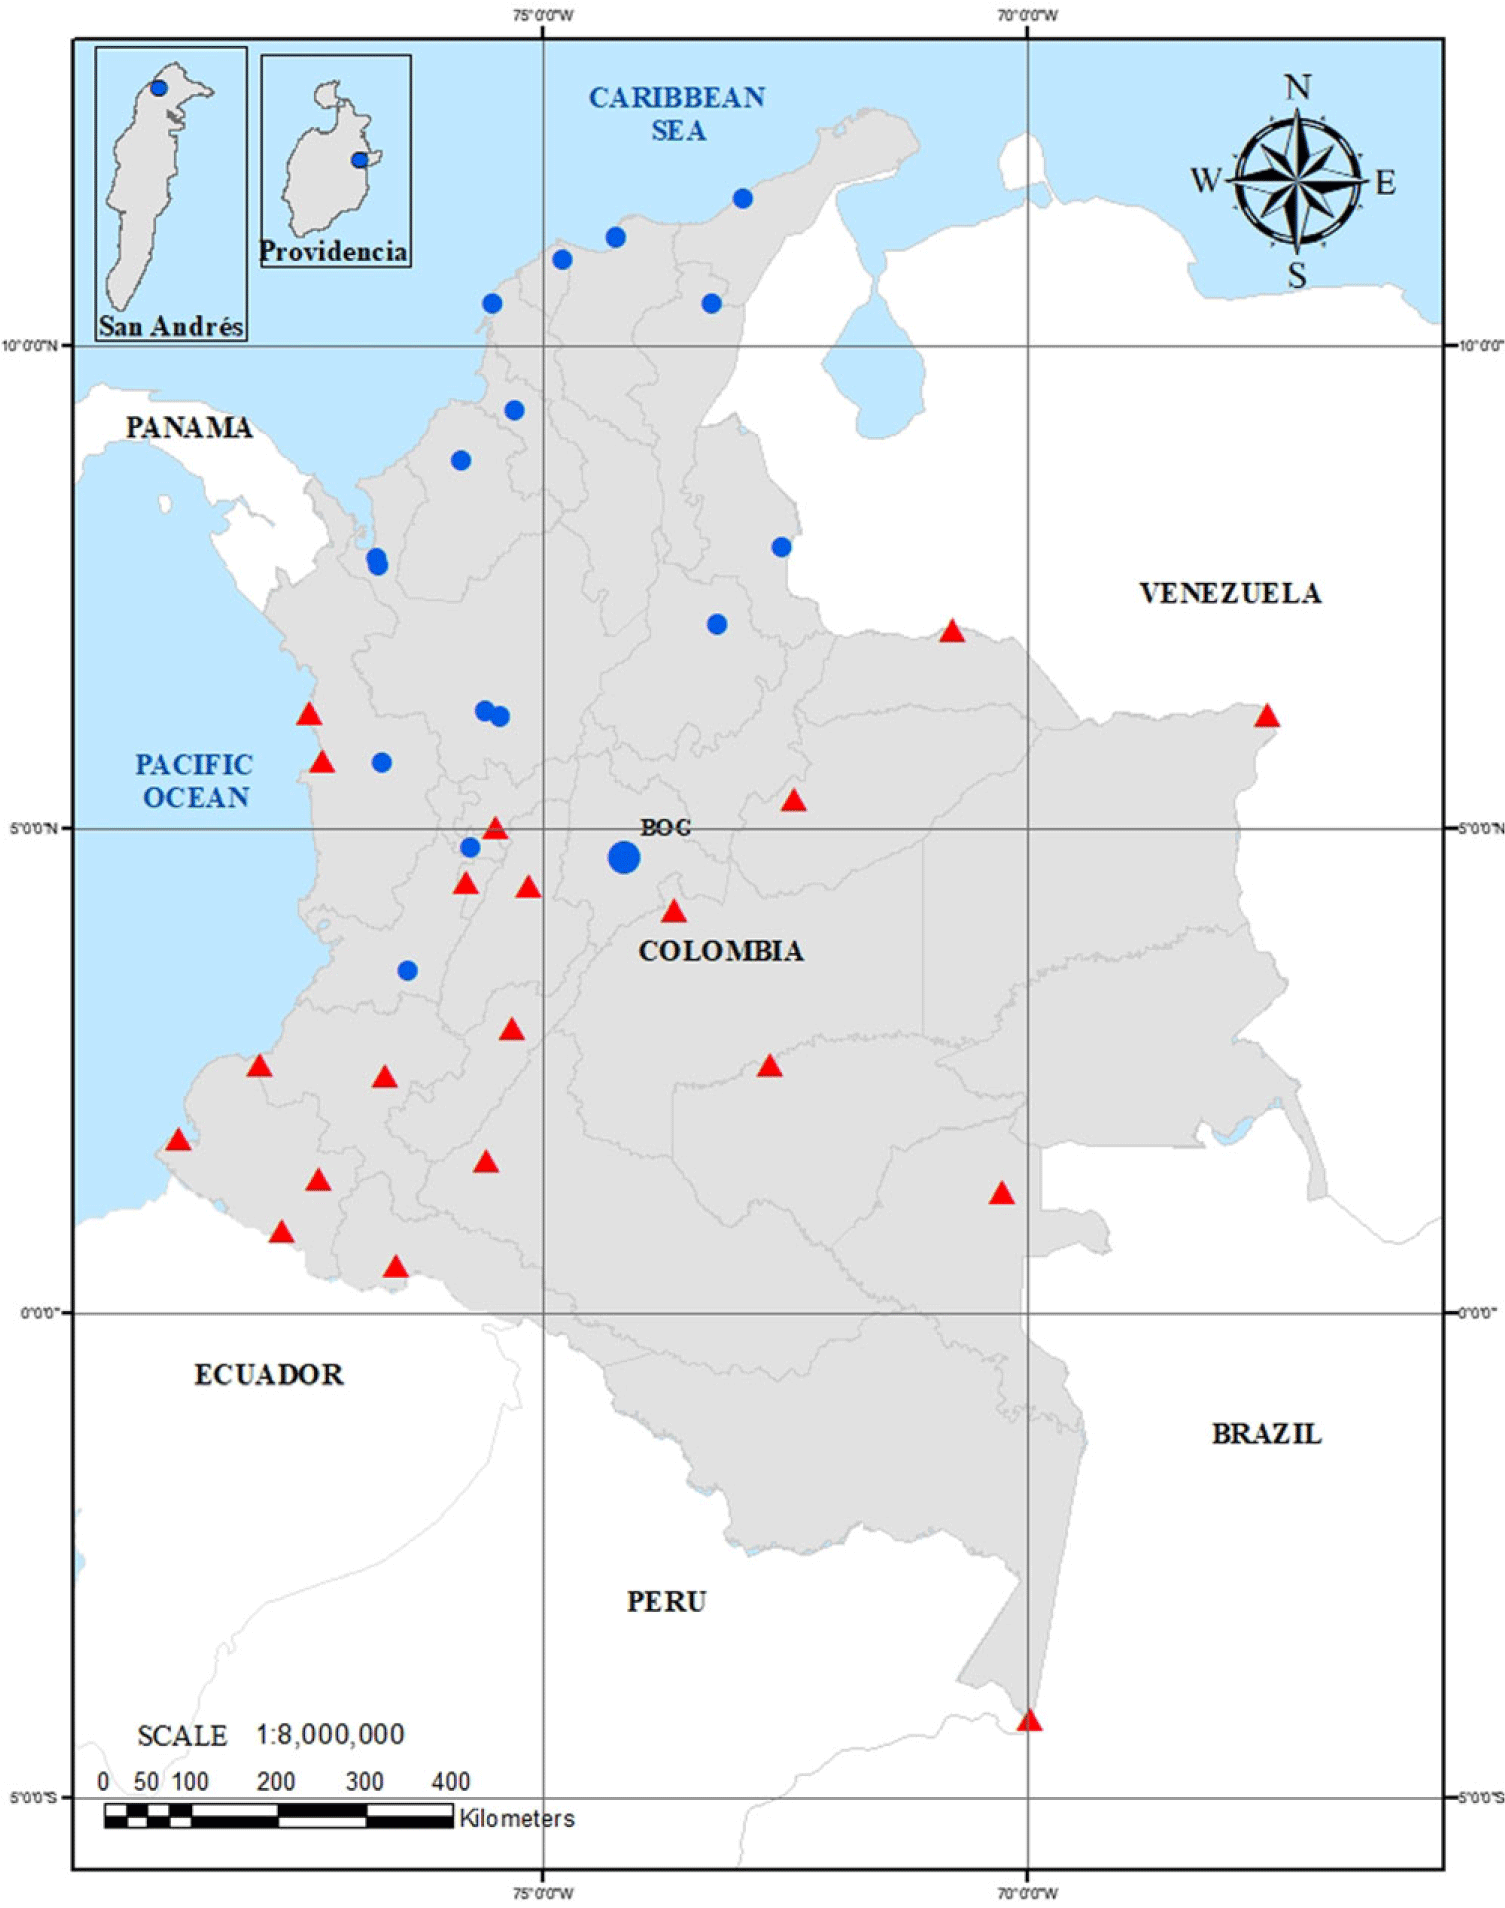
On the other hand, the entry into the market in Colombia of aero-private operators with a full-service business model (full-service carrier [FSC]), occurred very soon after the liberalisation of the sector (mid-1990s). But the entry into the market of low-cost airlines (low-cost carrier [LCC]) was many years after liberalisation (2012). In another order, it can be affirmed that air transport in Colombia has practically no competition (at the domestic level) with other means of transport, especially for medium and long distances, due to two determining situations: first, the complex geography of the country (crossed from southwest to northeast by three mountain ranges of the Andes mountain range), and, second, to the deficiency (in infrastructure, coverage, capacity and technology) of the terrestrial (road) and rail communication systems [Reference Díaz Olariaga and Carvajal113]. Figure 1 shows the geographical location of the most important airports (by volume of managed traffic) of the Colombian airport network (and participants in this research). Figure 2 shows the development of passenger air traffic in the last four decades.
Geographical location of the most important airports (by volume of managed traffic) of the Colombian airport network (and participants in this research). Description: blue circle, privately governed airports; red triangle, airports with public governance. BOG is the IATA code for the country’s main airport, Bogotá-El Dorado, located in the capital city of Colombia. Source: Ref. [17].
Development of passenger air traffic in Colombia (complete airport network), period 1979–2022. Source: Ref. [17].

The resounding drop in air traffic verified in 2020 (see Fig. 2) is due exclusively to the complete suspension of commercial passenger air traffic (throughout the country’s airport network) between mid-March and early August 2020, due to the health emergency generated by the COVID-19 pandemic. The reopening and reactivation of the commercial aviation sector was very slow, in stages and by airports, and developed throughout the last four months of 2020.
Finally, and exclusively for the present study, the Colombian Airport Authority uses the Standard IATA Delay Codes-AHM 730 [72] to encode and record the causes of all the delays that occur in the departures of all scheduled flights in the entire national network of airports open to commercial traffic every day of the year. In Colombia, the standard accepted by the national Airport Authority to measure the punctuality of the departure (or arrival) is up to 15 minutes 59 seconds (positive or negative) compared to the scheduled time. The exact moment to measure the real time of departure is when towing and push-back of the aircraft is initiated from its parking position on the apron.
4.0 Operational fundamentals of flight delays
What exactly is meant by delay, and how is it measured? Before providing an answer to this question, it is worth noting that the air transport system has several actors or stakeholders. The three most important (from an operational point of view) are: airports, airlines and the air traffic management system (ATM). Each one of these actors has its own policies and operational strategies [Reference Kearns114, Reference Budd and Ison115]. For this reason, the problem of delay cannot be attributed solely to airport operation (or management of its capacity). Furthermore, the problem of delay cannot be attributed only to the operation of these three actors, since there are other external factors that influence the appearance or aggravation of delays, one of which (the most important) is adverse weather [Reference Fernandes, Moro, Costa and Aparicio62, Reference Borsky and Unterberger116, Reference Choi, Kim, Briceno and Mavris117].
On the other hand, each country in the world has its own regulatory policy (to control and monitor activity) of its civil aviation system, as well as management policies for its air transport infrastructure. All of this makes it difficult, if not impossible, to count on a universal standard that defines and regulates the concept of delay equally throughout the world [118]. Likewise, and out of necessity, each actor in the air transport system (in each country) manages the problem of delays according to their own operational strategies. This has led to the adoption of a globally coordinated approach on how to manage delay, following certain examples or initiatives. This way, delay can be scalable between airports, both locally/nationally and internationally. In addition, national regulators of commercial aviation (or control and monitoring bodies) increasingly monitor the quality of air service. It is at this point that the concept of punctuality is introduced and serves as a performance indicator [Reference Carvalho, Sternberg, Goncalves, Cruz, Soares, Brandão, Carvalho and Ogasawara69].
Adopting recommendations or suggestions from national or supranational industry reference organisations, airport authorities (or similar bodies) in many countries have implemented the criterion that a commercial (scheduled) flight is punctual if it starts (or ends) in a range of 15 minutes (positive or negative) compared to the programmed time. If not, that flight is considered to depart or arrive late [16, 119, 120]. Some countries may apply this standard slightly differently in terms of the exact interpretation of ‘15 minutes’. That is, in some cases punctuality is accepted up to 15 minutes 59 seconds and in others, punctuality is limited to 14 minutes and 59 seconds. Early departures (sometimes called ‘negative delays’) cannot be considered a delay but depending on the timing of such anticipation they can cause certain problems in airport operations. Unexpected departures can disrupt the departure flight sequence and early arrivals can influence apron parking allocation [Reference Pamplona and Alves61].
Finally, and to complete the answer to the initial question, it remains to be determined from which event or operation the time that leads to a flight being considered punctual or delayed is counted. Again, globally, there are several criteria for when counting starts. Each national regulatory body and even each specific airport authority defines its policy in this regard. A widely used first standard is that, for departures, the scheduled (reference) time is compared with the exact (and real) time of towing or push-back. That is, at which point the tractor or trailer starts the withdrawal of the aircraft from its parking position on the apron. Another standard is the comparison of the scheduled time with the actual off-block time (AOBT). On the other hand, the arrival delay is usually calculated as the difference between the scheduled arrival time and the actual on-block time (AIBT, literally in-block) at the parking space on apron [121–123].
As mentioned, delays can have different origins, so it is very important for airport planners and managers, as well as for national regulators of the air transport service, to know the reasons for the delays. This knowledge helps, on the one hand, airport managers to generate operational strategies for their mitigation and/or minimisation and, on the other, regulators or control agents of the air transport service to identify those responsible for the delays and the actors harmed and, where appropriate, apply suitable penalties or mandatory financial compensation (or similar) to the affected actors. For this, it has been common for many countries to adopt (or adapt) the IATA Delay Codes-AHM 730 Standard [72], in which all the possible reasons that generate a delay are specified and codified. All the possible causes related to a delay are coded there, associated (by groups) with the operations of the airline, the airport, and air traffic flow management (ATFM), as well as the meteorological and other diverse causes (security, immigration, customs, government guidelines, etc.) [72].
5.0 Data and methodology
5.1 Data
For this research, a database with departures of scheduled commercial flights, domestic and international, of the entire Colombian airport network (58 airports) for the whole year 2018 was used (of the data provided by the Colombian aeronautical authority, only delays in flight departures are available). Such database includes statistical information related to 357,595 flights, with a total of 5,721,520 data entries (each flight data contains 16 associated flight attributes). Each flight attribute is associated with the following relevant information: (a) type of traffic (domestic or international); (b) airline; (c) origin airport (always national); (d) destination airport (national or international); (e) flight number (linked to the airline, route and frequency of said flight); (f) scheduled departure date; (g) scheduled departure time; (h) towing date (push-back); (i) towing time (push-back); (j) delay expressed in fraction of an hour; (k) delay expressed in minutes; (l) flight situation; (m) departure status (according to the standard of the country’s airport authority); (n) delay code (according to the Standard IATA Delay Codes-AHM 730 [72]), in which each code (89 possible) is associated with the reason that generates or causes said delay; (o) reason for the delay; (p) observations associated with the flight and/or its delay (by the airport authority).
Machine learning models require all input and output variables to be numeric. Encoding is a required pre-processing step when working with categorical data, as it is the case of our different flight’s attributes. Then, all the flight attributes or inputs must be converted into number via ordinal encoders functions. In addition, data scaling is a recommended pre-processing step when working with many machine learning algorithms, as it is this case with the ten models’ analysis. Unscaled target variables on regression problems can result in exploding gradients causing the learning process to fail. Also, data scaling is a recommended pre-processing step when working with deep learning neural networks as it is the case of MLP model. Therefore, the target flight attribute data called here time (flight) delay (DEM) must be standardised, that involve rescaling the distribution of data values (of DEM), then the mean of observed values is 0 and the standard deviation is 1. It is sometimes referred to as ‘whitening’. This can be thought of as subtracting the mean value or centreing the data. Like normalisation, standardisation can be useful, and even required in some machine learning algorithms when the input data has values with differing scales. Standardisation assumes the data fit a Gaussian distribution with a well-behaved mean and standard deviation, as it is in this case. But even this standardised Gaussian pre-processing it is recommended to be applied, if this expectation is not met, to get more reliable results.
5.2 Typology of implemented models
ML/DL models mathematically represent some types of universal approximators [Reference Guss and Salakhutdinov73] of the function f, such that it fulfills: Y = f (X). So, in the present work ten ML/DL models are proposed and used to map the Y output (delay time) with a finite and arbitrary (available attributes) set of X inputs (flight attributes, which can be up to ten in its most extensive version of the dataset), although of these ten models dare defined in Table 1, only a single DL-type model is developed and used, the so-called multi-layer perceptron (MLP) [Reference Vang-Mata74].
Models used in this research

The MLP model, whose architecture is shown in Fig. 1, has been generated using the keras/tensorflow libraries, which consist of two dense layers (connections of all neurons in the previous layer with all neurons in the posterior layer) of 9 neurons in the first layer and 36 neurons in the second, using the activation function ReLU (rectified linear unit) [Reference Agarap75–Reference Arora and Barak78], so that neurons can learn the non-linear relationships between the output and the input (of each neuron). The ReLU function is defined as: y = max (0, x), in which y represents the neuron output and x the neuron input. The ReLU function has several advantages: its computation is easy and, therefore, training times are short; it also converges quickly and does not present saturations (a problem that does occur when other activation functions such as sigmoid and hyperbolic tangent are used by having a linear output); then ReLU neurons activation do not present the vanishing gradient problem (which prevent changing or updating the model weights because the derivatives of weights sensitivity are nearly zero); they are sparsely activated (sparsity feature), which simplifies the existing connectivity or couplings between all neurons; and, finally, allows the ML/DL model to learn the non-linear relationships between the input x and the output y.
The rest of the models developed in this work, and referred in the Table 1, are the following: the support vector machine (SVR) model, a very robust model in both linear and non-linear predictions because the dimensional space of the features has been increased [Reference Bao, Xiong and Hu79]; the Random Forest (RFR) model, which is an ensemble-type method that improves the results of any of its simplest constituent algorithms by combinations of these [Reference Breiman21, Reference Schonlau and Zou80]; the simple linear regression (LIR) model [Reference Montgomery, Peck and Vining81]; the bagging gradient (BGR) model, which improves predictions by producing multigroup by combinations and repetitions [Reference Rokach82–Reference Friedman84]; the extreme gradient boosting (XGR) model, which from weaker models generates stronger models using the descending gradient as an optimising method [Reference Hanif85, Reference Chen and Guestrin86]; the Huber Regressor (HBR) model, which is also very robust in training the data with outliers (or atypical values) by penalising them through ad hoc cost functions [Reference Wang, Zheng, Zhou and Zhou87, Reference Sun, Zhou and Fan88]; the extra trees (ETR) model, which implements many more decision trees to better fit learning than simple decision tree (DTR) methods [Reference Camana, Ahmed, Garcia and Koo89, Reference Geurts, Ernst and Wehenkel90]; the DTR model, which is the simple model of decision trees, which is reused due to its self-explanatory capacity of the patterns learned by the ML [Reference Izza, Ignatiev and Marques-Silva91]; the k-nearest neighbors (KNN) model, which predicts closest neighbours based on its K parameter [Reference Azadkia92]. The ‘R’ at the end of model names indicates that the model has been implemented for regression analysis. Table 1 lists, at the summary level, the models used.
5.3 Training ML/DL models
Training the models is part of the core ML process. In this work, each of the ten ML/DL models has been trained separately with the dataset under four possible scenarios: the first scenario with the ten full flight attributes (9 inputs + 1 output), the second scenario reducing scenario one to only six flight attributes (5 inputs + 1 output), the third scenario considering only flight attributes that could be known in advance (5 inputs + 1 output), and finally the fourth scenario reducing the third one to only four flight attributes (3 inputs + 1 output) (see Fig. 3). The reduced scenarios are aimed at evaluating whether the initial flight attributes of the dataset can be reduced. Another aspect to highlight from this paper is having carried out the statistical model training by implementing the k-fold and cross-validation techniques, to ensure that there are no biases in the training due to having chosen special subsets from the dataset for training/test, resulting in a more robust evaluation of the performance of ML/DL models.
The training has been implemented by dividing the dataset into batches of 128 samples each, subsequently, the ML/DL model processes the data forward (from the inputs to the output layer), to predict or estimate the model output values. At this point, with the error obtained by measuring the predicted value versus the target value, the training method goes backward (from the output layer to the input layer) to update the model weights (or connections between neurons) of all neurons of all layers of the model, through the backpropagation method [Reference Goodfellow, Bengio and Courville93–Reference Kuo and Chen95]. This method of backward propagation of the error starts obtaining the total error through the appropriate defined cost function. Here, the root-,eam-square-error (RMSE) applied metric results from comparing the values (of the batch) estimated by the model, with the real or target values collected from the known supervised features of the dataset. This core process of ML can be explained as the process distribution of the total error between the different contributions made by all the weights or nodes of the model, which is conducted in turn by the stochastic gradient descent (SGD) method [Reference Liu, Gao and Yin96, Reference Gower, Loizou, Qian, Sailanbayev, Shulgin and Richtarik97]. The SGD method calculates the partial derivatives of the error versus each of the weights, which is a way of measuring the model sensitivity of the error compared to each of the weights of the artificial neural network. The adjective ‘stochastic’ of the SGD method comes from the fact that the gradient is calculated by randomly chosen batches and not for the entire dataset.
The equations corresponding to MLP [Reference Vang-Mata74, Reference Dingari, Reddy and Sumalatha98] are those associated with neuron layers, in which a first layer corresponds to the input (represented by the X tensor), and the last output layer (associated with the Y tensor). Between them, the hidden layers to be implemented are inserted. Each layer contains a variable number of neurons (or nodes) that can be activated with the activation functions, which can be of various types [Reference Hastie, Tibshirani and Friedman99]. The input and output a neuron are shown schematically in Fig. 4.
Layers and neurons type architecture of the developed MLP model. Source: authors.

Neuron connections of MLP networks. Source: Ref. [Reference Kingma and Ba100].

In Fig. 4, x
i
represents the inputs of feature i of the input layer, w
ij
represents the weight of feature i of the previous layer in connection with neuron j of the posterior layer,
 $\varSigma$
represents the transfer function (sum of all the inputs coming from the outputs of all the neurons of the previous layer with neuron j corrected with the b
j
bias of layer j, which produces the net output (transfer function + bias) Net
j
. The chosen activation function
 $\sigma$
is then applied to each neuron (for example, tanh or sigmoid, although ReLU has been chosen here), which in turn produces the output O
j
. From here, the connections of the output of this neuron are established again, together with all the neurons of its layer, with the neurons of the next layer, until reaching the last output layer Y
j
(which can be several neurons of output, although in the case of regression prediction it is constituted by a single neuron). This inflow-outflow is called ‘forward flow’ or ‘propagation’ (from the input layer through all the neurons in the intermediate layers, to the final output layer).
 $\theta$
j
is the threshold value of neuron j, to activate its output function (if it exists).
In this work, the RMSE has been used as the cost function. Equation (1) defines this error with the norm 2 || ||, in which E is the error, and n is the number of samples in the dataset, y (x) is the actual output (provided by the dataset under supervised learning method) and
 $\hat{y}(x)$
is the output estimated by the model.
 \begin{align} E = \sqrt {\frac{1}{n}\;\mathop \sum \limits_x \|{{\left( {y\left( x \right) - \hat y\left( x \right)} \right)\!\|}^2}} \end{align}
In ML, once the cost function is obtained, the fundamental process for the automatic adjustment of the weights of the model is implemented via BP [Reference Goodfellow, Bengio and Courville93]. Such method calculates the gradient of said total error (in this case the RMSE) compared to each of the weights or connections of the neurons of each layer of the model, for which the rule of chain derivation applies, to propagate said error backward or to distribute the error between all the model weights, neuron by neuron, layer by layer. If the method converges, the new adjustment of weights of the model is sought to produce a smaller error when it is iterated with the next batch of input samples X. This is the essence of ML, minimising some loss function (cost or error), adjusting the contributions of the weights of the model neurons connections per each dataset batch and repeating the BP process adjustment to all dataset iterations implemented. Learning that is sufficiently guaranteed when using the SGD method by the theorems of the existence of the null derivation at the points of minimum error. The following group of Equations (2) shows the derivation chain rule in artificial neuron networks (ANN) [Reference Aggarwal101, Reference Hassoun102].
 \begin{align} \frac{{\partial E}}{{\partial {w_{ij}}}} = \frac{{\partial E}}{{\partial {o_j}}}{\rm{\;}}\frac{{\partial {o_j}}}{{\partial {w_{ij}}}} = \frac{{\partial E}}{{\partial {o_j}}}{\rm{\;}}\frac{{\partial {o_j}}}{{\partial ne{t_j}}}{\rm{\;}}\frac{{\partial ne{t_j}}}{{\partial {w_{ij}}}}\end{align}
 \begin{align} \frac{{\partial ne{t_j}}}{{\partial {w_{ij}}}} = \frac{\partial }{{\partial {w_{ij}}}}\left( {\mathop \sum \limits_{k = 1}^n {w_{kj}}{o_k}} \right) = \frac{\partial }{{\partial {w_{ij}}}}{\rm{\;}}{w_{ij}}{o_i} = {\rm{\;}}{o_i}\end{align}
The problems of searching the cost function minimums are solved through different optimisers, generically known as the SGD [Reference Hastie, Tibshirani and Friedman99]. These optimisers are responsible for avoiding the solution from getting trapped in any of the local minimums that the cost function presents when it is not a convex function, for which each of them has implemented different strategies to find the global optimum. In the present work, the adaptive moment estimation (ADAM) optimiser has been used because it is one of the most efficient optimisers in terms of its high convergence speed and robust stability [Reference Kingma and Ba100], which is an improved version of the RMSProp that implements a variable/adaptive speed (or learning step) and a moment or inertia that tries to avoid getting caught in the local minima of the cost function. The following group of Equations (3) describes the update of the weights by the ADAM optimiser [Reference Kingma and Ba100].
 \begin{align} {m_w}^{\left( {t + 1} \right)} \leftarrow {\beta _1}{m_w} + \left( {1 + {\beta _1}} \right){\rm{\;}}{\nabla _{w\;}}{l^{\left( t \right)}}\end{align}
 \begin{align} {v_w}^{\left( {t + 1} \right)} \leftarrow {\beta _2}{v_w}^{\left( t \right)} + \left( {1 - {\beta _2}} \right){\rm{\;}}{({\nabla _{w\;}}{l^{\left( t \right)}})^2}\end{align}
 \begin{align} {\hat m_w} = \frac{{{m_w}^{\left( {t + 1} \right)}}}{{1 + {\beta _1}^{\left( {t + 1} \right)}}}\end{align}
 \begin{align} {\hat v_w} = \frac{{{v_w}^{\left( {t + 1} \right)}}}{{1 + {\beta _2}^{\left( {t + 1} \right)}}}\end{align}
 \begin{align} {w^{\left( {t + 1} \right)}} \leftarrow {w^t} - \eta \frac{{{{\hat m}_w}}}{{\sqrt {{{\hat v}_w}} + \varepsilon }}\end{align}
List of flight attributes, and their participation in the different scenarios of the model

RMSE comparison resulting from the learning obtained for each of the ten models, transforming the delay time into a standard distribution (0 mean and 1 for standard deviation), referred to scenario 1 resulting from choosing ten flight attributes, nine inputs (TRF, AEL, ORI, DES, NVU, CDE, MDE, OBS, EAC) and one output (DEM). Source: authors.

Comparative analysis of the ten models’ performance (RMSE), in its original scale of minutes of delay, referred to as scenario 1, choosing ten flight attributes, nine inputs (TRF, AEL, ORI, DES, NVU, CDE, MDE, OBS, EAC) and one output (DEM). Source: authors.

Relative importance coefficients in increasing order, of the nine full flight attributes considered as inputs of scenario 1, when determining the flight delay time (DEM) as output. Source: authors.

Comparative results of the RMSE obtained by the 10 ML/DL models when trained under reduced scenario 2, with only five flight attributes. It can be seen how the model learning performance (in terms of RMSE) is roughly identical to full scenario 1. Source: authors.

RMSE comparative analysis of the 10 models under a more realistic dataset scenario 3 (five inputs: TRF, AEL, ORI, DES, NVU and one output: predicting delay (DEM)), in which the best RFR model obtains an RMSE in predicting flight delay of 33.8 minutes. Source: authors.

Rank of the importance of the five input flight attributes considered in scenario 3 (TRF, DES, ORI, NVU, AEL) in increasing order. Source: authors.

RMSE comparison of models for reduced scenario 4, with three inputs (ORI, NVU, AEL) and DEM as time delay to be predicted, in which the best RFR model obtains the same RMSE of the prediction of flight delay of 33.8 minutes than on scenario 3. Source: authors.

Time distribution of the flight departure delay. Source: authors.

Unimodal distribution (density) function of a flight delay (at departure). Source: authors.

In the Equations (3),
 ${w^{\left( {t + 1} \right)}}$
represents the weights in iteration t + 1;
 $\eta $
represents learning speed or learning step;
 ${\rm{\;}}{\nabla _{w\;}}{l^{\left( t \right)}}$
represents the gradient of the cost function l with respect to the weights;
 $\epsilon$
is a minimum value to avoid dividing by 0 (in keras 10-7 is used);
 ${\beta _1}$
y
 ${\beta _2}$
are the forgetting factors for the gradient or first moment and the second moment respectively;
 ${m_w}^{\left( {t + 1} \right)}$
is the moving mean of the weights or first moments in the iteration t + 1;
 ${v_w}^{\left( {t + 1} \right)}$
is the moving variance (or second moment) of the weights in the iteration t + 1. The variables with hat indicate that they are estimators and the superscripts with the variable t correspond to each of the iterations (or learning cycles). This is the process of fitting the MLP/DL model. On the other hand, in models based on decision trees, the adjustment is made mainly by induction and pruning methods of the decision trees [Reference Aggarwal101, Reference Hassoun102].
The dataset learning process is repeated in this work 150 times (iterations) for the entire dataset and only for the MLP/DL model (considered sufficient to achieve an asymptotic or stable RMSE value), which marks the maximum fine adjustment possible of the model in the learning of the dataset, or until a sufficient adjustment of the error is obtained for the rest of the non-DL models, characterised by belonging to the ensemble or boosting or stacking type, in which they improve the simplest models of decision trees by their appropriate combinations [Reference Rokach82].
To give more robustness to the value of the metrics obtained from the RMSE, k-folds techniques have been implemented [Reference Pedrycz and Chen103, Reference Chang and Lin104]. Specifically, three groups have been applied to divide the dataset between three different ways of grouping the training and test data subsets. The training data, as its name implies, is used to train the model and the test data to evaluate the learning performance of the model. However, the model can never see the test data during the learning process to make an objective evaluation. In addition, with cross-validation techniques this training is repeated a variable number of times. Because target delay flight attribute was standardised as necessary step of data pre-processing, the loss or cost function RMSE of each ML/DL model it is also characterised statistically, in terms of a mean and a standard deviation, resulting all of this in a more robust way performance measured compared to the case when a single configuration of training and test subset is used. It should be emphasised that all these methods are stochastic, due both to the use of the SGD method, and to the own stochastic nature of the dataset, so their results are not deterministic, but rather are probabilistic.
5.4 Statistical examination
Before training, different examinations or statistical controls were applied to have a feature insight. For this purpose, different tests has been implemented to determine if flight attribute distributions are Gaussians (or normal) (Shapiro-Wilk, D’Agostino and Anderson-Darling tests), or whether flight attributes are not correlated with the output (linear Pearson, Spearman Rank, Kendall Rank, and chi-squared tests), or whether the flight attributes are not stationary (ADFuller test), or whether flight attributes have equal distribution as the output (student’s test, paired student, ANOVA, Mann-Whitney U, Kruskal-Wallis H, and Friedman tests). These tests, of statistical characterisation of flight attributes, serve to know amongst other things, whether their learning process will be easy or which data transformation must be required to facilitate it. These techniques are an enhancement of dataset preprocessing to facilitate ML training.
5.5 Determination of the importance of the flight attributes
To rank the importance of flight attributes in determining flight delay time, the permutation importance (PI) method [Reference Altmann, Tolosi, Sander and Lengauer20, Reference Breiman21] has been implemented. This method consists of applying inspection techniques to trainable estimators; each model proposed and configured for this work offers a different response regarding the selection of the most significant attributes of the flights. The PI method consists of randomly permuting the features among themselves and measuring in each case how the output (delay time) varies through the training of the new dataset (permuted or sometimes called corrupted in the scientific literature) with each ML/DL model, which allows establishing the coefficient of importance or the sensitivity of the output (time delay) to each feature j called c j (see Equation (4)).
 \begin{align} {c_j} = s - \;\;\frac{1}{K}\;\mathop \sum \limits_{k = 1}^K {s_{k,j}}\end{align}
In Equation (4) s is the result of training the ML model when it is trained with the D dataset without permuting. Next, each feature j associated with a column of dataset D is randomly permuted with the other features to produce a permuted version of the dataset
 $\tilde D$
(j, k), in which the subscript k represents the repetitions used to manage the features, K is the maximum number of permutations, and s
k, j
is the new result of training the ML model for each feature j repeated k times with the permuted (or corrupted) dataset
 $\tilde D$
(j, k).
6.0 Results
Before training the ten ML/DL models implemented, the outliers (or atypical data values) are removed from the dataset. If they are retained, the models are forced to learn marginal patterns of said flight attributes, which is detrimental to a good generalisation in the prediction of the flight delay time. In this work, four methods have been used to identify and remove outliers, two of which are properly unsupervised ML methods, such as the local outlier factor (LOF) and one class SVM (OCS) methods, which cluster normal data and mark as outliers those that are outside these perimeters of normal values. The third method is Isolation Forest (IF), which applies binary decision tree theory that does not require pre-grouping within standard profiles, making it faster and more efficient in detecting outliers. The fourth method, the elliptic envelope (EE) [Reference Rousseeuw and van Driessen105], calculates the outliers by the method of the minimum covariance determinant, which must meet the applicability condition that the number of samples (flights) must be higher than the square of flight attributes, which is true in this case.
Subsequently, the learning of the ten ML/DL models has been evaluated for four flight attributes selection scenarios, to show the prediction sensitivity of the models depending on which flight attributes are chosen. Table 2 shows the list of flight attributes and indicates in which model scenario each flight attribute participates.
The models’ comparative results of the RMSE performances are shown for full scenario 1. This full scenario 1 removes 6 of the 16 initial flight attributes (because some of the them are redundant), resulting in the ten full following flight attributes: TRF, AEL, ORI, DES, NVU, CDE, MDE, OBS, EAC and DEM, in which the first 9 are inputs and the last one is the output to be predicted (DEM is the delay time measured in minutes) (Fig. 5).
Figure 5 shows the performances, measured with the RMSE metric, are very similar for all models and their value is below 0.5, except for the behaviour of two more dispersed models (MLR and SVR). The RFR model is the one with the highest performance with an RMSE of 0.449 and a standard deviation value of 0.0013, which evidence that the model is robust.
It is already explained on subsection 5.1 (Data), that the DEM flight attribute has been standardised to facilitate the learning of the ML/DL models. For this reason, Fig. 6 shows the results of the ML models performance (measured with the RMSE metric), but in its original scale of delay times in minutes (which is done by reversing the standardisation process applied to the DEM), and evidence that the prediction errors (on their natural minute scale) are less than 16 minutes (for the best RFR model). That is, when introducing the nine flight attributes, a delay time is predicted that has an error of fewer than 16 minutes, which is a remarkable result for the features considered.
Next, reduced scenario 2 is generated, after applying PI method whereby each of the ten ML/DL models auto-selects the five best flight attributes that better determine the delay time, from among the nine full flight attributes inputs of the scenario (the tenth flight attribute is the output). That is, each model ranks the flight attributes inputs by their importance in determining the delay time, assigning them a (relative) importance coefficient.
Figure 7 shows the ranking of importance assigned by the RFR model to the nine input features, in which the last five are the most important (ORI, AEL, NVU, CDE, EAC) in increasing order.
To evaluate the quality selection of the five most important or significant flight attributes (EAC, CDE, NVU, AEL, ORI), now arranged in descending order, the models are retrained with this new reduced scenario 2, considering as output the flight attribute DEM, to compare the learning models performance between the two scenarios. The results of the RMSE obtained in this reduced scenario 2 are shown in Fig. 8, where it can be seen they roughly get the same results when using the nine input flight attributes of full scenario 1. In fact, even the RMSE improves slightly for reduced scenario 2, which shows that the learning patterns are better grasped by the models when they are trained on this reduced scenario 2 (using only the five more significant flight attributes) than when they are trained using the full scenario 1.
Since both scenarios full 1 and reduced 2 involve a series of flight attributes that are measured a posteriori and, therefore, are not known in advance, such as the EAC (flight status according to airport authority standard), CDE (delay code according to Standard IATA Delay Codes-AHM 730), MDE (reason for delay according to Standard IATA Delay Codes-AHM 730) and OBS (observation of flight from the airport authority), in this paper, the four aforementioned flight attributes from the dataset have been removed to make the predictions of flight delay departures more realistic (according to real data known before the flight departure). Particularly, a new realistic scenario 3 is now defined with only six total flight attributes, five of which are inputs (TRF, AEL, ORI, DES, NVU) and one output (DEM).
After models have been conveniently trained, an RMSE of 33.8 minutes is obtained by the best RFR model (approximately double that when the four eliminated flight attributes were retained), results are shown in Fig. 9.
The reason for this loss of precision when eliminating these four keys flight attributes (EAC, CDE, MDE, OBS) is that other variables that are not registered in the dataset may influence the level of delay, such as the type of aircraft (mainly its size), the level of congestion at the airport, weather conditions, ATM conditions, etc. When PI method is applied to scenario 3 of six flight attributes (5 inputs +1 output) to get the importance coefficients of the flight attributes in determining the flight delay time, the significance ranking is shown in Fig. 10 (flight attributes selected by the best RFR model).
Reduced scenario 4 (similar process to get the reduce scenario 2) is generated by applying reduction to scenario 3, to keep only the best three flight attributes that auto select the best (RFR) models when applying the PI method.
Figure 11 shows the comparison of the RMSE for the 10 ML/DL models of scenario 4 consisting of four flight attributes (three inputs: ORI, NVU, AEL, and one output: DEM). The results show that, despite the reduction of features (to only the three most important), the same results are obtained as in scenario 3 when five inputs (flight attributes) are used. This shows that the feature auto-reductions conducted by the PI method have been carried out correctly and, most importantly, the dataset can significantly be reduced or simplified, thereby saving model training time and dataset memory, without any loss in the accuracy of the time delay predictability (DEM).
Figure 12 shows the distribution of the flight delay time (DEM) dataset flight attribute in terms of minimum (-15 minutes) and maximum (240 minutes), with the quantiles 25% and 75% and mean (15 minutes).
Finally, Fig. 13 shows that the continuous distribution function (designated as Density in the figure) of the flight delay time is unimodal, corresponding to the 15 minutes mean of the distribution.
In summary, it can be stated that with the specific dataset flight attributes provided to the models for training purposes, the predictions of the delay time made by the ML/DL models are acceptable. Depending on the scenario considered, such models include error ranges between 16 and 33 minutes, which implies acceptable range values that are similar or even better than those obtained in the related research literature [Reference Truong70, Reference Guo, Yu, Hao, Wang, Jiang and Zong71, Reference Henriques and Feiteira106, Reference Belcastro, Marozzo, Talia and Trunfio107].
7.0 Conclusions
As the periodic reports of the main international civil aviation organisations (IATA, ACI, ICAO, etc.) show, the demand for air transport has evidenced continuous and relevant growth for almost three decades. Airport authorities around the world are trying to respond to this demand by expanding air infrastructure, building new airports, optimising the use of existing capacity, improving ATM procedures, etc. Even so, many airports (mainly large and international ones) continue to present congestion (often severe in certain periods of the day), a situation that inevitably leads to delays, which can be aggravated by adverse weather. Therefore, the most accurate prediction methods have become indispensable, as they contribute to formulating strategies (efficient use of capacity, better management of operations, optimisation of ATM procedures, etc.) to mitigate the proliferation of delays and prevent their spread into other airports in the network.
Therefore, the present research proposes a comparative analysis of the performance (measured in RMSE) of flight time delay prediction (at the departure of a flight) of ten ML/DL models under different scenarios configured by the known flight attributes registered on the dataset for each flight. The ML models are in their most advanced variants (combinatorial models), such as ensemble techniques in their different methodologies such as voting, bagging algorithms (e.g., segmenting the dataset to obtain the advantages of training each model with different subsets), stacking (using outputs from some models to train others) and boosting (specifically penalising unwanted errors). All these strategies serve to compensate or balance the errors of each model, so that the ensemble ML models focus on generalising better the learning process. The DL/MLP model has also been included in the comparison (although it was not the winning model because it was not adjusted in its design parameters and hyperparameters). The comparative RMSE results for the transformed time delay (using standardised output data) are of the order of 0.45 and 0.96 (for the winning RFR model) depending on the flight attributes, or scenarios considered in the training process, which translates into (acceptable) prediction range errors between 16 and 33 minutes in time delay flights departures.
On the other hand, in this work the PI method is implemented, which allows the input flight attribute to be auto ranked by their importance in determining the time delay by each model. Said flight attribute selection is re-evaluated on the corresponding reduced dataset scenarios, verifying that said auto reductions do not affect the precision (RMSE) of the time delay forecast and, in addition, allow reducing the size of the dataset.
Finally, although for the study case implemented here there is an extensive database of flight departures for a whole year associated with the entire national airport network and with many flight attributes (linked to each flight), there are constraints that prevent better ML performance. That is, certain important flight attributes are missing (e.g., weather conditions, aircraft size, airport congestion level, ATM condition, runway system capacity, aircraft turnaround time, etc.), that if included in the dataset could significantly improve the time delay ML prediction. Another possible line of research would be to compare the behaviour of the prediction models developed here for the current case study (Colombian air transport system and using the same flight attributes) with another case study (air transport system of another country) with the same or similar characteristics.



